. 2022 Aug 30;119(35):e2122734119.
doi: 10.1073/pnas.2122734119. Epub 2022 Aug 22.

A single introduction of wild rabbits triggered the biological invasion of Australia

Affiliations

A single introduction of wild rabbits triggered the biological invasion of Australia

Joel M Alves et al. Proc Natl Acad Sci U S A. .

Abstract

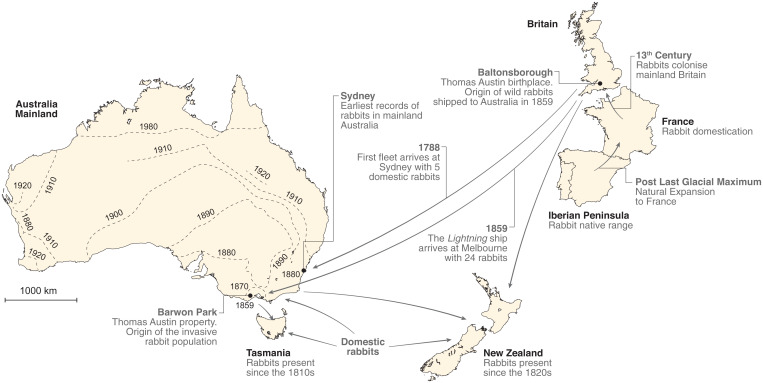
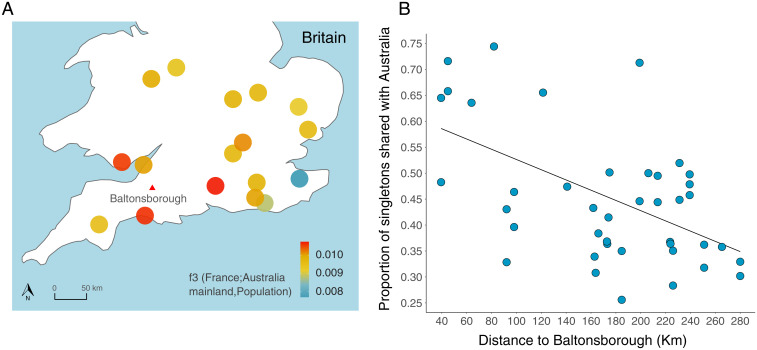
Biological invasions are a major cause of environmental and economic disruption. While ecological factors are key determinants of their success, the role of genetics has been more challenging to demonstrate. The colonization of Australia by the European rabbit is one of the most iconic and devastating biological invasions in recorded history. Here, we show that despite numerous introductions over a 70-y period, this invasion was triggered by a single release of a few animals that spread thousands of kilometers across the continent. We found genetic support for historical accounts that these were English rabbits imported in 1859 by a settler named Thomas Austin and traced the origin of the invasive population back to his birthplace in England. We also find evidence of additional introductions that established local populations but have not spread geographically. Combining genomic and historical data we show that, contrary to the earlier introductions, which consisted mostly of domestic animals, the invasive rabbits had wild ancestry. In New Zealand and Tasmania, rabbits also became a pest several decades after being introduced. We argue that the common denominator of these invasions was the arrival of a new genotype that was better adapted to the natural environment. These findings demonstrate how the genetic composition of invasive individuals can determine the success of an introduction and provide a mechanism by which multiple introductions can be required for a biological invasion.

Keywords: allele surfing; exome sequencing; invasion biology; population expansion.


Conflict of interest statement

The authors declare no competing interest.

Figures

Fig. 1.
Fig. 1.
The colonization route of the European rabbit from the Iberian Peninsula to Australia and New Zealand. Arrows represent introductions. Dashed lines in mainland Australia show the frontier of spread of rabbits across the continent from the Thomas Austin property in Barwon Park (based on Stodart and Parer, ref. 21).
Fig. 2.
Fig. 2.
Genetic diversity of rabbit populations. (A) Mean genetic diversity for the different rabbit populations. Dots show mean values where each chromosome is weighted equally. Confidence intervals correspond to the 0.025 and 0.975 quantiles of 100 bootstrap estimations obtained with subsampling and replacement of chromosomes. (B) Unfolded allele frequency spectrum (SFS) for France (gray), Britain (blue), and mainland Australia (red). The x axis shows the derived allele frequency. The y axis shows the number of variants for each category. Confidence intervals correspond to 95% bootstrap confidence intervals obtained by resampling sites with replacement. Analysis only for variants in the protein-coding sequence (CDS) and restricted to 25 individuals per population. The estimates for Australia in both analyses do not include Cattai and Sydney rabbits.
Fig. 3.
Fig. 3.
Genetic structure and ancestry of rabbit populations. (A) Map of mainland Australia with location of samples. Gray circles correspond to Cattai, white circles to Sydney. (B) Principal component analysis of rabbits from wild and domestic rabbits. Dashed circles highlight individuals from Cattai and Sydney. (C) Ancestry fractions estimated with Admixture assuming three ancestral populations (K = 3). Each bar represents one individual and is colored according to the ancestry proportions. (D) f3 statistics of rabbit populations reflecting the shared genetic drift between mainland Australian populations, New Zealand, Tasmania, and rabbits from Britain (Top) or domestic rabbits (Bottom). Bars correspond to the SE. (E) Historical relationships among populations reconstructed with allele frequency data using the TreeMix program. The branch lengths reflect the amount of genetic drift, and the scale bar shows 10 times the mean SE of the entries in the sample covariance matrix. The numbers are percent bootstrap support calculated by resampling blocks of SNPs 1,000 times.
Fig. 4.
Fig. 4.
Mitochondrial genealogy. (A) Maximum clade credibility tree reconstructed with whole mitochondrial genomes, with reconstruction of ancestral geographical location of lineages. Branches and labels are colored according to the population of origin. Label codes correspond to country and region. Highlighted labels show Cattai and Sydney individuals. (B) Median number of migrations inferred into populations in mainland Australia, Tasmania, and New Zealand. Error bars are 95% credible intervals. Values in red were included in >95% of BSSVS models.
Fig. 5.
Fig. 5.
The effect of range expansion on genetic variation and structure. (A) Correlation between pairwise genetic and geographic distance for 62 mainland Australian samples. Genetic distance is calculated using only segregating sites. The regression line in red was calculated between all pairs of individuals except Cattai (white) and Sydney (gray). Pairwise comparisons between samples from the same location were not plotted (24 of 1,891 comparisons). (B) Principal component analysis of mainland Australian rabbits excluding Sydney and Cattai. Color pallet reflects the distance in kilometers to Thomas Austin property in Barwon Park, and symbol shape identifies the population of origin. (C) Genetic diversity in four different regions in mainland Australia. Since our sampling is not uniform, we focused on four distant locations (Victoria/NSW, South Australia, Queensland, and Western Australia) for which we aggregated the seven individuals that were geographically closest in each region. Dots show mean values where each chromosome is weighted equally. The 95% confidence intervals are from 100 bootstrap estimations obtained by sampling with replacement of chromosomes. (D) Effect of allele surfing in Australia. The frequency of alleles that are absent from domestic and British populations across four different mainland Australian populations. Allele frequencies are reported for the same seven rabbits used for genetic diversity estimates (C). Bars are colored by population.
Fig. 6.
Fig. 6.
British origin of Australian populations. (A) Map of the south of Britain. Circles show 17 populations colored according to the f3 statistics value, reflecting the degree of shared ancestry with Australia. Populations were defined based on the British county of each rabbit. The red triangle marks the location of Baltonsborough village, the residence of the Austin family where the wild rabbits imported to Barwon Park are believed to be originated from. (B) Correlation between the proportion of singletons in British individuals shared with the Australian population (excluding Cattai and Sydney) and the distance to Baltonsborough in kilometers. Alleles that were singletons in Britain but present in domestic rabbits were excluded from the analysis.

References

    1. Ehrenfeld J. G., Ecosystem consequences of biological invasions. Annu. Rev. Ecol. Evol. Syst. 41, 59–80 (2010).
    1. Diagne C., et al. , High and rising economic costs of biological invasions worldwide. Nature 592, 571–576 (2021). - PubMed
    1. Zenni R. D., Nuñez M. A., The elephant in the room: The role of failed invasions in understanding invasion biology. Oikos 122, 801–815 (2013).
    1. Simberloff D., The role of propagule pressure in biological invasions. Annu. Rev. Ecol. Evol. Syst. 40, 81–102 (2009).
    1. Lau J. A., terHorst C. P., Causes and consequences of failed adaptation to biological invasions: The role of ecological constraints. Mol. Ecol. 24, 1987–1998 (2015). - PubMed

Publication types

LinkOut - more resources