. 2022 Oct 1;45(10):2360-2368.
doi: 10.2337/dc21-2543.

Glycemic Variability Patterns Strongly Correlate With Partial Remission Status in Children With Newly Diagnosed Type 1 Diabetes

Collaborators, Affiliations

Glycemic Variability Patterns Strongly Correlate With Partial Remission Status in Children With Newly Diagnosed Type 1 Diabetes

Olivier G Pollé et al. Diabetes Care. .

Abstract

Objective: To evaluate whether indexes of glycemic variability may overcome residual β-cell secretion estimates in the longitudinal evaluation of partial remission in a cohort of pediatric patients with new-onset type 1 diabetes.

Research design and methods: Values of residual β-cell secretion estimates, clinical parameters (e.g., HbA1c or insulin daily dose), and continuous glucose monitoring (CGM) from 78 pediatric patients with new-onset type 1 diabetes were longitudinally collected during 1 year and cross-sectionally compared. Circadian patterns of CGM metrics were characterized and correlated to remission status using an adjusted mixed-effects model. Patients were clustered based on 46 CGM metrics and clinical parameters and compared using nonparametric ANOVA.

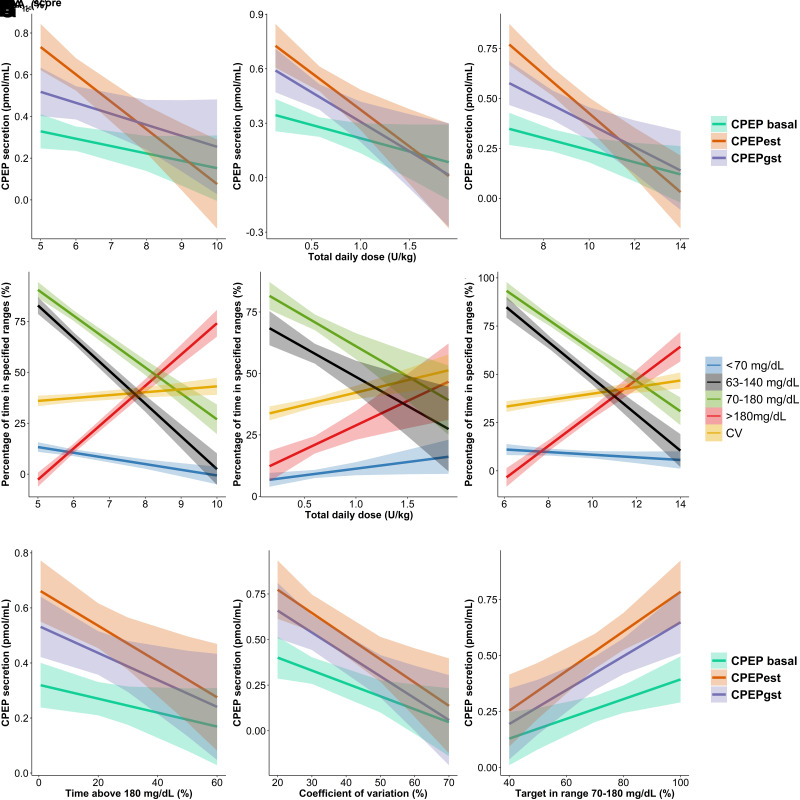
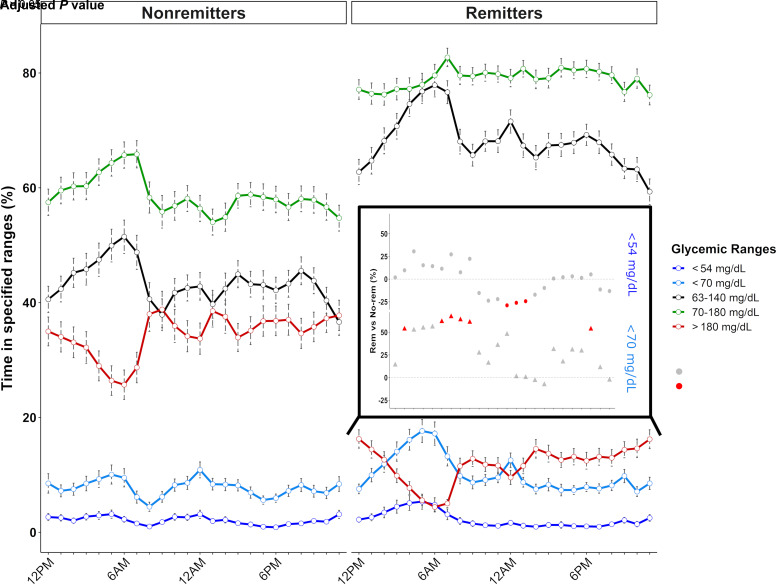
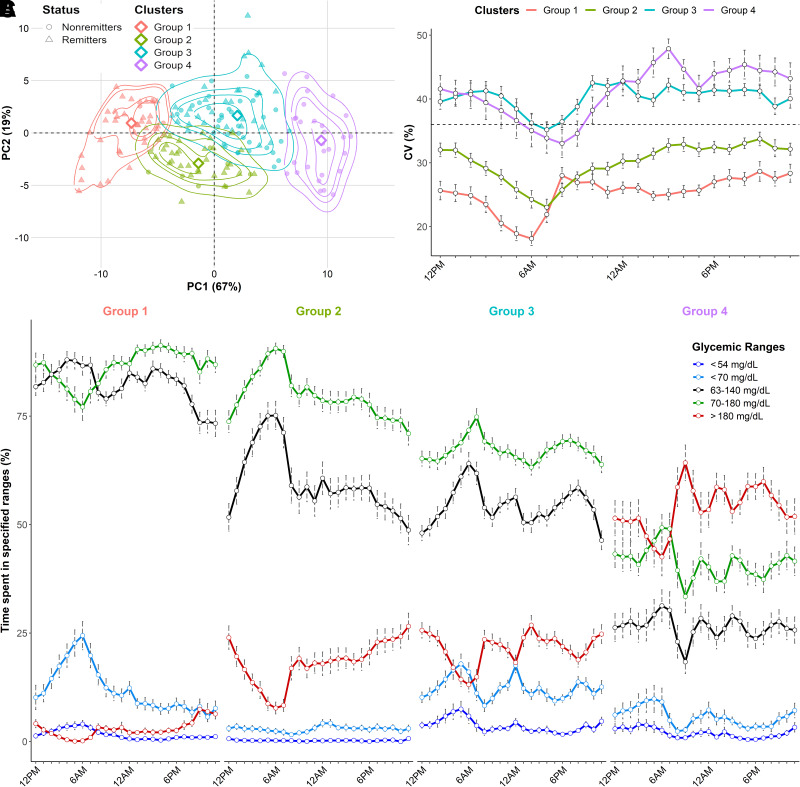
Results: Study participants had a mean (± SD) age of 10.4 (± 3.6) years at diabetes onset, and 65% underwent partial remission at 3 months. β-Cell residual secretion estimates demonstrated weak-to-moderate correlations with clinical parameters and CGM metrics (r2 = 0.05-0.25; P < 0.05). However, CGM metrics strongly correlated with clinical parameters (r2 >0.52; P < 0.05) and were sufficient to distinguish remitters from nonremitters. Also, CGM metrics from remitters displayed specific early morning circadian patterns characterized by increased glycemic stability across days (within 63-140 mg/dL range) and decreased rate of grade II hypoglycemia (P < 0.0001) compared with nonremitters. Thorough CGM analysis allowed the identification of four novel glucotypes (P < 0.001) that segregate patients into subgroups and mirror the evolution of remission after diabetes onset.

Conclusions: In our pediatric cohort, combination of CGM metrics and clinical parameters unraveled key clinical milestones of glucose homeostasis and remission status during the first year of type 1 diabetes.

Trial registration: ClinicalTrials.gov NCT04007809.


Figures

Figure 1
Figure 1
Relations among β-cell residual secretion, routine clinical parameters of glycemic control, and CGM metrics during the first year of type 1 diabetes. Residual β-cell secretion was evaluated at 3 and 12 months after diagnosis. Routine clinical parameters and CGM metrics were obtained at 3, 6, 9, and 12 months after diagnosis. Correlation analyses were performed on all data. AC and GI represent linear regression with 95% CI bands (shaded zone) between endogenous residual insulin secretion (i.e., CPEPEST, CPEPBASAL, and CPEPSTIM) and HbA1c (A), daily insulin dose (B), IDAA1c score (C), time >180 mg/dL (G), CV (H), and time between 70 and 180 mg/dL (I). DF represent linear regression with 95% CI bands (shaded zone) between CGM metrics (i.e., glycemia <70 mg/dL, between 63 and 140 mg/dL, between 70 and 180 mg/dL, and >180 mg/dL and CV) and HbA1c (D), insulin daily dose (E), and IDAA1c score (F). Regression coefficients (r2) are shown according to the secretion method (A–C, G–I) and CGM metrics (F–H). The level of significance of the correlations is represented after the r2 value as follows: *P < 0.05, **P < 0.01, ***P < 0.001. Significant regression coefficients are indicated in boldface.
Figure 2
Figure 2
Daily patterns of time spent in defined glycemic ranges during the first year of type 1 diabetes regarding the remission status. Routine clinical parameters and CGM metrics were obtained at 3, 6, 9, and 12 months after diagnosis. Lines represent the mean percentage of time spent <54 mg/dL (dark blue), <70 mg/dL (light blue), between 63 and 140 mg/dL (black), between 70 and 180 mg/dL (green), and >180 mg/dL (red). Error bars represent the SEs. The inset panel represents the daily variation in the amplitude of differences for values <70 mg/dL (triangles) and <54 mg/dL (circles) between remission groups based on a linear mixed model (i.e., the percentage >0% [dashed black line] defining higher values in remitters, percentage <0% defining lower values in remitters). The significance level of the differences is represented by the color of the points as follows: red dots correspond to P < 0.05, and gray dots represent P > 0.5. No-rem, nonremitters; Rem, remitters.
Figure 3
Figure 3
Illustration and characterization of glycemic clusters identified by unsupervised hierarchical clustering on CGM metrics and clinical data during the first year of diabetes. Routine clinical parameters and CGM metrics were obtained at 3, 6, 9, and 12 months after diagnosis. A: Repartition of the clustering groups across the principal component analysis data. The empirical distributions of the patients across each group are represented by isoprobability contours of kernel densities at 25th, 50th, 75th, and 95th percentiles. The medoid of each group is represented by a diamond. B: Circadian evolution of CV (%) according to the clustering groups. The dashed line represents the threshold of 36%. C: Daily patterns of time spent in defined glycemic ranges <54 mg/dL (dark blue), <70 mg/dL (light blue), between 63 and 140 mg/dL (black), between 70 and 180 mg/dL (green), and >180 mg/dL (red). Error bars represent the SEs. Gray horizontal bars represent nighttime, and orange horizontal bars represent daytime.

References

    1. van Belle TL, Coppieters KT, von Herrath MG. Type 1 diabetes: etiology, immunology, and therapeutic strategies. Physiol Rev 2011;91:79–118 - PubMed
    1. Nielens N, Pollé O, Robert A, Lysy PA. Integration of routine parameters of glycemic variability in a simple screening method for partial remission in children with type 1 diabetes. J Diabetes Res 2018;2018:5936360. - PMC - PubMed
    1. Mortensen HB, Hougaard P, Swift P, et al. .; Hvidoere Study Group on Childhood Diabetes . New definition for the partial remission period in children and adolescents with type 1 diabetes. Diabetes Care 2009;32:1384–1390 - PMC - PubMed
    1. Palmer JP, Fleming GA, Greenbaum CJ, et al. . C-peptide is the appropriate outcome measure for type 1 diabetes clinical trials to preserve beta-cell function: report of an ADA workshop, 21-22 October 2001. Diabetes 2004;53:250–264 - PubMed
    1. Atkinson MA, Roep BO, Posgai A, Wheeler DCS, Peakman M. The challenge of modulating β-cell autoimmunity in type 1 diabetes. Lancet Diabetes Endocrinol 2019;7:52–64 - PMC - PubMed