. 2022 Nov:115:54-67.
doi: 10.1016/j.exphem.2022.08.003. Epub 2022 Aug 20.

EGR1 Haploinsufficiency Confers a Fitness Advantage to Hematopoietic Stem Cells Following Chemotherapy

Affiliations

EGR1 Haploinsufficiency Confers a Fitness Advantage to Hematopoietic Stem Cells Following Chemotherapy

Angela Stoddart et al. Exp Hematol. 2022 Nov.

Abstract

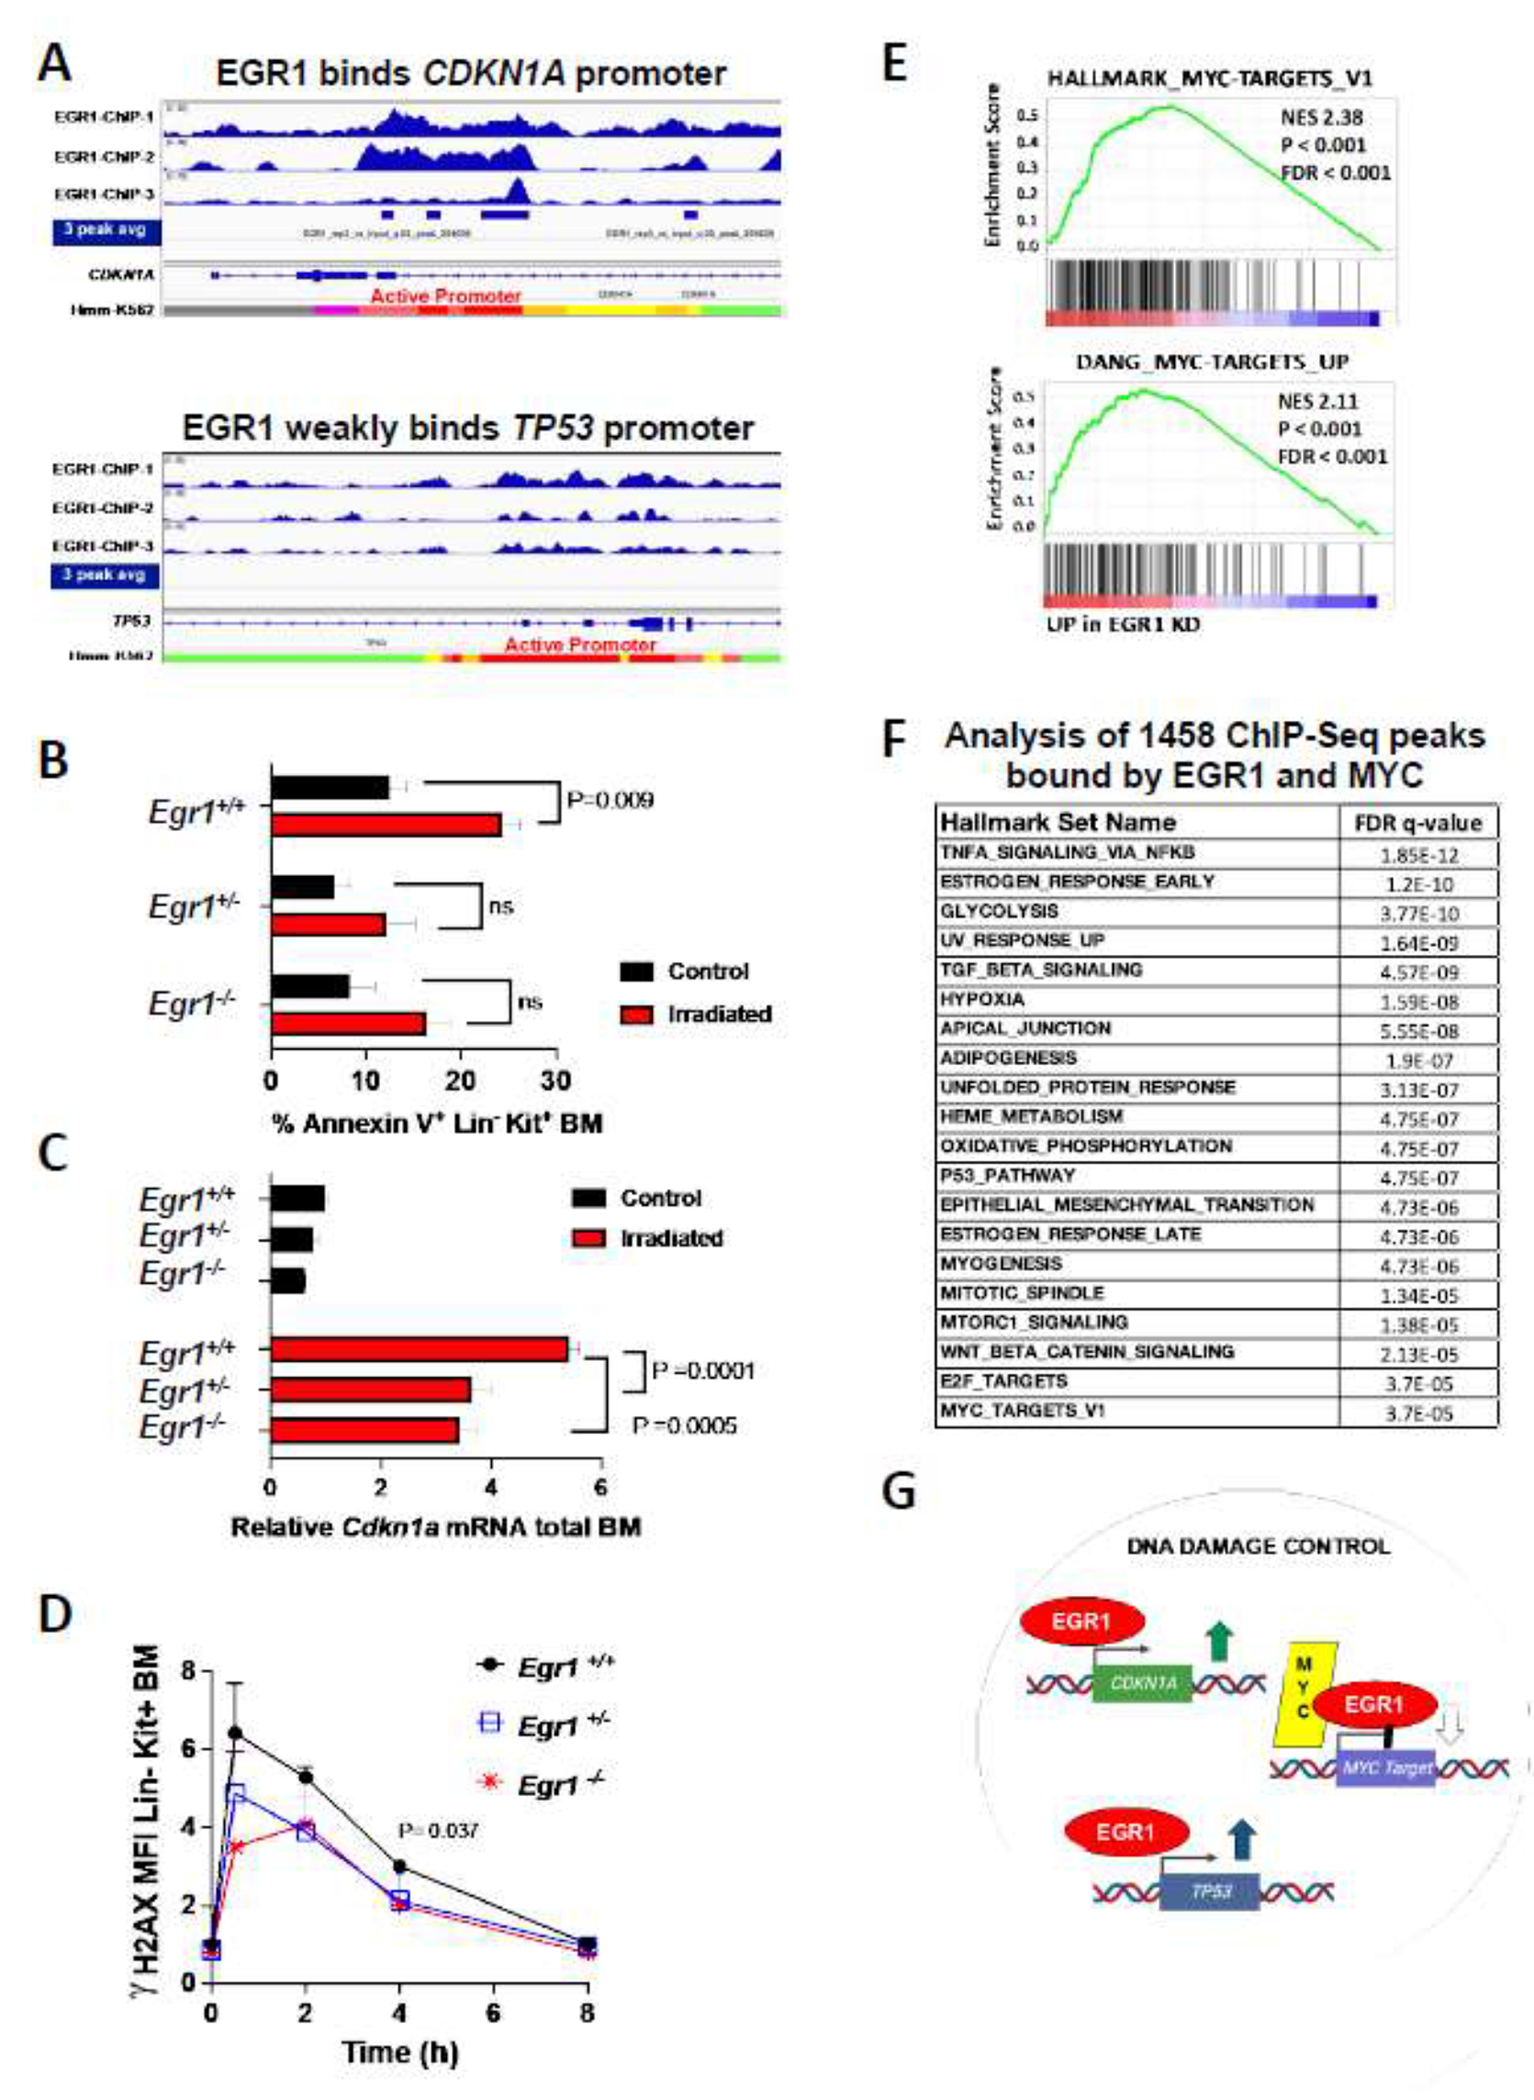
Therapy-related myeloid neoplasms (t-MNs) share many clinical and molecular characteristics with AML de novo in the elderly. One common factor is that they arise in the setting of chronic inflammation, likely because of advanced age or chemotherapy-induced senescence. Here, we examined the effect of haploinsufficient loss of the del(5q) tumor suppressor gene, EGR1, commonly deleted in high-risk MNs. In mice, under the exogenous stress of either serial transplant or successive doses of the alkylating agent N-ethyl-nitrosourea (ENU), Egr1-haploinsufficient hematopoietic stem cells (HSCs) exhibit a clonal advantage. Complete loss of EGR1 function is incompatible with transformation; mutations of EGR1 are rare and are not observed in the remaining allele in del(5q) patients, and complete knockout of Egr1 in mice leads to HSC exhaustion. Using chromatin immunoprecipitation sequencing (ChIP-seq), we identified EGR1 binding sites in human CD34+ cord blood-derived stem and progenitor cells (HSPCs) and found that EGR1 binds genes critical for stem cell differentiation, inflammatory signaling, and the DNA damage response. Notably, in the chromosome 5 sequences frequently deleted in patients, there is a significant enrichment of innate and inflammatory genes, which may confer a fitness advantage in an inflammatory environment. Short hairpin RNA (shRNA)-mediated silencing of EGR1 biases HSPCs toward a self-renewal transcriptional signature. In the absence of EGR1, HSPCs are characterized by upregulated MYC-driven proliferative signals, downregulated CDKN1A (p21), disrupted DNA damage response, and downregulated inflammation-adaptations anticipated to confer a relative fitness advantage for stem cells especially in an environment of chronic inflammation.


Conflict of interest statement

Conflict of interest disclosure The authors declare no potential conflicts of interest.

Figures

Figure 1.
Figure 1.. Expansion of Egr1 haploinsufficient HSCs under exogenous stress.
(A, B) Egr1+/+, Egr1+/−, and Egr1−/− bone marrow cells were serially transplanted into lethally irradiated (8.5 Gy) CD45.1 wild-type recipients, every 2 months. Mice survived the 4th transplant because of the persistence of residual CD45.1+ recipient stem cells. The percent of total Egr1 donor (CD45.2+) cells (A) and percent of CD11b+ Egr1 donor cells (B) in the peripheral blood at 2 months post-transplant is shown. Egr1+/− cells show preferential expansion by the 4th transplant, with a small myeloid bias. (C) The percent of Egr1 donor cells that engraft into recipient mice, 16 hours after transplant, is plotted. Only Egr1−/− cells display enhanced homing. (D) Egr1 test (CD45.2) and competitor (CD45.1) BM (1:1) were transplanted; 4 weeks after transplant, ENU was administered twice, 9 days apart. BM cells were analyzed 8 weeks after the final ENU injection. The percentage of Egr1 (CD45.2+) cells in each LSK (Lin/Sca1+/Kit+) population is shown. LT-HSC: CD150+/CD48/CD135; ST-HSC: CD150/CD48/CD135; MPP2: CD150+/CD48+/CD135; MPP3: CD150/CD48+/CD135; MPP4: CD150/CD135+. For all graphs, the mean ± SEM and student t test between indicated samples are shown. Under exogenous cytotoxic stress, Egr1+/− HSCs display a greater expansion, as compared to wild-type and Egr1−/− cells.
Figure 2.
Figure 2.. Exhaustion of Egr1−/−, but not Egr1+/− HSCs, after 5-FU.
Egr1+/+, Egr1+/− and Egr1−/− mice were treated with 1 dose of 5-FU (150 mg/kg) and cells were harvested either 6 or 12 days later. Six days post 5-FU, LinSca1+ progenitors were stained with Ki-67 to measure proliferation (A) or Annexin V to measure apoptosis (B). The Kit marker is not expressed immediately following 5-FU and, thus, could not used. Compared to wild-type littermate controls, both Egr1+/− and Egr1−/− progenitors were more proliferative, but no change in apoptosis was observed. (C) The total number of bone marrow cells, 12 d post 5-FU. (D) The number of WBC (K/ul) was measured at day 0-, 5-, 10-, and 12-days post 5-FU, (n=5-7 mice per genotype). (E) Twelve days post 5-FU, the absolute number of stem cell populations was determined. There was a trend towards expansion of Egr1+/− stem cells compared to wild-type and Egr1−/− cells. For all graphs, the mean ± SEM and student t test between indicated samples are shown. * p<0.05; ** p<0.01; *** p<0.001.
Figure 3.
Figure 3.. EGR1 transcriptionally regulates HSC self-renewal, differentiation, and inflammatory pathways.
(A) Mean EGR1 expression values (± SEM) in hematopoietic stem and progenitor (HSPC), granulocytic (GRAN), monocytic (MONO), erythroid (ERY), megakaryocytic (MEGA), and B, T, and natural killer (NK) lymphoid cell populations were obtained from Broad’s Differentiation Map dataset (DMAP). (B) Primary human CD34+ HSPCs (cord blood derived) were transduced with a shRNA specific for EGR1 or nonspecific control (Renilla). Four days later, GFP+ cells were sorted and RNA was prepared for sequencing analysis, with two biological replicates. (C) Quantitative PCR analysis of EGR1 expression in shRNA-sorted HSPCs (left graph). The mean ± SEM of 2 biological replicates done in triplicate are shown. EGR1 expression (mean ± SEM) in del(5q) (n=10) and non-del(5q) (n=28) t-MN patient samples derived from GSE39991 (right graph). Both EGR1 KD and del(5q) samples display haploinsufficient EGR1 expression. (D, F) Gene set enrichment analysis (GSEA) of RNA-sequencing data. The proliferative data set was defined by Venezia et al.. The neutrophil and monocyte fate and HSPC cell cycle were defined by Giladi’s single cell study (E) Significantly up- and down-regulated Hallmark collection gene sets after EGR1 knockdown. (G) BM was isolated from one year old mice and plated in conditions to enumerate CFU-M or CFU-E colonies. (H) Lineage depleted BM was plated in methylcellulose (M3434) and replated after 7 days. Number of colonies after 2nd passage are shown. A minimum of three mice for each genotype were used to generate the mean colony number ± SEM and student t test between indicated samples are shown. * p<0.05; ** p<0.01; *** p<0.001. Haploinsufficient loss of EGR1 alters the transcriptional fate of HSPCs towards an uncharacteristic proliferative, stem-like state with a decrease in inflammatory response genes.
Figure 4.
Figure 4.. EGR1 and other del(5q) genes regulate inflammatory stress response genes.
(A) The 172 Hallmark and GO genes downregulated after EGR1 knockdown were further characterized by Reactome and KEGG pathway analysis. Growth factor receptor signaling is downregulated with loss of EGR1. (B) DAVID functional annotation clustering of 258 genes within 5q14-q34. Clustering revealed an enrichment of innate immunity and inflammatory response genes. The enrichment score of each cluster (group of terms with similar biological meaning) is based on the EASE score of each term member; the higher the value, the more enriched. (C) GSEA of the 21 del(5q) genes enriched for innate immunity and inflammatory response. Fourteen of the genes were expressed at significantly lower levels in cells of del(5q) patients (GSE39991). (D) Lineage-depleted BM cells were cultured in serum-free media (StemSpan) with IL1 (50 ng/ml), IFNγ (100 ng/ml) or LPS (100 ng/ml) for four days. The mean percent of LinKit+ cells ± SEM and results of student t test at day 4 are shown. (E) BM cells from Egr1 mice were subjected to IL3 and IL6 for 30 min to induce Egr1 expression. The mean relative Egr1 expression ± SEM of three biological replicates done in triplicate are shown. Although an increase in overall expression is observed, Egr1 mRNA levels are maintained at haploinsufficient levels.
Figure 5.
Figure 5.. EGR1 ChIP-seq in human HSPCs.
Model-Based Analysis of ChIP-Seq (MACS) identified 32,753 genome-wide locations of transcription factor binding (FDR<0.05). A high confidence set of 7416 EGR1 binding sites (FDR < 1 x10⁻⁵) was used for all analyses. (A) Motif identified from EGR1 ChIP-seq data is significantly enriched for the EGR1 binding site. (B) Profile of regions EGR1 binds relative to the TSS in HSPCs, defined by GREAT analysis. (C) EGR1 binding sites <5kb from a TSS were further analyzed. Each black dot represents the distance of EGR1 binding relative to the closest TSS. Most target genes have an EGR1 binding site <1 kb from a TSS. Distribution of EGR1 peaks in promoters vs. enhancers in (D) Enhancer Atlas (CD34+ cells,) or (E) in Encode’s Chrom-HMM defined chromatin states for K562.
Figure 6.
Figure 6.. EGR1 targets are significantly enriched for genes that regulate stem cell differentiation and inflammation.
(A) The most significantly enriched GO biological processes using the predicted EGR1 target genes (from GREAT analysis) with a binomial fold enrichment >2. Terms were significant by both binomial (FDR< 0.00001) and hypergeometric tests (FDR<0.05). (B) The top 4 Panther Pathways with an FDR <0.05 by binomial test, with a >1.79-fold enrichment. (C) GSEA analysis of gene expression after EGR1 KD. A significant enrichment of downregulated genes in Panther’s IFNG and p38MAPK pathways following EGR1 KD are shown. (D) A schematic of the JUN/FOS gene STRING network. A ‘+’ sign indicates that gene was a predicted EGR1 target by GREAT analysis. A red ‘+’ sign indicates that the EGR1 binds within 1kb of the gene’s TSS. (E) GSEA analysis of gene expression after EGR1 KD. Most genes in the JUN/FOS string network are downregulated after EGR1 KD. (F) A representative ChIP-Seq analysis illustrating EGR1 binds the promoter region of JUN. EGR1 peaks in HSPCs (triplicate) overlap with ENCODE’s H3K4me3 and H3K27ac deposition, epigenetic marks of active promoters, and CAGE-tag data, which maps TSSs.
Figure 7.
Figure 7.. EGR1 regulates DNA damage response in HSPCs.
(A) ChIP-seq analysis of CD34+ HSPCs illustrating EGR1 binding to the promoter region of CDKN1A (p21) and TP53. The Broad ChromHMM track for K562 is shown to illustrate the promoter region (red). (B-C) Mouse BM cells were irradiated ex vivo with 0 or 2 Gy. (B) The percent of Annexin V+ cells in the LinKit+ gate was enumerated 24 hours post-irradiation (IR), or (C) the relative Cdkn1a expression was measured 4 hours post-IR. Mean ± SEM for 3 biological replicates is shown. Student t test was used between indicated samples. (D) γH2AX induction was measured by flow cytometry at 0.5, 2, 4, and 6 hours after IR. Lin−Kit+ cells were gated and γH2AX mean fluorescent intensity (MFI) was normalized to the 0 h timepoint (0 Gy) for each experiment. Mean ± SEM for 3 biological replicates is shown. Student t test comparing Egr1+/+ vs. Egr1+/− or Egr1−/− was done for each time point. A significant difference was only observed between Egr1+/+ vs. Egrt−/− cells at 4 h (P=0.037). (E) GSEA of differentially expressed genes after EGR1 KD in CD34+ HSPCs using the Hallmark and curated gene set from the MSigDatabase. (F) 1458 peaks of CD34+ HSPC EGR1 ChIP-seq peaks that overlap with ENCODE’s K562 MYC ChIP-seq peaks were subjected to GREAT analysis. The Hallmark gene sets that are statistically enriched for the 1717 shared target genes are listed. (G) EGR1 is a key player for DNA damage control in HSPCs. It normally binds and upregulates CDKN1A and TP53 and downregulates MYC target genes, possibly by competing with MYC for shared binding sites.

References

    1. McNerney ME, Godley LA, Le Beau MM. Therapy-related myeloid neoplasms: when genetics and environment collide. Nat Rev Cancer. 2017;17(9):513–527. - PMC - PubMed
    1. Appelbaum FR, Gundacker H, Head DR, et al. Age and acute myeloid leukemia. Blood. 2006;107(9):3481–3485. - PMC - PubMed
    1. Bello C, Yu D, Komrokji RS, et al. Outcomes after induction chemotherapy in patients with acute myeloid leukemia arising from myelodysplastic syndrome. Cancer. 2011;117(7):1463–1469. - PMC - PubMed
    1. Lindsley RC, Mar BG, Mazzola E, et al. Acute myeloid leukemia ontogeny is defined by distinct somatic mutations. Blood. 2015;125(9):1367–1376. - PMC - PubMed
    1. Gillis NK, Ball M, Zhang Q, et al. Clonal haemopoiesis and therapy-related myeloid malignancies in elderly patients: a proof-of-concept, case-control study. Lancet Oncol. 2017;18(1):112–121. - PMC - PubMed

Publication types