. 2022 Sep:479:153292.
doi: 10.1016/j.tox.2022.153292. Epub 2022 Aug 20.

C. elegans toxicant responses vary among genetically diverse individuals

Affiliations

C. elegans toxicant responses vary among genetically diverse individuals

Samuel J Widmayer et al. Toxicology. 2022 Sep.

Abstract

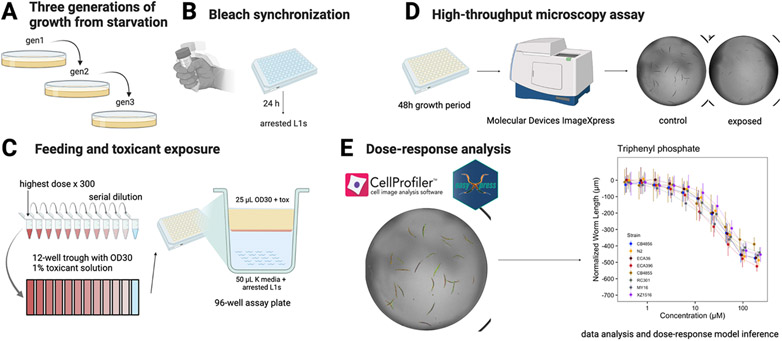
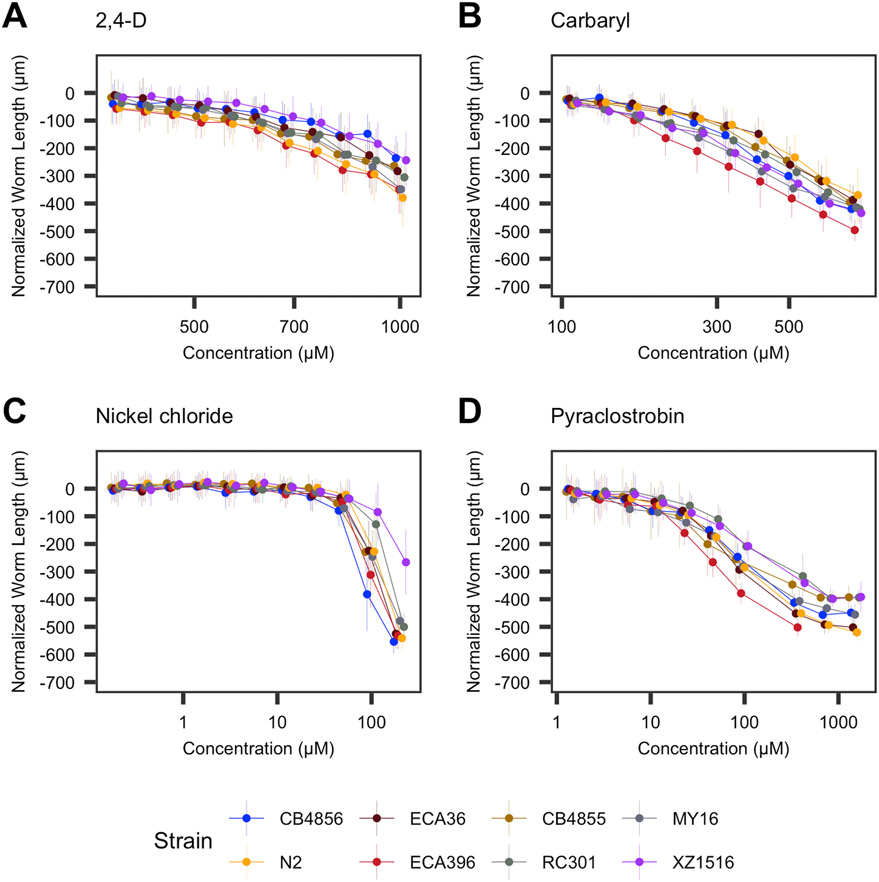
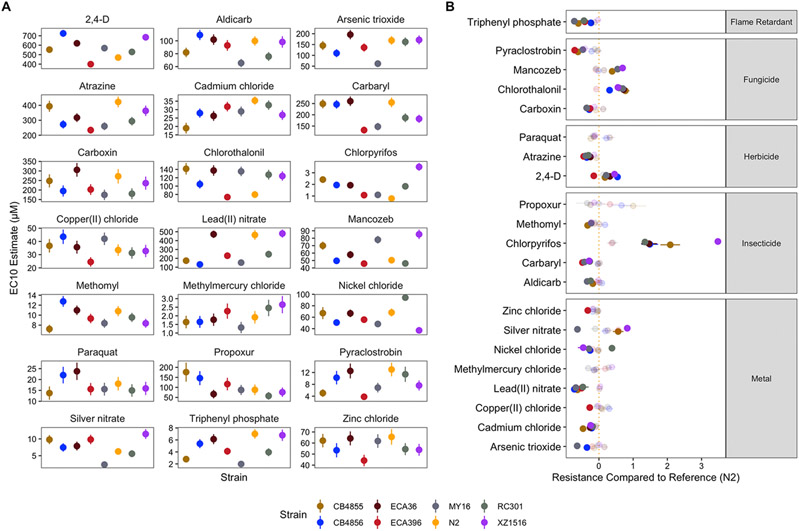
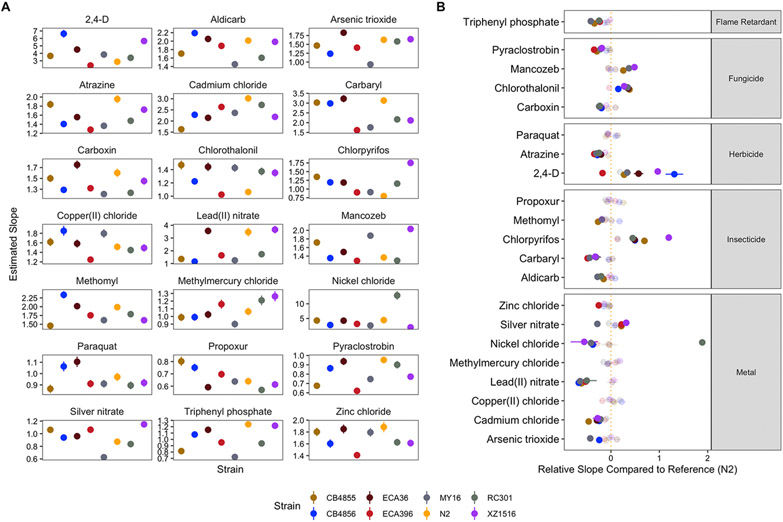
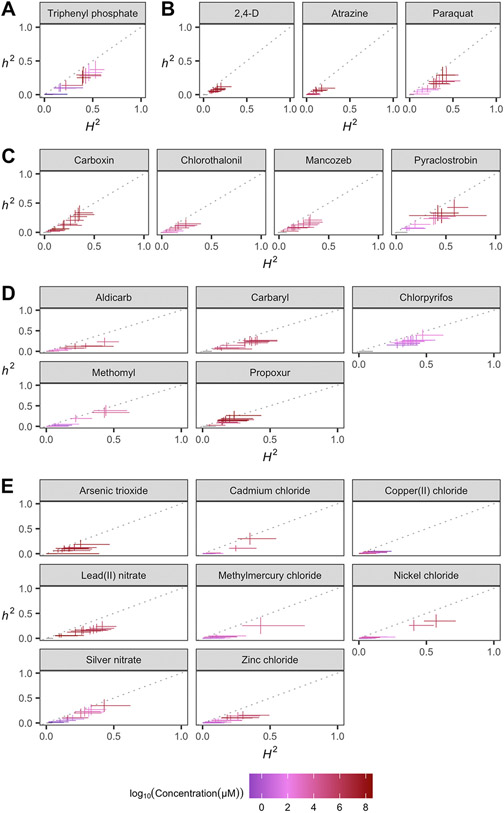
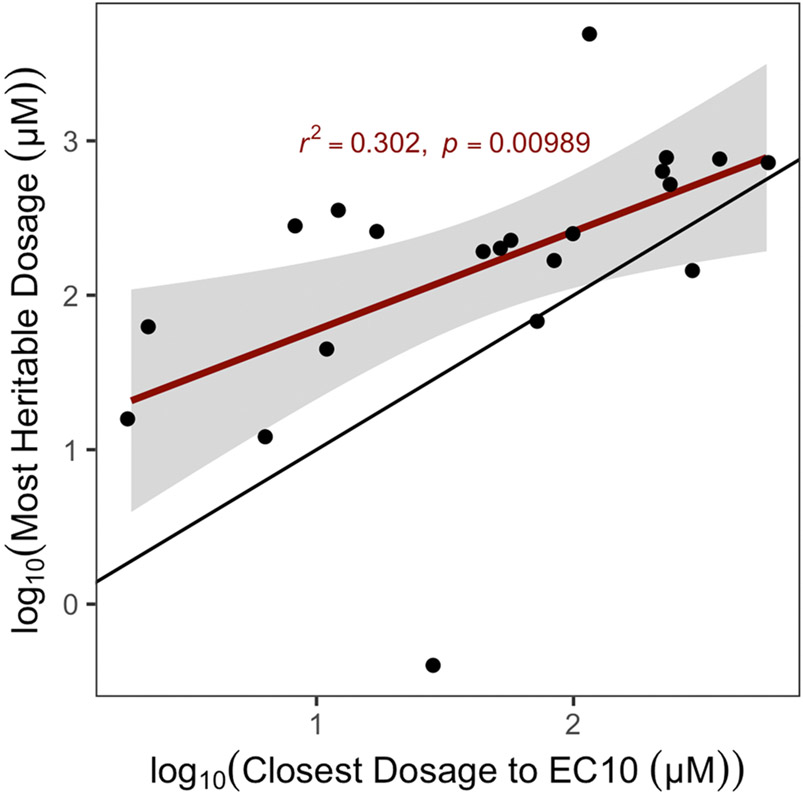
The genetic variability of toxicant responses among indisviduals in humans and mammalian models requires practically untenable sample sizes to create comprehensive chemical hazard risk evaluations. To address this need, tractable model systems enable reproducible and efficient experimental workflows to collect high-replication measurements of exposure cohorts. Caenorhabditis elegans is a premier toxicology model that has revolutionized our understanding of cellular responses to environmental pollutants and boasts robust genomic resources and high levels of genetic variation across the species. In this study, we performed dose-response analysis across 23 environmental toxicants using eight C. elegans strains representative of species-wide genetic diversity. We observed substantial variation in EC10 estimates and slope parameter estimates of dose-response curves of different strains, demonstrating that genetic background is a significant driver of differential toxicant susceptibility. We also showed that, across all toxicants, at least one C. elegans strain exhibited a significantly different EC10 or slope estimate compared to the reference strain, N2 (PD1074), indicating that population-wide differences among strains are necessary to understand responses to toxicants. Moreover, we quantified the heritability of responses (phenotypic variance attributable to genetic differences between individuals) to each toxicant exposure and observed a correlation between the exposure closest to the species-agnostic EC10 estimate and the exposure that exhibited the most heritable response. At least 20% of the variance in susceptibility to at least one exposure level of each compound was explained by genetic differences among the eight C. elegans strains. Taken together, these results provide robust evidence that heritable genetic variation explains differential susceptibility across an array of environmental pollutants and that genetically diverse C. elegans strains should be deployed to aid high-throughput toxicological screening efforts.

Keywords: C. elegans; Dose-response; Genetics; High-throughput assay; Natural variation.


Conflict of interest statement

Declaration of Competing Interest The authors declare that they have no known competing financial interests or personal relationships that could have appeared to influence the work reported in this paper.

Figures

Fig. 1.
Fig. 1.. High-throughput microscopy assay enables rapid analysis of C. elegans toxicant responses.
Detailed descriptions of A) through D) can be found in Methods; High-throughput toxicant dose-response assay. Detailed descriptions of E) can be found in Methods; Data collection, Data cleaning, LOAEL inference, Dose-response model estimation. Created with BioRender.com.
Fig. 2.
Fig. 2.. Toxicant responses vary among genetically diverse C. elegans strains.
Normalized length measurements for each strain at each toxicant exposure are shown on the y-axis, and the concentration of each toxicant is shown on the x-axis. Each dose-response curve is colored according to the strain. Does-response curves for each toxicant can be found in Supplemental Fig. 5.We observed a wide range of responses that can be combined into four general groups: A) subtle responses with little variation among strains, e.g., 2,4-D; B) subtle responses with moderate variation among strains, e.g., carbaryl; C) strong responses with little variation among strains, e.g., nickel chloride (though for nickel chloride, strain variation is high at high exposure levels, see Fig. 5); and D) strong responses with moderate variation among strains, e.g., pyraclostrobin.
Fig. 3.
Fig. 3.. Variation in EC10 estimates can be explained by genetic differences among strains.
A) Strain-specific EC10 estimates for each toxicant are displayed for each strain. Standard errors for each strain- and toxicant-specific EC10 estimate are indicated by the line extending from each point. B) For each toxicant, each strain’s relative resistance to that toxicant compared to the N2 strain is shown. Relative resistance above 1, for example, denotes an EC10 value 100% higher than the N2 strain. Solid points denote strains with significantly different relative resistance to that toxicant (F-test and subsequent Bonferroni correction with a padj < 0.05, see Methods; Dose-response model estimation), and faded points denote strains not significantly different than the N2 strain. The broad category to which each toxicant belongs is denoted by the strip label for each facet.
Fig. 4.
Fig. 4.. Variation in dose-response slope estimates can be explained by genetic differences among strains.
A) Strain-specific slope estimates for each toxicant are displayed for each strain. Standard errors for each strain- and toxicant-specific slope estimate are indicated by the line extending from each point. B) For each toxicant, the relative steepness of the dose-response slope inferred for that strain compared to the N2 strain is shown. Solid points denote strains with significantly different dose-response slopes (Student’s t-test and subsequent Bonferroni correction with a padj < 0.05, see Methods; Dose-response model estimation), and faded points denote strains without significantly different slopes than the N2 strain. The broad category to which each toxicant belongs is denoted by the strip label for each facet.
Fig. 5.
Fig. 5.. Variation in toxicant responses is heritable among genetically diverse C. elegans strains.
The broad-sense (x-axis) and narrow-sense heritability (y-axis) of normalized animal length measurements was calculated for each concentration of each toxicant (Methods; Broad-sense and narrow-sense hentability calculations). The color of each cross corresponds to the log-transformed exposure for which those calculations were performed. The horizontal line of the cross corresponds to the confidence interval of the broad-sense heritability estimate obtained by bootstrapping, and the vertical line of the cross corresponds to the standard error of the narrow-sense heritability estimate.
Fig. 6.
Fig. 6.. EC10 estimates from genetically diverse individuals predict exposures eliciting heritable responses.
The log-transformed exposure that elicited the most heritable response to each toxicant (y-axis) is plotted against the log-transformed exposure of that same toxicant nearest to the inferred EC10 from the dose-response assessment. The exposure closest to the EC10 across all toxicants exhibited significant explanatory power to determine the exposure that elicited heritable phenotypic variation.

References

    1. Abdo N, Xia M, Brown CC, Kosyk O, Huang R, Sakamuru S, Zhou Y-H, Jack JR, Gallins P, Xia K, Li Y, Chiu WA, Motsinger-Reif AA, Austin CP, Tice RR, Rusyn I, Wright FA, 2015. Population-based in vitro hazard and concentration-response assessment of chemicals: the 1000 genomes high-throughput screening study. Environ. Health Perspect 123, 458–466. - PMC - PubMed
    1. Andersen EC, Bloom JS, Gerke JP, Kruglyak L, 2014. A variant in the neuropeptide receptor npr-1 is a major determinant of Caenorhabditis elegans growth and physiology. PLoS Genet. 10, e1004156. - PMC - PubMed
    1. Andersen EC, Gerke JP, Shapiro JA, Crissman JR, Ghosh R, Bloom JS, Félix M-A, Kruglyak L, 2012. Chromosome-scale selective sweeps shape Caenorhabditis elegans genomic diversity. Nat. Genet 44, 285–290. - PMC - PubMed
    1. Andersen EC, Shimko TC, Crissman JR, Ghosh R, Bloom JS, Seidel HS, Gerke JP, Kruglyak L, 2015. A Powerful New Quantitative Genetics Platform, Combining Caenorhabditis elegans High-Throughput Fitness Assays with a Large Collection of Recombinant Strains. G3 5, 911–920. - PMC - PubMed
    1. Bernstein MR, Zdraljevic S, Andersen EC, 2019. Tightly linked antagonistic-effect loci underlie polygenic phenotypic variation in C. elegans. Evolution. - PMC - PubMed

Publication types

Substances