. 2022 Oct 28:547:215885.
doi: 10.1016/j.canlet.2022.215885. Epub 2022 Aug 20.

BAP1 maintains HIF-dependent interferon beta induction to suppress tumor growth in clear cell renal cell carcinoma

Affiliations

BAP1 maintains HIF-dependent interferon beta induction to suppress tumor growth in clear cell renal cell carcinoma

Lauren E Langbein et al. Cancer Lett. .

Abstract

BRCA1-associated protein 1 (BAP1) is a deubiquitinase that is mutated in 10-15% of clear cell renal cell carcinomas (ccRCC). Despite the association between BAP1 loss and poor clinical outcome, the critical tumor suppressor function(s) of BAP1 in ccRCC remains unclear. Previously, we found that hypoxia-inducible factor 2α (HIF2α) and BAP1 activate interferon-stimulated gene factor 3 (ISGF3), a transcription factor activated by type I interferons and a tumor suppressor in ccRCC xenograft models. Here, we aimed to determine the mechanism(s) through which HIF and BAP1 regulate ISGF3. We found that in ccRCC cells, loss of the von Hippel-Lindau tumor suppressor (VHL) activated interferon beta (IFN-β) expression in a HIF2α-dependent manner. IFN-β was required for ISGF3 activation and suppressed the growth of Ren-02 tumors in xenografts. BAP1 enhanced the expression of IFN-β and stimulator of interferon genes (STING), both of which activate ISGF3. Both ISGF3 overexpression and STING agonist treatment increased ISGF3 activity and suppressed BAP1-deficient tumor growth in Ren-02 xenografts. Our results indicate that BAP1 loss reduces type I interferon signaling, and reactivating this pathway may be a novel therapeutic strategy for treating ccRCC.

Keywords: BAP1; HIF; Interferon; STING; ccRCC.


Conflict of interest statement

Declaration of competing interest The authors declare no competing interests.

Figures

Figure 1.
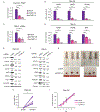
Figure 1.. VHL and HIF2α regulate IFN-β expression in ccRCC cells.
(A) SDS-solubilized whole cell lysates of Ren-02 cells (n=2) expressing an empty vector (EV) or VHL construct and blotted with the indicated antibodies. (B) SDS-solubilized whole cell lysates of 786-O cells (n=3) expressing an empty vector (EV) or VHL construct and blotted with the indicated antibodies. (C) RT-qPCR measurement of IFNB1 (n=3) and IFNA (n=4) gene expression in Ren-02 cells expressing an empty vector (EV) or VHL construct. As IFN-α is transcribed from 13 distinct genes, the IFNA qPCR primers were designed to detect a region common to all IFN-α transcripts. (D) RT-qPCR measurement of IFNB1 (n=5) and IFNA (n=6) gene expression in 786-O cells expressing an empty vector (EV) or VHL construct. (G) SDS-solubilized whole cell lysates of Ren-02 cells (n=2) expressing control (SCR, scrambled) or HIF2α shRNAs and blotted with the indicated antibodies. (H) RT-qPCR measurement of EPAS1 (HIF2α) transcripts in Ren-02 cells (n=5) expressing the indicated shRNAs. (I) SDS-solubilized whole cell lysates of 786-O cells (n=2) expressing control or HIF2α shRNAs and blotted with the indicated antibodies. (J) RT-qPCR measurement of EPAS1 (HIF2α) transcripts in 786-O cells (n=3) expressing the indicated shRNAs.
Figure 2.
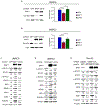
Figure 2.. IFN-β activates ISGF3 and suppresses tumor growth in ccRCC.
(A) RT-qPCR measurement of IFNB1 expression in Ren-02 cells (n=5) expressing SCR or IFNB1 shRNAs. (B) RT-qPCR measurement of ISGF3 target gene expression in Ren-02 cells (n=5, 4, 4) expressing SCR or IFNB1 shRNAs. (C) RT-qPCR measurement of IFNB1 expression in 786-O cells (n=4) expressing SCR or IFNB1 shRNAs. (D) RT-qPCR measurement of ISGF3 target gene expression in 786-O cells (n=5, 5, 3) expressing SCR or IFNB1 shRNAs. (E) SDS-solubilized whole cell lysates of Ren-02 cells (n=2) expressing the indicated shRNAs and blotted with the indicated antibodies. (F) SDS-solubilized whole cell lysates of 786-O cells (n=3) expressing the indicated shRNAs and blotted with the indicated antibodies. (G) Images of athymic nude mice (n=6) injected with Ren-02 cells expressing control (SCR) or IFNB1 shRNA, with xenografted tumors below. (H) Quantification of tumor weights. Tumors from individual mice are connected by a line. The difference in tumor weights was calculated and compared using the two-tailed student’s t-test. (I) Graph of relative cell proliferation in the indicated cell lines measured via XTT assay (n=3).
Figure 3.
Figure 3.. BAP1 promotes ISGF3 activity in a deubiquitinase-dependent manner.
(A) SDS-solubilized whole cell lysates of UMRC6 cells expressing control (GFP), BAP1-WT, or BAP1-C91G constructs and blotted with the indicated antibodies (left). Quantification of monoubiquitinated H2A/total H2A protein levels (n=6) in UMRC6 cells expressing the indicated constructs (right). (B) SDS-solubilized whole cell lysates of UMRC2 cells expressing control (GFP), BAP1-WT, or BAP1-C91G constructs and blotted with the indicated antibodies (left). Quantification of monoubiquitinated H2A/total H2A protein levels (n=6) in UMRC2 cells expressing the indicated constructs (right). (C) SDS-solubilized whole cell lysates of UMRC6 cells (n=7) expressing the indicated constructs and blotted with the indicated antibodies. (D) SDS-solubilized whole cell lysates of UMRC2 cells (n=7) expressing the indicated constructs and blotted with the indicated antibodies. (E) SDS-solubilized whole cell lysates of Ren-02 cells (n=3) expressing the indicated constructs and blotted with the indicated antibodies.
Figure 4.
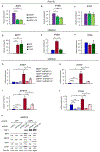
Figure 4.. BAP1 enhances ISGF3 activity through IFN-β.
(A-C) RT-qPCR measurement of the indicated transcripts in Ren-02 cells (n=6) expressing SCR or BAP1 shRNAs. (D-F) RT-qPCR measurement of the indicated transcripts in UMRC6 cells (n=3) expressing control (GFP), BAP1-WT, or BAP1-C91G constructs. (G-J) RT-qPCR measurement of the indicated transcripts in UMRC6 cells (n=6) expressing control (GFP) or BAP1 constructs and control (SCR) or IFNB1 shRNAs. †; p=0.12. (K) SDS-solubilized whole cell lysates of UMRC6 cells (n=3) expressing GFP or BAP1 constructs and SCR or IFNB1 shRNAs and blotted with the indicated antibodies.
Figure 5.
Figure 5.. BAP1 stimulates ISGF3 activity through STING.
(A) SDS-solubilized whole cell lysates of UMRC6 cells (n=3) expressing control (GFP), BAP1-WT, or BAP1-C91G constructs and blotted with the indicated antibodies. (B) Cytoplasmic and nuclear protein fractions extracted from UMRC6 cells (n=3) expressing GFP, BAP1-WT, or BAP1-C91G constructs and blotted with the indicated antibodies. (C) SDS-solubilized whole cell lysates of Ren-02 cells (n=3) expressing control (SCR) or BAP1 shRNAs and blotted with the indicated antibodies. (D) RT-qPCR measurement of STING1 transcripts in UMRC6 cells (n=6) expressing control (GFP), BAP1-WT, or BAP1-C91G constructs. (E) RT-qPCR measurement of STING1 transcripts in UMRC2 cells (n=4) expressing control (GFP), BAP1-WT, or BAP1-C91G constructs. (F) RT-qPCR measurement of STING1 transcripts in Ren-02 cells (n=8) expressing control (SCR) or BAP1 shRNAs. (G) EBC-solubilized lysates of primary kidney cells from WT or Bap1fl/fl mice (n=3) treated with adenovirus-CMV or -Cre and blotted with the indicated antibodies. (H) Odds ratio (OR) for association between BAP1 IHC loss and STING IHC loss in the stroma and cancer cells. Analysis was performed for all samples and for samples within each tumor stage and grade. Images below are STING and BAP1 IHC samples assigned the indicated staining intensity scores. (I) SDS-solubilized whole cell lysates of UMRC6 cells (n=5) expressing GFP, BAP1-WT, or BAP1-C91G treated with H-151 for 24 h and blotted with the indicated antibodies. +, 1 μM; ++, 5 μM.
Figure 6.
Figure 6.. BAP1 suppression of tumorigenesis was verified in a ccRCC xenograft model.
(A) Images of athymic nude mice (n=12) injected with Ren-02 cells expressing control (SCR) or BAP1 shRNA, with xenografted tumors below. (B) Quantification of tumor weights. Tumors from individual mice are connected by a line. The difference in tumor weights was calculated and compared using the two-tailed student’s t-test. (C) EBC lysates were harvested from paired tumors in two mice and blotted with the indicated antibodies. (D) H&E and IHC staining of tumor tissue from a representative mouse. (E) Graph of cell proliferation in the indicated Ren-02 cell lines measured via XTT assay (n=3). (F) Images of athymic nude mice (n=10) injected with Ren-02 cells expressing BAR1 shRNA and control (GFP) or BAP1* (shRNA-resistant BAP1), with xenografted tumors below. (G) Quantification of tumor weights. Tumors from individual mice are connected by a line. The difference in tumor weights was calculated and compared using the two-tailed student’s t-test. (H) EBC lysates were harvested from paired tumors in two mice and blotted with the indicated antibodies. (I) H&E and IHC staining of tumor tissue from a representative mouse. (J) Graph of cell proliferation of the indicated Ren-02 cell lines measured via XTT assay (n=3).
Figure 7.
Figure 7.. Genetic activation of ISGF3 blocks tumor growth by BAP1-deficient cancer cells.
(A) SDS-solubilized whole cell lysates of Ren-02 cells (n=4) expressing SCR or BAP1 shRNA and GFP or IRF9-STAT2C (9–2C) constructs and blotted with the indicated antibodies. For the IRF9 immunoblot, the first row of quantification represents the IRF9-STAT2C fusion protein, while the second row represents endogenous IRF9. (B) Images of athymic nude mice (n=9) injected with Ren-02 cells expressing BAP1 shRNA and GFP or IRF9-STAT2C, with xenografted tumors below. (C) Quantification of tumor weights. Tumors from individual mice are connected by a line. The difference in tumor weights was calculated and compared using the two-tailed student’s t-test. (D) Graph of cell proliferation in the indicated Ren-02 cell lines measured via XTT assay (n=3).
Figure 8.
Figure 8.. A STING agonist increases ISGF3 activity and slows the growth of BAP1-deficient tumors.
(A) SDS-solubilized whole cell lysates of Ren-02 cells (n=2) expressing SCR or BAP1 shRNAs treated 24 h with 100 pg/ml IFN-β or diABZI (+, 1 μM; ++, 5 μM) and blotted with the indicated antibodies. (B) SDS-solubilized whole cell lysates of UMRC6 cells (n=3) expressing GFP or BAP1, treated 24 h with 1 μM diABZI, and blotted with the indicated antibodies. (C) Images of representative athymic nude mice (n=8 per treatment group) bearing Ren-02 shBAP1 tumors and treated twice-weekly with vehicle (control) or 3 mg/kg diABZI via intraperitoneal route (left). Graph of individual Ren-02 shBAP1 tumor volumes relative to size at onset of treatment (right). (D) Relative tumor volume of all mice in each treatment group (n=8) measured twice weekly. (E) EBC lysates were harvested from tumors in four mice and blotted with the indicated antibodies. (F) H&E and IHC staining of tumor tissue from representative mice.

References

    1. Siegel RL, Miller KD, Fuchs HE, Jemal A. Cancer Statistics, 2021. CA: A Cancer Journal for Clinicians. 2021;71(1):7–33. - PubMed
    1. Zibelman M, Plimack ER. Integrating Immunotherapy Into the Management of Renal Cell Carcinoma. J Natl Compr Canc Netw. 2017;15(6):841–7. - PMC - PubMed
    1. Kaelin WG. HIF2 Inhibitor Joins the Kidney Cancer Armamentarium. J Clin Oncol. 2018;36(9):908–10. - PubMed
    1. Choueiri TK, Kaelin WG. Targeting the HIF2-VEGF axis in renal cell carcinoma. Nature Medicine. 2020;26(10):1519–30. - PubMed
    1. Choueiri TK, Motzer RJ. Systemic Therapy for Metastatic Renal-Cell Carcinoma. New England Journal of Medicine. 2017;376(4):354–66. - PubMed

Publication types

MeSH terms

Substances