. 2022 Aug 22;13(1):4922.
doi: 10.1038/s41467-022-32263-7.

Immunogenicity to COVID-19 mRNA vaccine third dose in people living with HIV

Collaborators, Affiliations

Immunogenicity to COVID-19 mRNA vaccine third dose in people living with HIV

Alessandra Vergori et al. Nat Commun. .

Abstract

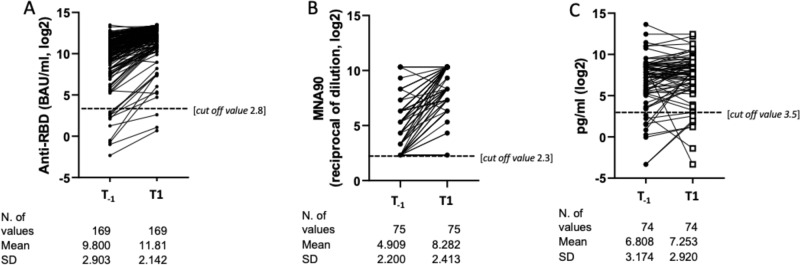
In order to investigate safety and immunogenicity of SARS-CoV-2 vaccine third dose in people living with HIV (PLWH), we analyze anti-RBD, microneutralization assay and IFN-γ production in 216 PLWH on ART with advanced disease (CD4 count <200 cell/mm3 and/or previous AIDS) receiving the third dose of a mRNA vaccine (BNT162b2 or mRNA-1273) after a median of 142 days from the second dose. Median age is 54 years, median CD4 nadir 45 cell/mm3 (20-122), 93% HIV-RNA < 50 c/mL. In 68% of PLWH at least one side-effect, generally mild, is recorded. Humoral response after the third dose was strong and higher than that achieved with the second dose (>2 log2 difference), especially when a heterologous combination with mRNA-1273 as third shot is used. In contrast, cell-mediated immunity remain stable. Our data support usefulness of third dose in PLWH currently receiving suppressive ART who presented with severe immune dysregulation.


Conflict of interest statement

The authors declare no competing interests.

Figures

Fig. 1
Fig. 1. Comparison of the mean log2 of anti-RBD IgG, MNA90 and IFN-γ from 1 month response after the 2nd dose (T−1) and after the 3rd dose (T1).
AC Mean log2 change of anti-RBD IgG (A),MNA90 (B) and IFN-γ (C) from 1 month response after the 2nd dose (T1) and after the 3rd dose (T1) [Paired t-test, 2-sided no adjustment for multiple comparisons]. Mean Log2 changes of anti-RBD IgG (A) and MNA90 (B) significantly increased from T-1 to T1 (p < 0.0001; p < 0.0001; respectively but IFN-γ (C, p = 0.39) Source data are provided as a Source Data file.
Fig. 2
Fig. 2. Overall Log2 change of anti RBD Ig, MNA90 and IFN-γ from T0 to T1; [Paired t-test, 2-sided no adjustment for multiple comparisons].
A Mean Log2 values of anti-RBD IgG. B MNA90. C IFN-γ significantly increased from T0 to T1 (p < 0.0001, p < 0.0001 and p = 0.003, respectively). Source data are provided as a Source Data file.
Fig. 3
Fig. 3. Changes of anti-RBD IgG, MNA90 and IFN-γ from T0 to T1 in HCWs and PLWH.
Log2 change of anti-RBD IgG (A), MNA90 (B) and IFN-γ (C) from T0 to T1 in HCWs and PLWH; There was evidence for a significant increase of anti-RBD IgG, nAbs and IFN-γ from T0 to T1 (p < 0.0001, p < 0.0001 and p = 0.0015, respectively); (p-values are Bonferroni-corrected values). Green circles represent mean values of anti-RBD IgG, MNA900, and IFN-γ in HCWs, red circles represent mean values of anti RBD IgG, MNA90, and IFN-γ in PLWH. Source data are provided as a Source Data file.
Fig. 4
Fig. 4. Changes of anti-RBD IgG, MNA90 and IFN-γ from T0 to T1 in PLWH according to immunodeficiency status.
AC Log2 change of anti-RBD IgG from T0 to T1 according to immunodeficiency status: PCDR (A), ICDR (B), HCDR (C). DF Log2 increase of nAbs (MNA90) from T0 to T1 according to immunodeficiency status: PCDR (D), ICDR (E), HCDR (F). GI Log2 increase of IFN-γ from T0 to T1 according to immunodeficiency status: PCDR (G), ICDR (H), HCDR (I) (ANOVA, 2-sided with Bonferroni adjusted p-values for multiple comparisons). Red dots represent mean values of anti RBD IgG, MNA90 and IFN-γ before the third dose, red squares represent mean values of anti RBD IgG, MNA90 and IFN-γ weeks after the third dose in PCDR; green dots represent mean values of anti RBD IgG, MNA90 and IFN-γ before the third dose, green squares represent mean values of anti RBD IgG, MNA90 and IFN-γ 2 weeks after the third dose in ICDR; Blue dots represent mean values of anti RBD IgG, MNA90 and IFN-γ before the third dose, blue squares represent mean values of anti RBD, MNA90 and IFN-γ 2 weeks after the third dose IN HCDR. Source data are provided as a Source Data file.
Fig. 5
Fig. 5. Overall self-reported solicited local and systemic reactions in days 0–7 after vaccination with third dose by CD4 count.
PCDR Low CD4 count recovery, ICDR Intermediate CD4 count recovery, HCDR High CD4 count recovery. Source data are provided as a Source Data file.

References

    1. WHO Coronavirus (COVID19) Dashboard. Available at: https://covid19.who.int.
    1. Koff WC, et al. Development and deployment of COVID-19 vaccines for those most vulnerable. Sci. Transl. Med. 2021;13:eabd1525. doi: 10.1126/scitranslmed.abd1525. - DOI - PubMed
    1. Lopez Bernal J, et al. Effectiveness of Covid-19 Vaccines against the B.1.617.2 (Delta) Variant. N. Engl. J. Med. 2021;385:585–594. doi: 10.1056/NEJMoa2108891. - DOI - PMC - PubMed
    1. Nasreen, S. et al. Effectiveness of COVID-19 vaccines against variants of concern in Ontario, Canada. medRxiv. 06.28.21259420; 10.1101/2021.06.28.21259420. (2021)
    1. Comirnaty and Spikevax: EMA recommendations on extra doses and boosters. Available at: https://www.ema.europa.eu/en/news/comirnaty-spikevax-ema-recommendations....

Publication types