

Unveiling Trail Making Test: visual and manual trajectories indexing multiple executive processes
- PMID: 35995786
- PMCID: PMC9395513
- DOI: 10.1038/s41598-022-16431-9
Unveiling Trail Making Test: visual and manual trajectories indexing multiple executive processes
Abstract
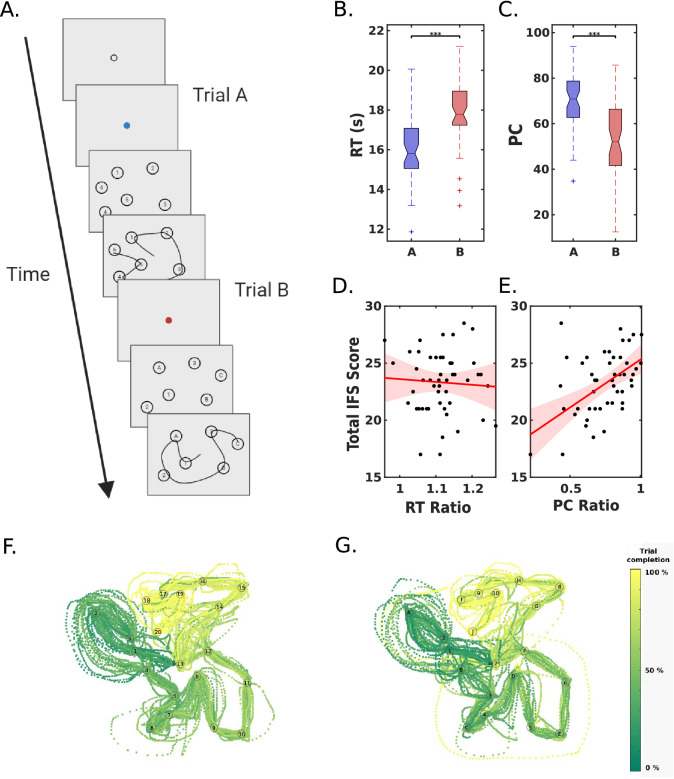
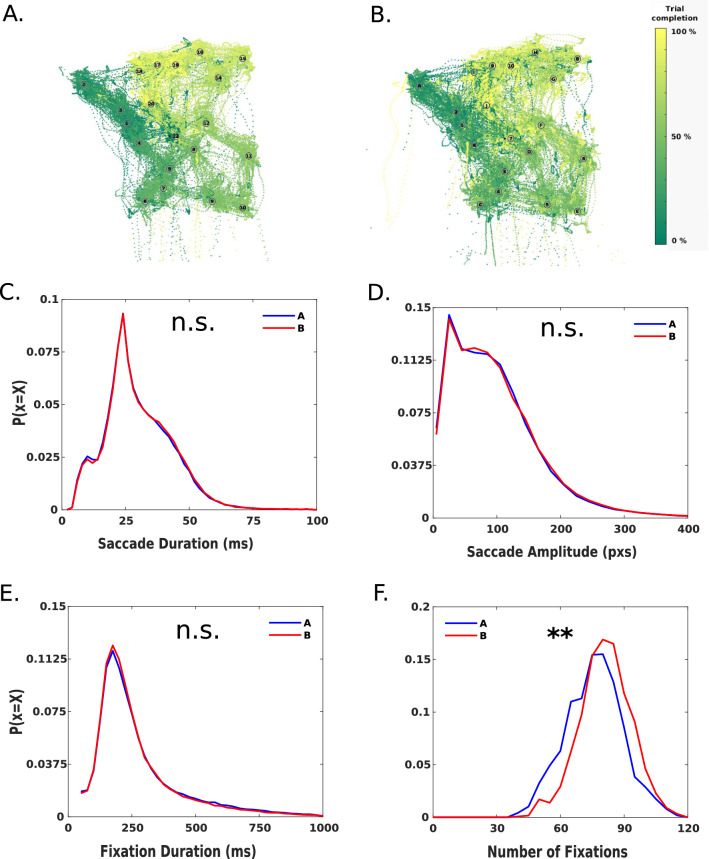
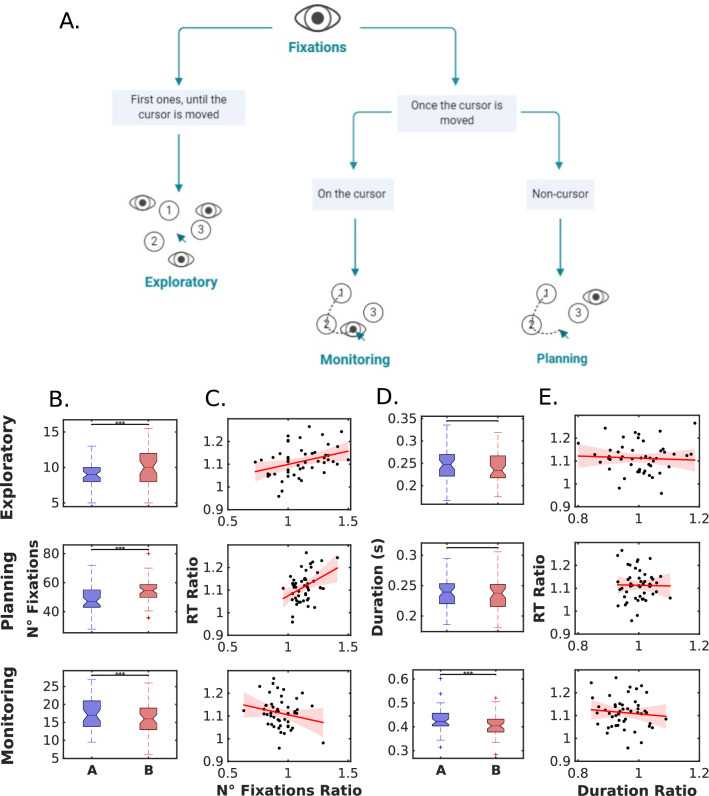
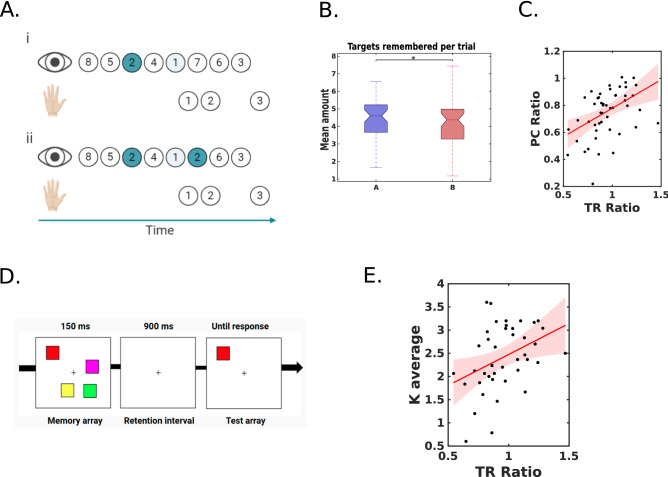
The Trail Making Test (TMT) is one of the most popular neuropsychological tests for executive functions (EFs) assessment. It presents several strengths: it is sensitive to executive dysfunction, it is easy to understand, and has a short administration. However, it has important limitations. First, the underlying EFs articulated during the task are not well discriminated, which makes it a test with low specificity. Second, the pen-and-paper version presents one trial per condition which introduces high variability. Third, only the total time is quantified, which does not allow for a detailed analysis. Fourth, it has a fixed spatial configuration per condition. We designed a computerised version of the TMT to overcome its main limitations and evaluated it in a group of neurotypical adults. Eye and hand positions are measured with high resolution over several trials, and spatial configuration is controlled. Our results showed a very similar performance profile compared to the traditional TMT. Moreover, it revealed differences in eye movements between parts A and B. Most importantly, based on hand and eye movements, we found an internal working memory measure that showed an association to a validated working memory task. Additionally, we proposed another internal measure as a potential marker of inhibitory control. Our results showed that EFs can be studied in more detail using traditional tests combined with powerful digital setups. The cTMT showed potential use in older adult populations and patients with EFs disorders.
© 2022. The Author(s).
Conflict of interest statement
The authors declare no competing interests.
Figures

Similar articles
-
Emphasizing speed or accuracy in an eye-tracking version of the Trail-Making-Test: Towards experimental diagnostics for decomposing executive functions.PLoS One. 2022 Sep 12;17(9):e0274579. doi: 10.1371/journal.pone.0274579. eCollection 2022. PLoS One. 2022. PMID: 36094948 Free PMC article.
-
Multicomponent analysis of a digital Trail Making Test.Clin Neuropsychol. 2017 Jan;31(1):154-167. doi: 10.1080/13854046.2016.1238510. Epub 2016 Oct 3. Clin Neuropsychol. 2017. PMID: 27690752 Free PMC article.
-
Toward Development of a Novel Proprioceptive Trail-Making Test: Comparing Healthy Dancers and Non-Dancers.Percept Mot Skills. 2024 Jun;131(3):660-686. doi: 10.1177/00315125241240891. Epub 2024 Mar 27. Percept Mot Skills. 2024. PMID: 38537176
-
Assessing the Relationship Between Digital Trail Making Test Performance and IT Task Performance: Empirical Study.JMIR Hum Factors. 2024 Jun 14;11:e49992. doi: 10.2196/49992. JMIR Hum Factors. 2024. PMID: 38875007 Free PMC article.
-
The Trail Making Test (part B) is associated with working memory: A concurrent validity study.Appl Neuropsychol Adult. 2025 Mar-Apr;32(2):375-383. doi: 10.1080/23279095.2023.2171793. Epub 2023 Jan 27. Appl Neuropsychol Adult. 2025. PMID: 36706083
Cited by
-
Web-based assessment of dual-task costs at different ages: an analysis across cognitive domains.Front Psychol. 2025 May 14;16:1561417. doi: 10.3389/fpsyg.2025.1561417. eCollection 2025. Front Psychol. 2025. PMID: 40438755 Free PMC article.
-
Heart failure decouples the precuneus in interaction with social cognition and executive functions.Sci Rep. 2023 Jan 23;13(1):1236. doi: 10.1038/s41598-023-28338-0. Sci Rep. 2023. PMID: 36690723 Free PMC article.
-
Test-retest reliability of eye tracking measures in a computerized Trail Making Test.J Vis. 2023 Aug 1;23(8):15. doi: 10.1167/jov.23.8.15. J Vis. 2023. PMID: 37594452 Free PMC article.
-
Leisure Activities for Mild Cognitive Impairment: Reconsidering an Intriguing Hypothesis Through a Methodological Lens [Letter].Neuropsychiatr Dis Treat. 2025 Aug 27;21:1795-1798. doi: 10.2147/NDT.S561567. eCollection 2025. Neuropsychiatr Dis Treat. 2025. PMID: 40893927 Free PMC article. No abstract available.
-
Emphasizing speed or accuracy in an eye-tracking version of the Trail-Making-Test: Towards experimental diagnostics for decomposing executive functions.PLoS One. 2022 Sep 12;17(9):e0274579. doi: 10.1371/journal.pone.0274579. eCollection 2022. PLoS One. 2022. PMID: 36094948 Free PMC article.
References
-
- Reitan RM. Validity of the Trail Making Test as an indicator of organic brain damage. Percept. Mot. Skills. 1958 doi: 10.2466/pms.1958.8.3.271. - DOI
Publication types
MeSH terms
Grants and funding
LinkOut - more resources
Full Text Sources
