

Non-linear machine learning models incorporating SNPs and PRS improve polygenic prediction in diverse human populations
- PMID: 35995843
- PMCID: PMC9395509
- DOI: 10.1038/s42003-022-03812-z
Non-linear machine learning models incorporating SNPs and PRS improve polygenic prediction in diverse human populations
Abstract
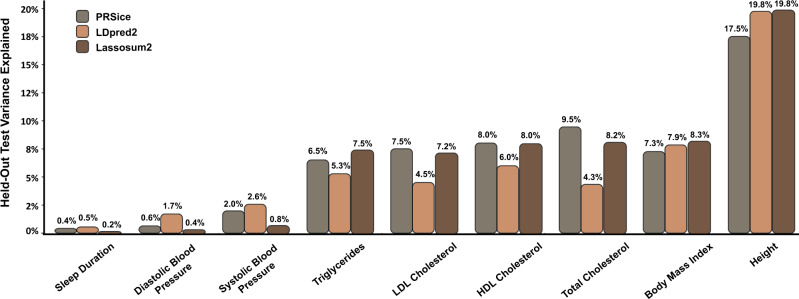
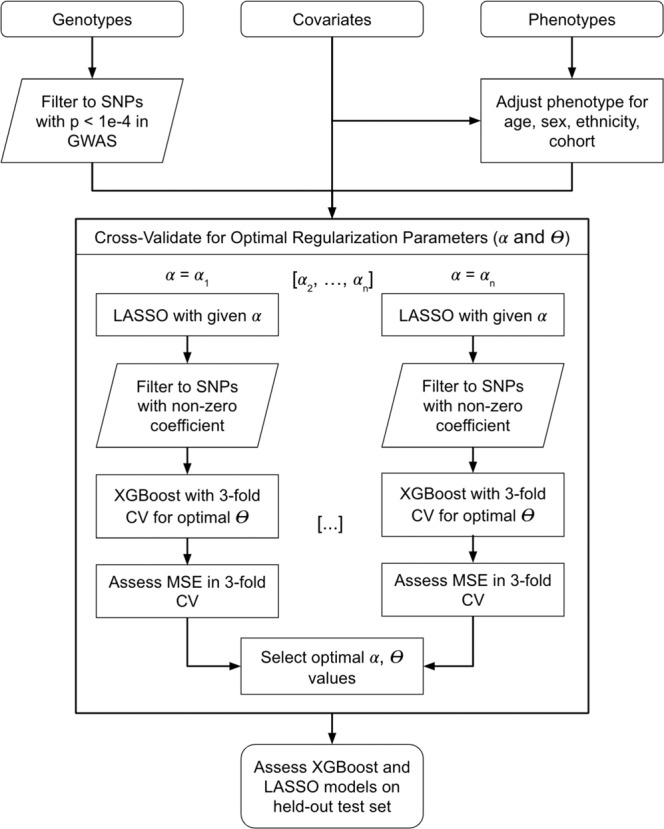
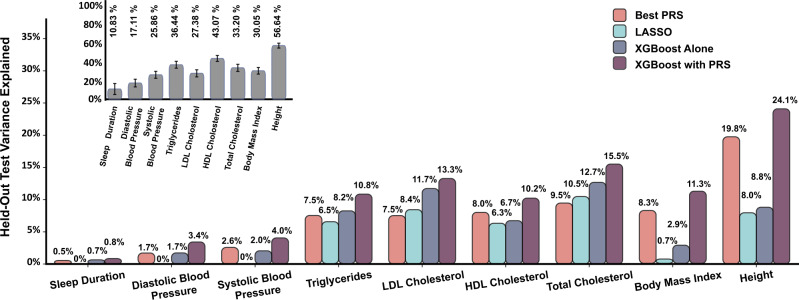
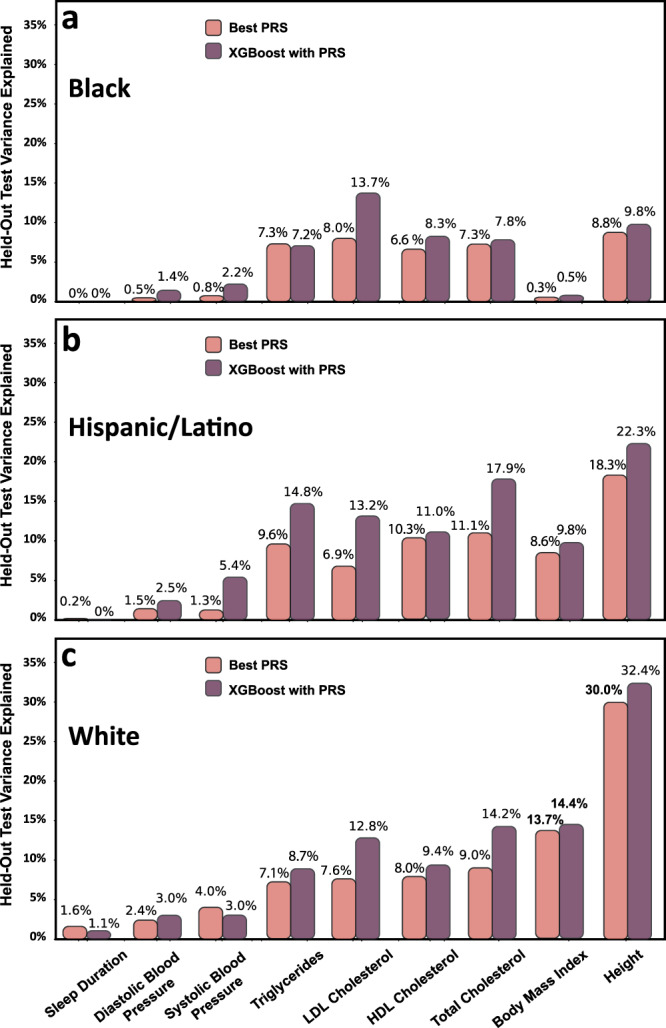
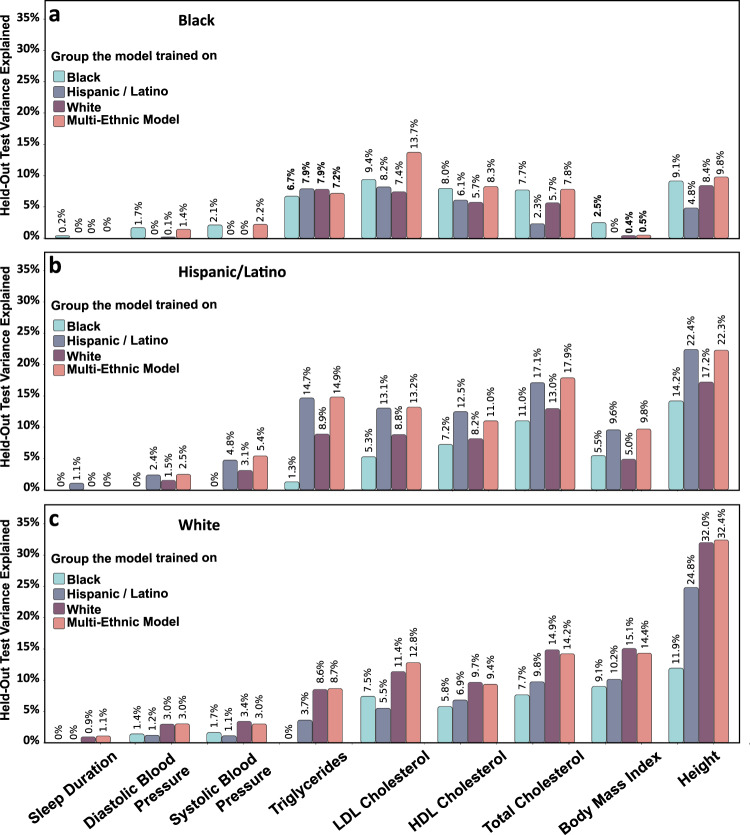
Polygenic risk scores (PRS) are commonly used to quantify the inherited susceptibility for a trait, yet they fail to account for non-linear and interaction effects between single nucleotide polymorphisms (SNPs). We address this via a machine learning approach, validated in nine complex phenotypes in a multi-ancestry population. We use an ensemble method of SNP selection followed by gradient boosted trees (XGBoost) to allow for non-linearities and interaction effects. We compare our results to the standard, linear PRS model developed using PRSice, LDpred2, and lassosum2. Combining a PRS as a feature in an XGBoost model results in a relative increase in the percentage variance explained compared to the standard linear PRS model by 22% for height, 27% for HDL cholesterol, 43% for body mass index, 50% for sleep duration, 58% for systolic blood pressure, 64% for total cholesterol, 66% for triglycerides, 77% for LDL cholesterol, and 100% for diastolic blood pressure. Multi-ancestry trained models perform similarly to specific racial/ethnic group trained models and are consistently superior to the standard linear PRS models. This work demonstrates an effective method to account for non-linearities and interaction effects in genetics-based prediction models.
© 2022. The Author(s).
Conflict of interest statement
The authors declare the following competing interests: B.M.P. serves on the Steering Committee of the Yale Open Data Access Project funded by Johnson & Johnson. G.L. is a full-time employee of Valo Health, a technology company, but this work was not conducted in that position and is not relevant to that position. All other co-authors declare no competing interests.
Figures
References
Publication types
MeSH terms
Grants and funding
- HHSN268201100037C/HL/NHLBI NIH HHS/United States
- R01 HL120393/HL/NHLBI NIH HHS/United States
- U54 HG003067/HG/NHGRI NIH HHS/United States
- U01 HL120393/HL/NHLBI NIH HHS/United States
- R01 HL127564/HL/NHLBI NIH HHS/United States
- U54 HG003273/HG/NHGRI NIH HHS/United States
- R01 HL146860/HL/NHLBI NIH HHS/United States
- HHSN268201800001C/HL/NHLBI NIH HHS/United States
- UM1 HG008898/HG/NHGRI NIH HHS/United States
- R01 HL117626/HL/NHLBI NIH HHS/United States
- U24 HG008956/HG/NHGRI NIH HHS/United States
- HHSN268201600032C/ES/NIEHS NIH HHS/United States
- R21 HL145425/HL/NHLBI NIH HHS/United States
- R01 HL092577/HL/NHLBI NIH HHS/United States
- R01 HL059367/HL/NHLBI NIH HHS/United States
- R01 HL142711/HL/NHLBI NIH HHS/United States
- R35 HL135818/HL/NHLBI NIH HHS/United States
- R01 HL098433/HL/NHLBI NIH HHS/United States
- HHSN268201500015C/HL/NHLBI NIH HHS/United States
- R21 AG070644/AG/NIA NIH HHS/United States
- HHSN268201600033C/ES/NIEHS NIH HHS/United States
- HHSN268201500014C/HL/NHLBI NIH HHS/United States
- KL2 TR002490/TR/NCATS NIH HHS/United States
