. 2023 Jan;30(1):137-151.
doi: 10.1038/s41418-022-01051-7. Epub 2022 Aug 22.

SOCS2-enhanced ubiquitination of SLC7A11 promotes ferroptosis and radiosensitization in hepatocellular carcinoma

Affiliations

SOCS2-enhanced ubiquitination of SLC7A11 promotes ferroptosis and radiosensitization in hepatocellular carcinoma

Qianping Chen et al. Cell Death Differ. 2023 Jan.

Abstract

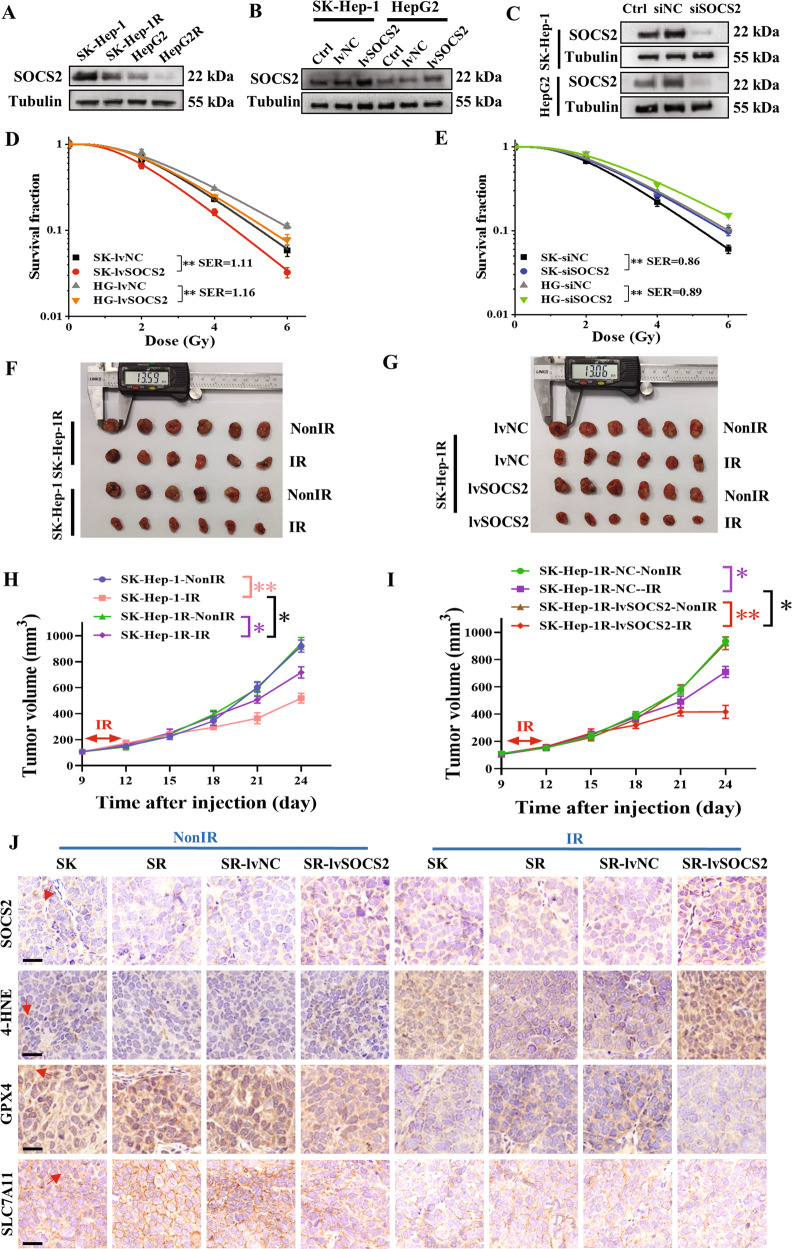
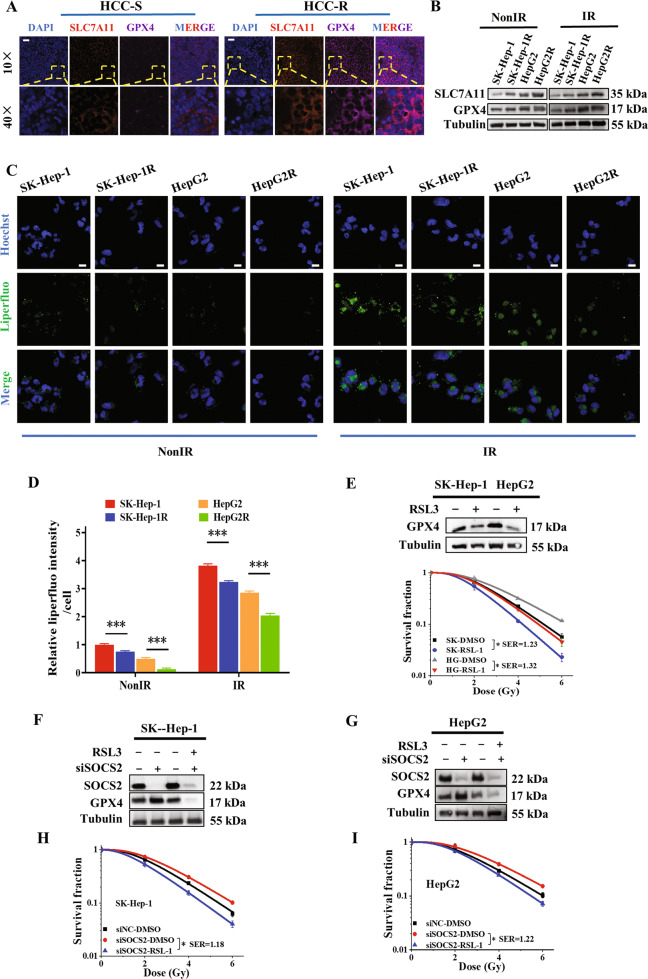
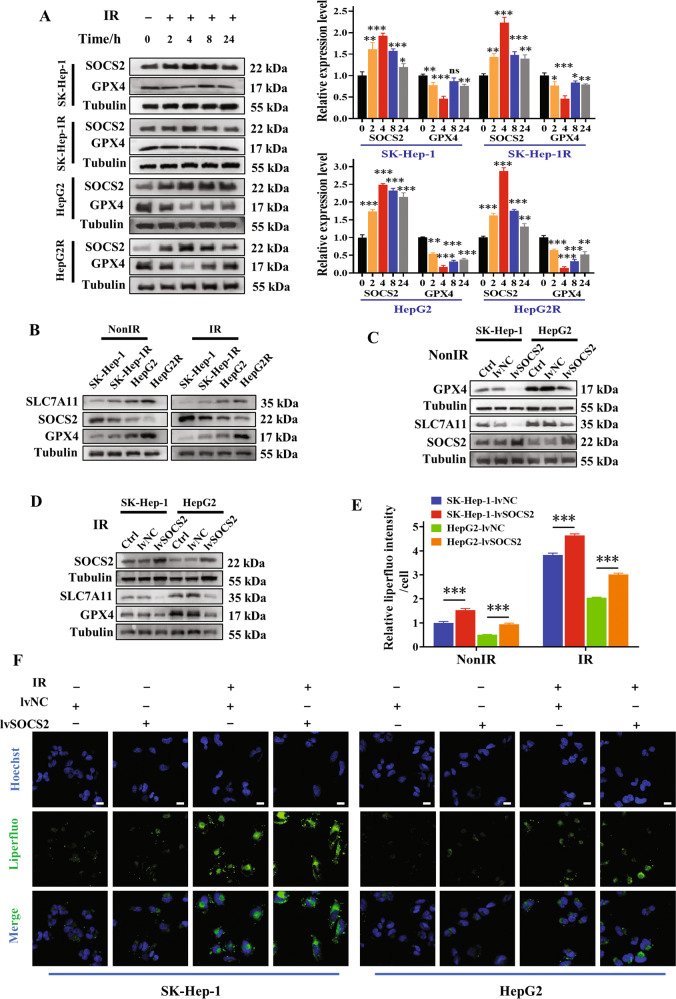
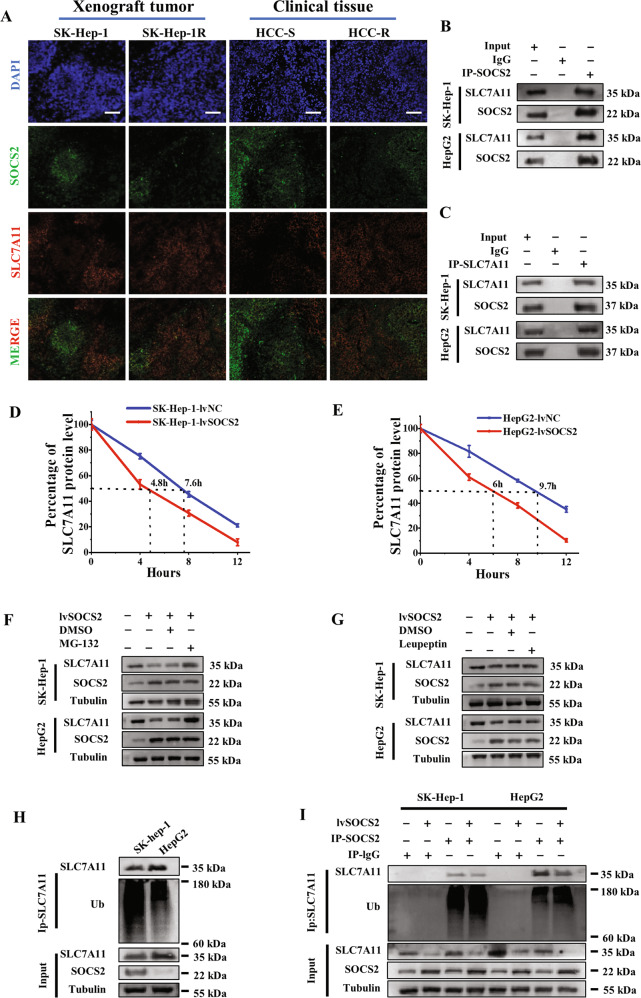
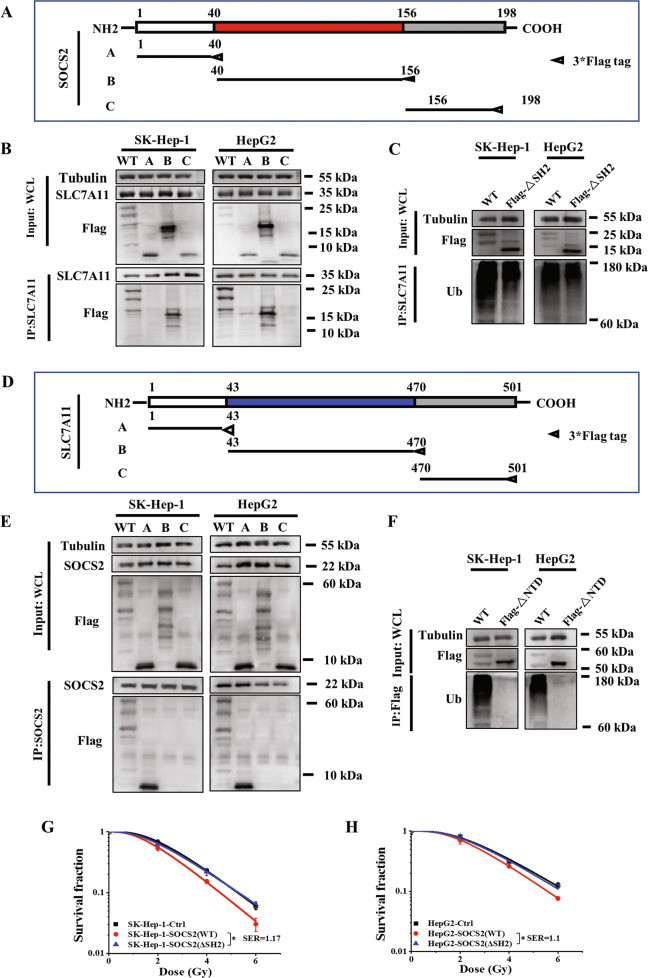
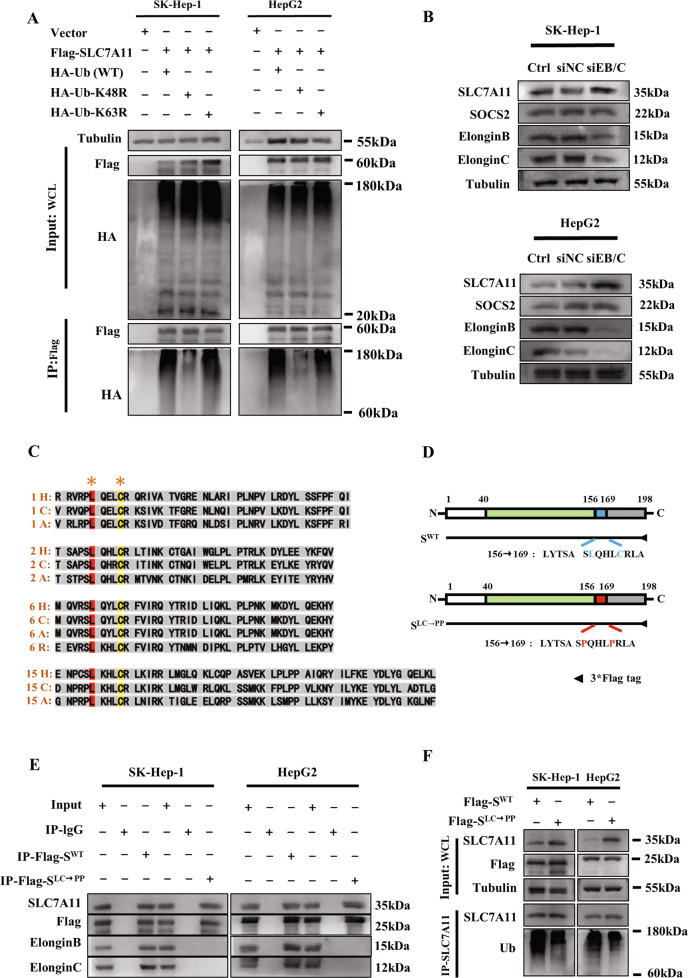
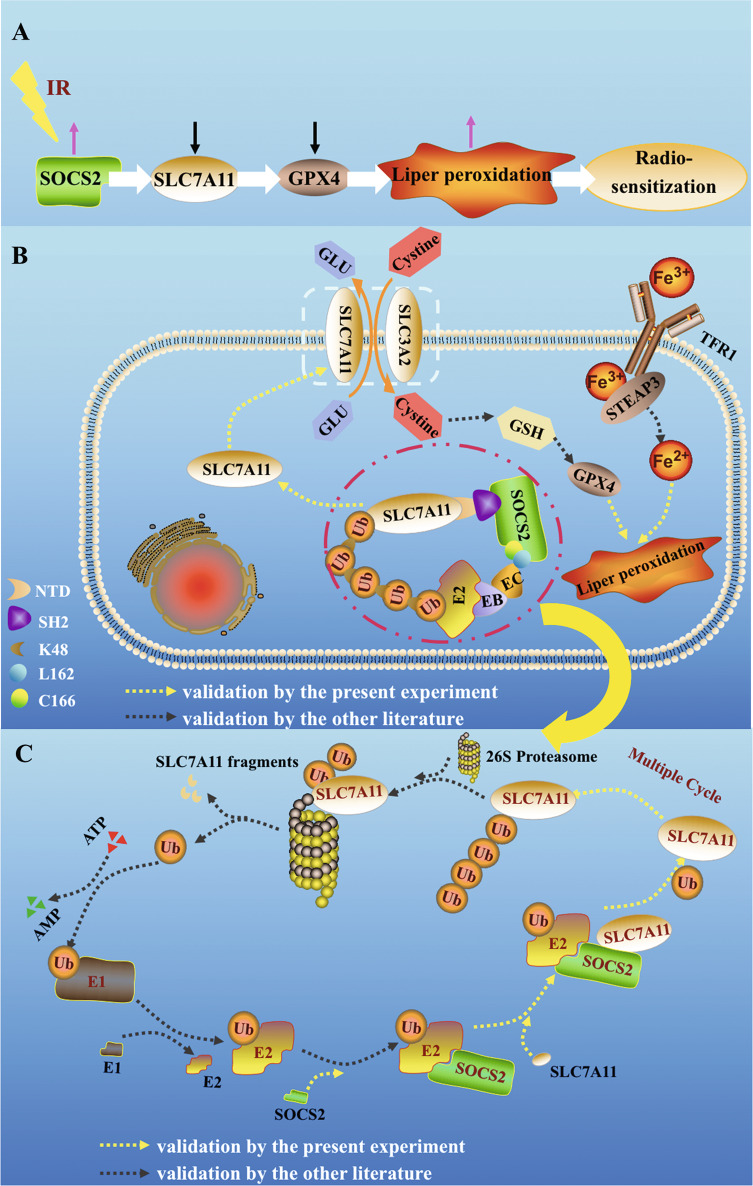
Radioresistance is a principal culprit for the failure of radiotherapy in hepatocellular carcinoma (HCC). Insights on the regulation genes of radioresistance and underlying mechanisms in HCC are awaiting for profound investigation. In this study, the suppressor of cytokine signaling 2 (SOCS2) were screened out by RNA-seq and bioinformatics analyses as a potential prognosis predictor of HCC radiotherapy and then were determined to promote radiosensitivity in HCC both in vivo or in vitro. Meanwhile, the measurements of ferroptosis negative regulatory proteins of solute carrier family 7 member 11 (SLC7A11) and glutathione peroxidase 4 (GPX4), intracellular lipid peroxidation and Fe2+ concentration suggested that a high level of ferroptosis contributed to the radiosensitization of HCC. Moreover, SOCS2 and SLC7A11 were expressed oppositely in HCC clinical tissues and tumour xenografts with different radiosensitivities. Mechanistically, the N-terminal domain of SLC7A11 was specifically recognized by the SH2-structural domain of SOCS2. While the L162 and C166 of SOCS2-BOX region could bind elongin B/C compound to co-form a SOCS2/elongin B/C complex to recruit ubiquitin molecules. Herein, SOCS2 served as a bridge to transfer the attached ubiquitin to SLC7A11 and promoted K48-linked polyubiquitination degradation of SLC7A11, which ultimately led to the onset of ferroptosis and radiosensitization of HCC. In conclusion, it was demonstrated for the first time that high-expressed SOCS2 was one of the biomarkers predicting radiosensitivity of HCC by advancing the ubiquitination degradation of SLC7A11 and promoting ferroptosis, which indicates that targeting SOCS2 may enhance the efficiency of HCC radiotherapy and improve the prognosis of patients.


Conflict of interest statement

The authors declare no competing interests.

Figures

Fig. 1
Fig. 1. Overexpression of SOCS2 was correlated with radiosensitization of hepatocellular carcinoma.
A Dose responses of survival fractions of SK-Hep-1, SK-Hep-1R, HepG2 and HepG2R after IR. B Symmetric scatter diagram of differentially expressed genes (DEGs) between SK-Hep-1R and SK-Hep-1 cells. C Symmetric scatter diagram of DEGs between the HCC tumor and paracancerous tissues from TCGA and GEPIA dataset (download data: 2021-09-01). D Venn diagram of the co-expressed DEGs among above two groups (SK-Hep-1R/SK-Hep-1, tumor/normal tissues) and the survival genes for prognosis prediction of HCC from TCGA and GEPIA dataset. E Fold changes of SOCS2 and SMOX gene expressions in SK-Hep-1R cells and tumor tissues in comparison with SK-Hep-1 cells and normal tissues, respectively. F Kaplan-Meier curves of HCC survivals based on the expression status of SOCS2 gene according to TCGA and GEPIA dataset. G Box scatter diagrams of the relative expression level of SOCS2 in tumor and adjacent normal tissues according to 12 cohorts in HCCDB. The central mark is the median; the edges of the box are the 25th and 75th percentiles. H refers to HCCDB. H Boxplot of the relative expression level of SOCS2 in normal and tumor tissues of HCC patients with four pathological grade 1, 2, 3 or 4 from UALCAN database. The central mark is the median; the edges of the box are the 25th and 75th percentiles. I Representative immunofluorescence images of SOCS2 protein in tumor tissues of radioresistant HCC patients (HCC-R) (n = 12) and radiosensitive HCC patients (HCC-S) (n = 12). Nuclei were stained with DAPI (x4). Scale bars, 100 μm. *P < 0.05, **P < 0.01 and ***P < 0.001 between indicated groups.
Fig. 2
Fig. 2. SOCS2 overexpression sensitized HCC to IR (IR) in vivo and in vitro.
A Western blot assay of SOCS2 and tubulin proteins in SK-Hep-1, SK-Hep-1R, HepG2 and HepG2R cells. B, C Western blot assay of SOCS2 and tubulin proteins in SK-Hep-1 and HepG2 cells transfected with lvSOCS2, siSOCS2 or their negative control (lvNC, siNC). D Dose responses of survival factions of SK-Hep-1 and HepG2 cells with or without lvSOCS2 transfection. SK refers to SK-Hep-1, HG refers to HepG2. E Dose responses of survival factions of SK-Hep-1 and HepG2 cells with or without siSOCS2 transfection. F, G General view of tumor mass of each indicated group at 24 days after cell injection. H, I Tumor volume of above groups was examined every 3 days until 24 days after subcutaneously cell injection. J Representative immunohistochemistry images of the expressions of SOCS2, 4-HNE, GPX4 and SLC7A11 protein in the aforementioned xenograft tumors (x40). The red arrow indicated the spot or region where positive protein expression was present. Scale bars, 20 μm. *P < 0.05, **P < 0.01 and ***P < 0.001 between indicated groups.
Fig. 3
Fig. 3. Enhanced ferroptosis resulted in radiosensitization of HCC.
A Representative fluorescence images of SLC7A11 and GPX4 proteins assessed by immunofluorescence assay in HCC clinical tissues from 12 radioresistant (HCC-R) and 12 radiosensitive (HCC-S) patients. Nuclei were stained with DAPI (×10, ×40). Scale bars, 50 μm. B Western blot assay of SLC7A11, GPX4 and tubulin proteins in SK-Hep-1, SK-Hep-1R, HepG2 and HepG2R cells at 4 h after 4 Gy IR or non-IR. Representative images (C) and quantification (D) of the relative fluorescence intensity of liperfluo (a lipid peroxide fluorescent probe) in SK-Hep-1, SK-Hep-1R, HepG2 and HepG2R cells at 4 h after 4 Gy IR or non-IR. Nuclei were stained with Hoechst (×40). Scale bars, 10 μm. E Dose responses of survival factions of SK-Hep-1 and HepG2 cells treated with RSL3, and the western blot assay of GPX4 and tubulin proteins in these cells. SK refers to SK-Hep-1, HG refers to HepG2. F, G Western blot assay of GPX4 and tubulin proteins in HCC cells treated with RSL3, siSOCS2 or its control siNC. H, I Dose responses of survival factions of SK-Hep-1 and HepG2 cells treated with RSL3, siSOCS2 or its control siNC. *P < 0.05, **P < 0.01 and ***P < 0.001 between indicated groups.
Fig. 4
Fig. 4. SOCS2 facilitated ferroptosis in HCC cells.
A Western blot assay of GPX4 and SOCS2 proteins and their relative levels in SK-Hep-1, SK-Hep-1R, HepG2 and HepG2R cells at 2, 4, 8, 24 h after 4 Gy IR or non-IR. B Western blot assay of SLC7A11, GPX4 and SOCS2 proteins in SK-Hep-1, SK-Hep-1R, HepG2 and HepG2R cells at 4 h after 4 Gy IR or non-IR. C, D Western blot assay of SLC7A11, GPX4 and SOCS2 proteins in SK-Hep-1, SK-Hep-1R, HepG2 and HepG2R cells with or without lvSOCS2 transfection at 4 h after 4 Gy IR or non-IR. Representative images (F) and quantification (E) of the relative fluorescence intensity of liperfluo in SK-Hep-1 and HepG2 cells transfected with lvSOCS2 at 4 h after 4 Gy IR or non-IR. Nuclei were stained with Hoechst (x40). Scale bars, 10 μm. *P < 0.05, **P < 0.01 and ***P < 0.001 between indicated groups.
Fig. 5
Fig. 5. SOCS2 interacted with SLC7A11 and decreased its level by ubiquitin-proteasome pathway.
A Representative immunofluorescence images of SOCS2 and SLC7A11 proteins in the nonirradiated xenograft tumors (SK-Hep-1 and SK-Hep-1R) and HCC clinical tissues. Nuclei are stained with DAPI (×10). Scale bars, 100 μm. B, C Co-immunoprecipitation and Western blot assay of SOCS2 and SLC7A11 proteins in the whole cell lysates of SK-Hep-1 and HepG2 cells at 4 h after 4 Gy IR. D, E Point-fold line chart of SLC7A11 protein degradation according to Western blot assay (Fig. S5E). F, G Western blot analysis of SLC7A11, SOCS2 and tubulin proteins in SK-Hep-1 and HepG2 cells at 4 h after 4 Gy IR. MG-132 (10 μM) or leupeptin (50 μM) were added before IR. H Anti-Ub immunoblotting assay of SLC7A11 polyubiquitination in SK-Hep-1 and Hep2 cells at 4 h after 4 Gy IR. I Anti-Ub immunoblotting assay of SLC7A11 polyubiquitination in SK-Hep-1 and HepG2 cells transfected with lvSOCS2 at 4 h after 4 Gy IR. *P < 0.05, **P < 0.01 and ***P < 0.001 between indicated groups.
Fig. 6
Fig. 6. SOCS2-SH2 domain interacted with N-terminal domain of SLC7A11 to reduce radioresistance.
A Schematic representation of three flag-fused SOCS2 constructs containing amino acids 1–40, 40–156 and 156–198. B Co-immunoprecipitation assay of SLC7A11 and different SOCS2 domains in the whole cell lysates of irradiated SK-Hep-1 and HepG2 cells. C Ubiquitination of SLC7A11 in irradiated SK-Hep-1 and HepG2 cells with or without ΔSH2 manipulation (ΔSH2, SH2 domain truncation mutant of SOCS2). D Schematic representation of three flag-fused SLC7A11 constructs containing amino acids 1–43, 43–470 and 470–501. E Co-immunoprecipitation assay of SOCS2 and different SLC7A11 domains in the whole cell lysates of irradiated SK-Hep-1 and HepG2 cells. F SLC7A11 polyubiquitination was detected by anti-Ub immunoblotting in 4 Gy irradiated SK-Hep-1 and HepG2 cells with or without ΔNTD manipulation (ΔNTD, NTD domain truncation mutant of SOCS2). G, H Dose responses of survival fractions of SK-Hep-1 and HepG2 cells transfected with SOCS2-ΔSH2 or SOCS2-WT plasmid. *P < 0.05, **P < 0.01 and ***P < 0.001 between indicated groups.
Fig. 7
Fig. 7. SOCS2 mediated K48-linked polyubiquitination chains onto SLC7A11 via an elongin B/C ubiquitin-complex.
A Immunoprecipitation and immunoblotting assay were selected to detect the type of polyubiquitination of Flag-SLC7A11 in SK-Hep-1 and HepG2 cells transfected with wild-type or K48/K63 mutant Ub after IR. B Western blot assay of SLC7A11, elongin B and elongin C proteins in 4 Gy irradiated SK-Hep-1 and HepG2 cells transfected with siRNA targeting elongin B or elongin C (siEB/C). C Amino acid sequences of SOCS2-BOX regions of SOCS1 (1), SOCS2 (2), SOCS6 (6) and SAB15 (15) proteins from different species. H refers to Human; C refers to Chicken; A refers to African clawed frog; R refers to Red flour beetle. D Schematic representation of two flag-fused SOCS2 plasmids with wild-type (SWT) or L162C166/P162P166 (SLC→PP) mutant. E Co-immunoprecipitation assay of SWT, SLC→PP, elongin B and elongin C in the whole cell lysates of irradiated SK-Hep-1 and HepG2 cells. F SLC7A11 polyubiquitination was detected by anti-Ub immunoblotting assay in 4 Gy irradiated SK-Hep-1 and HepG2 cells transfected with SWT or SLC→PP plasmid.
Fig. 8
Fig. 8. Incremental SOCS2 promoted ubiquitination degradation of SLC7A11 and induced ferroptosis and radiosensitization of HCC.
A The pathway of SOCS2 sensitization. After IR, a rapid increase of SOCS2 led to a decrease of SLC7A11 and advanced ferroptosis and radiosensitization. B Diagram of the specific mechanism of SOCS2-induced ferroptosis. SOCS2-SH2 recognized SLC7A11-NTD, bound ubiquitin molecules which was linked to E2 ubiquitin-binding enzymes with the joint involvement of elongin B (EB) and elongin C (EC), and facilitated the transfer of ubiquitin molecules to the substrate protein SLC7A11 to promote SLC7A11 degradation. This degradation subsequently caused a reduction in cystine intake as well as a reduction in GSH and GPX4 and ultimately advanced ferroptosis. C The processes of SLC7A11 protein ubiquitination. In an ATP-dependent reaction, Ub was attached to the ubiquitin-activating enzyme E1 and activated, then delivered to the ubiquitin-binding enzyme E2. Next, the E3 ligase SOCS2 acted as a bridge, identifying E2-Ub and the substrate SLC7A11 to facilitate the association of Ub with SLC7A11. After several repetitions of the above process, a K48-ubiquitin chain was formed and attached to SLC7A11. Finally, the K48-ubiquitin chain was identified by the 26 S proteasome, leading to the degradation of SLC7A11 to fragments. Yellow arrows indicate the experimental results argued in this paper while black arrows represent results reported in other literature.

References

    1. Bray F, Ferlay J, Soerjomataram I, Siegel RL, Torre LA, Jemal A. Global cancer statistics 2018: GLOBOCAN estimates of incidence and mortality worldwide for 36 cancers in 185 countries. CA Cancer J Clin. 2018;68:394–424. doi: 10.3322/caac.21492. - DOI - PubMed
    1. Sun JY, Zhu ZR, Li WW, Shen MY, Cao CH, Sun QC, et al. UBE2T-regulated H2AX monoubiquitination induces hepatocellular carcinoma radioresistance by facilitating CHK1 activation. J Exp Clin Canc Res. 2020;39:222. doi: 10.1186/s13046-020-01734-4. - DOI - PMC - PubMed
    1. Zhu Y, Qu C, Hong X, Jia Y, Lin M, Luo Y, et al. Trabid inhibits hepatocellular carcinoma growth and metastasis by cleaving RNF8-induced K63 ubiquitination of Twist1. Cell Death Differ. 2019;26:306–20. doi: 10.1038/s41418-018-0119-2. - DOI - PMC - PubMed
    1. Zhao N, Wang R, Zhou L, Zhu Y, Gong J, Zhuang SM. MicroRNA-26b suppresses the NF-kappaB signaling and enhances the chemosensitivity of hepatocellular carcinoma cells by targeting TAK1 and TAB3. Mol Cancer. 2014;13:35. doi: 10.1186/1476-4598-13-35. - DOI - PMC - PubMed
    1. Forner A, Reig M, Bruix J. Hepatocellular carcinoma. Lancet. 2018;391:1301–14. doi: 10.1016/S0140-6736(18)30010-2. - DOI - PubMed

Publication types

MeSH terms