. 2022 Aug 22;12(1):14310.
doi: 10.1038/s41598-022-17909-2.

Improved correspondence of fMRI visual field localizer data after cortex-based macroanatomical alignment

Affiliations

Improved correspondence of fMRI visual field localizer data after cortex-based macroanatomical alignment

Mishal Qubad et al. Sci Rep. .

Abstract

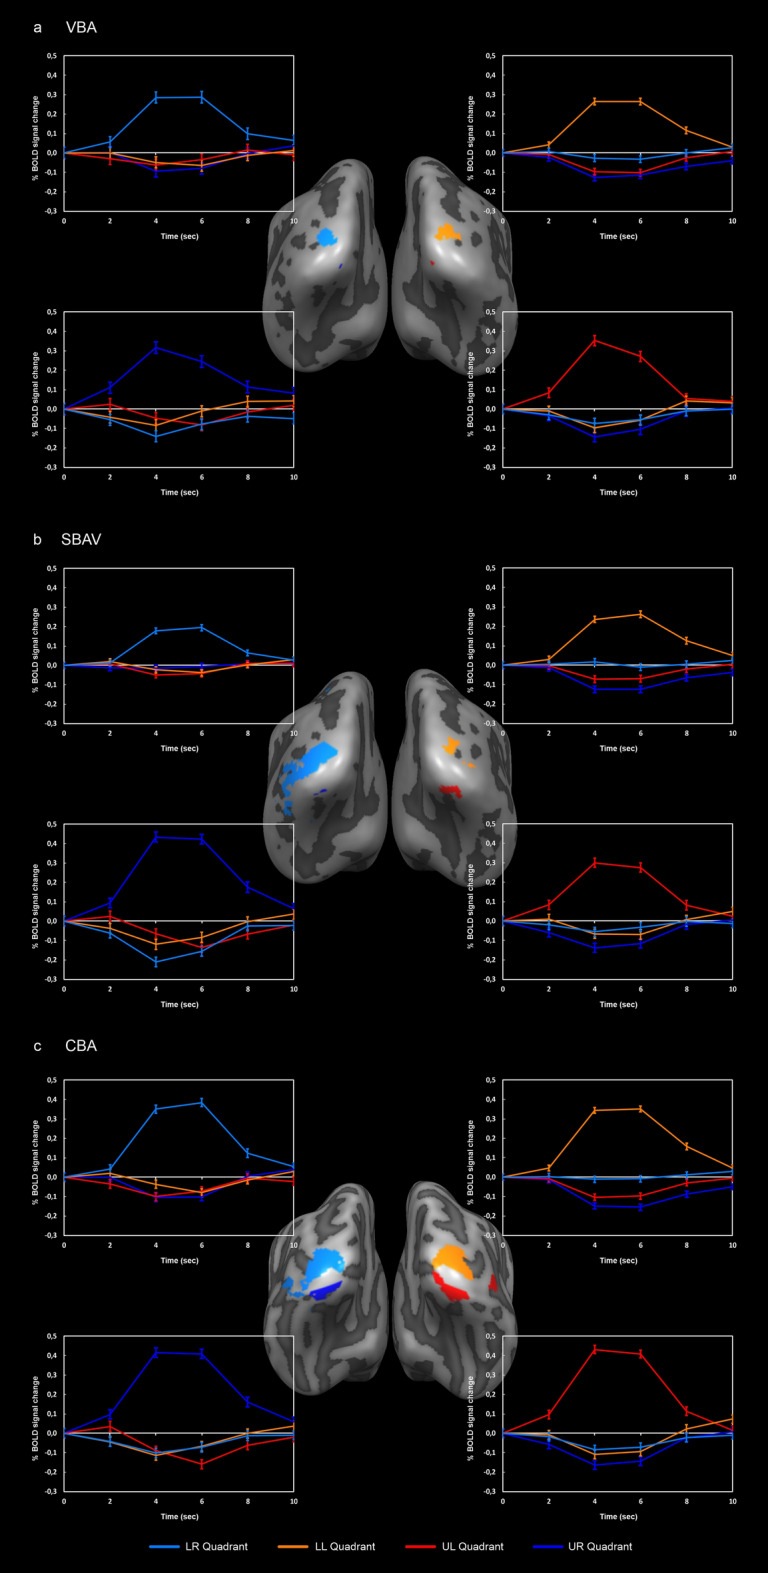
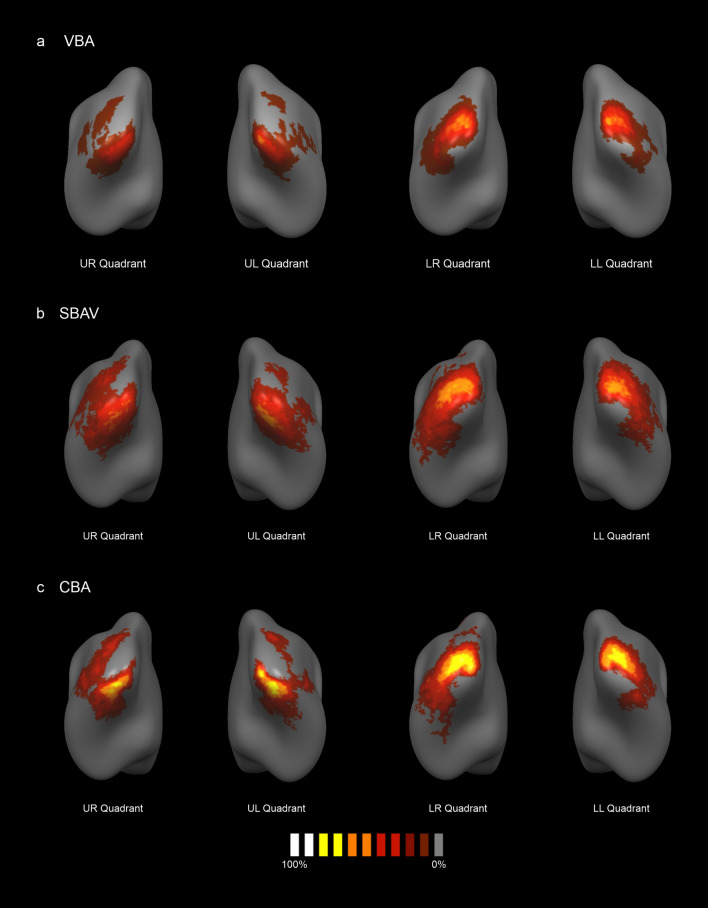
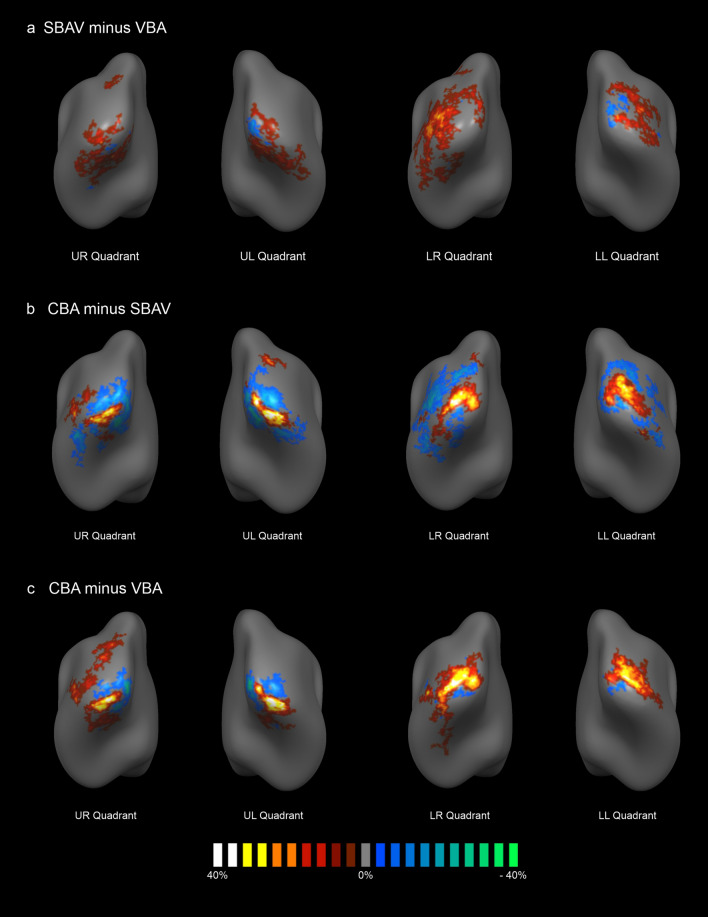
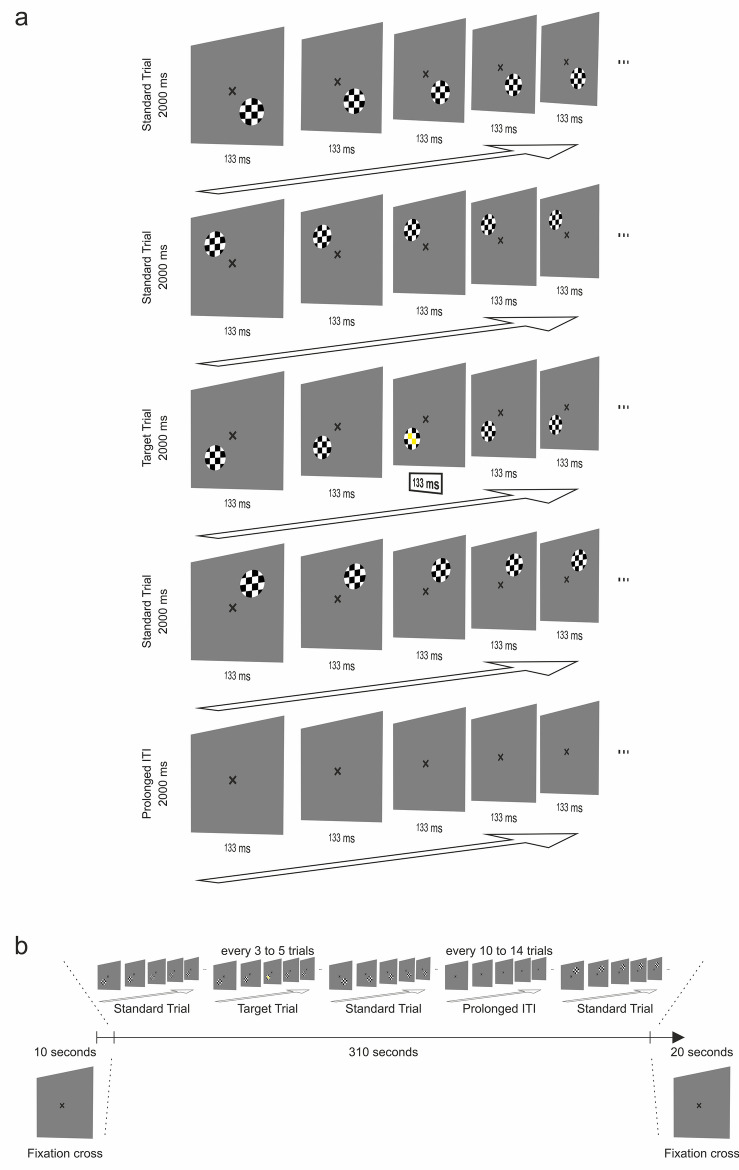
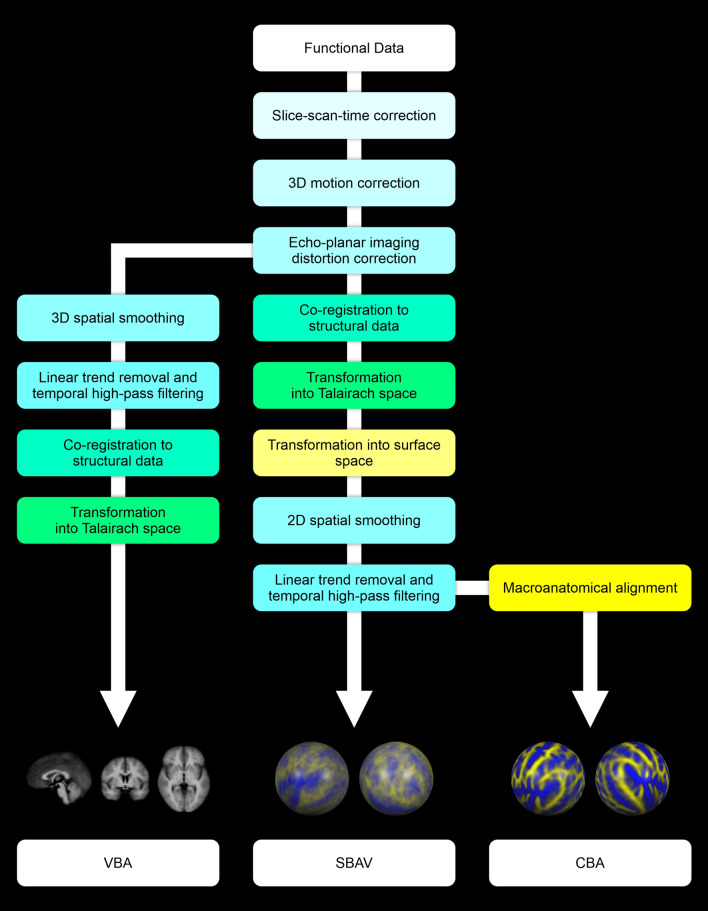
Studying the visual system with fMRI often requires using localizer paradigms to define regions of interest (ROIs). However, the considerable interindividual variability of the cerebral cortex represents a crucial confound for group-level analyses. Cortex-based alignment (CBA) techniques reliably reduce interindividual macroanatomical variability. Yet, their utility has not been assessed for visual field localizer paradigms, which map specific parts of the visual field within retinotopically organized visual areas. We evaluated CBA for an attention-enhanced visual field localizer, mapping homologous parts of each visual quadrant in 50 participants. We compared CBA with volume-based alignment and a surface-based analysis, which did not include macroanatomical alignment. CBA led to the strongest increase in the probability of activation overlap (up to 86%). At the group level, CBA led to the most consistent increase in ROI size while preserving vertical ROI symmetry. Overall, our results indicate that in addition to the increased signal-to-noise ratio of a surface-based analysis, macroanatomical alignment considerably improves statistical power. These findings confirm and extend the utility of CBA for the study of the visual system in the context of group analyses. CBA should be particularly relevant when studying neuropsychiatric disorders with abnormally increased interindividual macroanatomical variability.


Conflict of interest statement

The authors declare no competing interests.

Figures

Figure 1
Figure 1
Group analysis of visual quadrants. (a) VBA results. Maps and average timecourses were computed in volume space; maps were projected on the non-aligned average surface representation. (b) SBAV results. Maps and average timecourses were computed in surface space; maps were projected on the non-aligned surface representation. (c) CBA results. Maps and average timecourses were computed in surface space; maps were projected on the aligned average surface representation. Overall, two out of four visual quadrant ROIs exhibited a pattern of continuously increasing cluster size, reflecting an increasing extent of significant position selectivity across alignment techniques. Additionally, while ROI size for the lower left visual quadrant decreased slightly from VBA to SBAV, ROI size for CBA was also by far the largest. Only the ROI of the lower right visual quadrant showed a cluster size decrease after CBA. Average timecourses (incl. standard error of the mean) showed clear position selectivity with a strong BOLD signal increase for the position of interest and no BOLD signal increase for the other three positions. ROI/graph colors: light-blue = lower right (LR) visual quadrant, orange = lower left (LL) visual quadrant, red = upper left (UL) visual quadrant, dark-blue = upper right (UR) visual quadrant.
Figure 2
Figure 2
Probability maps (PMs). PMs indicating the probability of activation overlap across subjects for each visual quadrant. The color code gray-to-white indicates the probability of activation overlap of single-subject maps, thresholded at a minimum of 10% probability of activation overlap. Single-subject maps were thresholded at p < 0.05 (uncorr.). We also applied a cluster level threshold of 100 vertices. (a) PMs for VBA showed a maximum probability of activation overlap of up to 55%. (b) PMs for SBAV showed a maximum probability of activation overlap of up to 66%. (c) PMs for CBA showed a maximum probability of activation overlap of up to 86%.
Figure 3
Figure 3
Probability Difference Maps (PDMs). PDMs indicating the differential impact of the individual steps of our overall macroanatomical alignment approach for each visual quadrant. PDMs were generated using PMs derived from single-subject maps. PMs were unthresholded. The color code indicates the difference of activation overlap. The color code brown-to-white indicates a higher degree of functional activation overlap for the more advanced alignment method. The color code blue-to-green indicates a higher degree of functional activation overlap for the less advanced alignment method. PDMs were thresholded at a minimum probability difference of 5%. (a) The impact of surface-based functional data readout and pre-processing compared to standard volume-based alignment (SBAV minus VBA) was characterized by a widespread activation with an increase in the probability of activation overlap of up to 30% around the central ROIs and a decrease in the probability of activation overlap of up to 19 % at the location corresponding to the central ROIs. (b) The additional impact of macroanatomical alignment (CBA minus SBAV) was less widespread but characterized by an increase in the probability of activation overlap of up to 44% at the location of the central ROIs and a decrease in the probability of activation overlap of up to 32% around the central ROIs. (c) The additive impact of both methodological elements (CBA minus VBA) was characterized by an increase in the probability of activation overlap of up to 52% at the location of the central ROIs and a decrease in the probability of activation overlap of up to 36% around the central ROIs.
Figure 4
Figure 4
Single-subject peak vertex distribution maps for SBAV and CBA data sets. We mapped single-subject peak vertices for each visual quadrant in surface space for SBAV and CBA data. We then calculated the vertex-wise number of single-subject peak vertices. The color code indicates the number of overlapping single-subject peak vertices per vertex. We observed an increase in the number of overlapping single-subject ROI peak vertices per vertex after macroanatomical alignment (CBA). The number of single-subject peak vertices per occipital vertex for each visual quadrant before and after macroanatomical alignment (SBAV and CBA) ranged between 1 and 5. Thus, a higher number indicates an improved alignment precision of single-subject ROI peak vertices. LR lower right visual quadrant, LL lower left visual quadrant, UL upper left visual quadrant, UR upper right visual quadrant.
Figure 5
Figure 5
Visual field localizer paradigm. (a) The paradigm consisted of flickering, black-and-white colored checkerboards that appeared randomly at homologous positions of the participant’s visual quadrant. In 25% of the trials, the two centrally located squares changed their color to yellow for 133 ms. Participants were required to press a response box button when noticing that. Participants were instructed to continuously fixate a black, x-shaped fixation cross presented at the center of the screen. Checkerboards appeared for 2000 ms. The regular inter-trial interval (ITI) was 0 ms. (b) Every 10–14 trials, the ITI extended to 2000 ms. The task comprised 144 trials (25% target trials). It was preceded and followed by a presentation of the fixation cross for 10 s.
Figure 6
Figure 6
Fully data-driven CBA approach. CBA consisted of a rigid alignment to a single target brain and a non-linear alignment to an iteratively updated group average brain. (a) We carried out an initial CBA solely to generate an unbiased average target brain for the final CBA. We used a randomly selected brain from among all participants for the initial rigid CBA. (b) For the final CBA we used the unbiased average target brain created during the initial CBA for rigid CBA. (c) We generated average surface representations before and after macroanatomical alignment for each hemisphere, which we subsequently merged, inflated and used for analysis and visualization of the appropriate data sets. The upper row depicts group average spherical, folded and inflated mesh representations before applying CBA. The lower row depicts group average spherical, folded and inflated mesh representations after applying CBA.
Figure 7
Figure 7
Sequences of functional data pre-processing, coregistration of structural and functional data and spatial transformation operations used to generate the three functional data sets used in our study: VBA, SBAV and CBA. For VBA we conducted all data pre-processing operations in volume space, including slice-scan-time correction, 3D motion correction, echo-planar imaging distortion correction, 3D spatial smoothing and linear trend removal with temporal high-pass filtering. Finally, functional data were co-registered to the structural data and transformed into Talairach space. For SBAV and CBA, we conducted all data pre-processing operations up to echo-planar imaging distortion correction in volume space. Here, co-registration of functional data to the structural data and transformation into Talairach space was followed by transformation into surface space. We then conducted 2D spatial smoothing and linear trend removal with temporal high-pass filtering in surface space. For CBA only, we subsequently applied macroanatomical alignment.

References

    1. Wandell BA, Dumoulin SO, Brewer AA. Visual field maps in human cortex. Neuron. 2007;56:366–383. doi: 10.1016/j.neuron.2007.10.012. - DOI - PubMed
    1. Corbetta M, Shulman GL. Control of goal-directed and stimulus-driven attention in the brain. Nat. Rev. Neurosci. 2002;3:201–215. doi: 10.1038/nrn755. - DOI - PubMed
    1. Das M, Bennett DM, Dutton GN. Visual attention as an important visual function: An outline of manifestations, diagnosis and management of impaired visual attention. Br. J. Ophthalmol. 2007;91:1556–1560. doi: 10.1136/bjo.2006.104844. - DOI - PMC - PubMed
    1. de Haan B, Bither M, Brauer A, Karnath HO. Neural correlates of spatial attention and target detection in a multi-target environment. Cereb. Cortex. 2015;25:2321–2331. doi: 10.1093/cercor/bhu046. - DOI - PubMed
    1. Goodale M, Milner D. One brain—two visual systems. Psychologist. 2006;19:660–663.

Publication types