. 2022 Sep;54(9):1390-1405.
doi: 10.1038/s41588-022-01157-1. Epub 2022 Aug 22.

Spatially restricted drivers and transitional cell populations cooperate with the microenvironment in untreated and chemo-resistant pancreatic cancer

Daniel Cui Zhou #  1   2 Reyka G Jayasinghe #  1   2 Siqi Chen  1   2 John M Herndon  3   4 Michael D Iglesia  1   2 Pooja Navale  1   5 Michael C Wendl  2   6   7 Wagma Caravan  1   2 Kazuhito Sato  1   2 Erik Storrs  1   2 Chia-Kuei Mo  1   2 Jingxian Liu  1   2 Austin N Southard-Smith  1   2 Yige Wu  1   2 Nataly Naser Al Deen  1   2 John M Baer  1   5 Robert S Fulton  2 Matthew A Wyczalkowski  1   2 Ruiyang Liu  1   2 Catrina C Fronick  2 Lucinda A Fulton  2 Andrew Shinkle  1   2 Lisa Thammavong  1   2 Houxiang Zhu  1   2 Hua Sun  1   2 Liang-Bo Wang  1   2 Yize Li  1   2 Chong Zuo  1 Joshua F McMichael  1   2 Sherri R Davies  3 Elizabeth L Appelbaum  2 Keenan J Robbins  3   4 Sara E Chasnoff  3 Xiaolu Yang  1 Ashley N Reeb  1   8 Clara Oh  1   2 Mamatha Serasanambati  1   2 Preet Lal  1   2 Rajees Varghese  1   2 Jay R Mashl  1   2 Jennifer Ponce  2 Nadezhda V Terekhanova  1   2 Lijun Yao  1   2 Fang Wang  9 Lijun Chen  10 Michael Schnaubelt  10 Rita Jui-Hsien Lu  1   2 Julie K Schwarz  4   11   12 Sidharth V Puram  8 Albert H Kim  4   13 Sheng-Kwei Song  1   14 Kooresh I Shoghi  1   14 Ken S Lau  15 Tao Ju  16 Ken Chen  9 Deyali Chatterjee  17 William G Hawkins  3   4 Hui Zhang  10 Samuel Achilefu  1   14 Milan G Chheda  1   4 Stephen T Oh  1   5 William E Gillanders  3   4 Feng Chen  1 David G DeNardo  18   19   20 Ryan C Fields  21   22 Li Ding  23   24   25   26
Affiliations

Spatially restricted drivers and transitional cell populations cooperate with the microenvironment in untreated and chemo-resistant pancreatic cancer

Daniel Cui Zhou et al. Nat Genet. 2022 Sep.

Abstract

Pancreatic ductal adenocarcinoma is a lethal disease with limited treatment options and poor survival. We studied 83 spatial samples from 31 patients (11 treatment-naïve and 20 treated) using single-cell/nucleus RNA sequencing, bulk-proteogenomics, spatial transcriptomics and cellular imaging. Subpopulations of tumor cells exhibited signatures of proliferation, KRAS signaling, cell stress and epithelial-to-mesenchymal transition. Mapping mutations and copy number events distinguished tumor populations from normal and transitional cells, including acinar-to-ductal metaplasia and pancreatic intraepithelial neoplasia. Pathology-assisted deconvolution of spatial transcriptomic data identified tumor and transitional subpopulations with distinct histological features. We showed coordinated expression of TIGIT in exhausted and regulatory T cells and Nectin in tumor cells. Chemo-resistant samples contain a threefold enrichment of inflammatory cancer-associated fibroblasts that upregulate metallothioneins. Our study reveals a deeper understanding of the intricate substructure of pancreatic ductal adenocarcinoma tumors that could help improve therapy for patients with this disease.


Conflict of interest statement

The authors declare no competing interests.

Figures
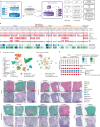
Fig. 1
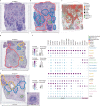
Fig. 1. Sampling strategy and cohort overview.
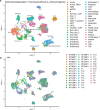
a, Spatial sampling approach. At least two punches or grids were selected from each tumor for comprehensive imaging and omics characterization. Prefixes: ‘P’ denotes tissue punches, ‘H’ denotes tissue grids, ‘R’ denotes remainder tissue and ‘A’ denotes a piece of tissue. Each associated piece of tissue was processed in a systematic fashion and utilized for the listed assays. b, Top, data overview of the cohort. Samples are organized by treatment status. M1K1 and M1G1 denote normal adjacent tissue (NAT) samples. Dots for each associated assay indicate data availability: red for tumor tissue, purple for NAT, and blue for tumor tissue and blood normal. Bottom, scRNA-based (blue) and histology-based estimates (green) of tumor purity (Methods). c, Overview of all cell types profiled in the scRNA-seq cohort. The left UMAP shows that a total of 232,764 cells were profiled from 73 samples and 21 cases, representing 32 cell types or states (colored by cell types). The right UMAP shows the 28,733 tumor cells subset (colored by sample). d, Data overview of the validation cohort. Treatment status is listed on the top followed by sample name and data availability. Dots for each associated assay indicate data availability: red for tumor tissue, and blue for tumor tissue and blood normal. For spatial transcriptome slides, the number indicated in the circle denotes the number of spatial transcriptome slides generated from that sample. e, Overview of spatial transcriptomics cohort. Samples are organized according to treatment groups. For each sample, the bottom image shows the H&E and the top image has cell types overlayed. DC, Dendritic Cells; ID, Identification; IF, Immunofluoresence; IMC, Immunohistochemistry.
Fig. 2
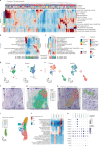
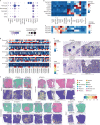
Fig. 2. Tumor subclusters with distinct cellular functions.
a, Differential pathway enrichment case-level tumor subpopulations. Each column is a different tumor subcluster; the top bar indicates treatment and the bottom indicates case ID. Two samples are highlighted: HT185P1 (red) and HT200P1 (blue). The heatmap denotes relative expression of each pathway for each tumor subcluster, grouped by pathway similarity indicated on the left (Methods). b, Tumor cluster pathway enrichment for HT185P1. For panels b and c, each column indicates a tumor subcluster (ID is listed at the bottom of each column), below which is a bar plot indicating the percentage of the cluster that comes from each spatial sample. The heatmap is colored by the relative expression of each pathway. c, Tumor cluster pathway enrichment for HT200P1. d, UMAP of tumor subclusters for HT185P1. The left UMAP highlights tumor subclusters with high relative expression of associated pathways outlined in panel b. The right UMAP indicates tumor subclusters colored by spatial samples. e, UMAP of tumor subclusters for HT200P1. UMAPs are equivalent to those shown in panel d but for pathways in panel c. f, H&E of the section used for spatial transcriptomics for HT264P1. g, snRNA-seq tumor subcluster mapping using the RCTD deconvolution approach for each spatial transcriptomic spot (Methods). Gray regions in each pie chart denote nontumor cell types and grayed out tumor subpopulations (Tumor_5 and Tumor_6) represent subpopulations with minimal mapping to the H&E section. h, Left, simplified version of g, where each spot with high confidence was assigned a single tumor subpopulation identity. Right, magnification of the Tumor_2 subpopulation, which has a different morphology from the surrounding tumor. i, UMAP of tumor nuclei subclusters from the paired HT264P1 snRNA-seq data. j, Pathway enrichment analysis of tumor subclusters focusing on the Tumor_2, Tumor_3 and Tumor_4 subpopulations. k, Top DEGs of tumor subclusters focusing on the Tumor_2, Tumor_3 and Tumor_4 subpopulations. The size of each bubble indicates the percentage of cells expressing the gene of interest and color indicates average expression. EMT, Epithelial-mesenchymal transition.
Fig. 3
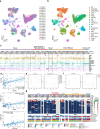
Fig. 3. Genomic landscape and oncogenic driver heterogeneity.
a, Tumor cell clusters labeled by case ID. b, Tumor cells labeled with genomic alterations including mutations and copy number alterations. Mutations are denoted by colored circles with a black outline, while deep copy number events (gain/loss of more than 1 copy) are denoted by colored circles without an outline. c, Ductal cells from case HT061P1. From left to right, tissue sample spatial locations; spatial sample IDs (R1 denotes the remainder tissue); KRAS variant mapping; and AKT2 CNV, MYC CNV and GATA6 CNV mapping. Spatial samples are labeled with a ‘P’ to denote punches and ‘R’ to denote remainder tissue. Copy number calls were obtained using inferCNV and CNV status is indicated by color. d, CNV-based lineage tree of a subset of ductal cells from HT061P1. e, Proposed model of tumor progression for HT061P1. f, Bulk phosphosite levels in the PI3K/Pdk1/Akt and Raf/Mek/Erk pathways. Cells filled in gray denote missing data. Samples with proteomics/phosphoproteomics all did not have mutations in CDKN2A. NA, No coverage for mutant or reference allele; Ref, Reference allele.
Fig. 4
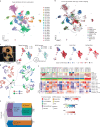
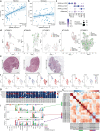
Fig. 4. Acinar, ductal and transitional populations.
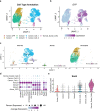
a, UMAP clustering of acinar, ductal, transitional and PDAC tumor cells across the single-cell cohort. Mutations and deep copy number events were mapped to individual cells (Methods). Copy number events are indicated by colored dots with no outline, while an outlined black circle denotes a mutation event. b, UMAP clustering of acinar, ductal, transitional and PDAC tumor cells colored by cell-type annotation from single-cell RNA-seq samples. c, Proportion of cells identified as acinar, ductal, transitional and PDAC tumor cells by sample. d, Highly expressed genes identified in each cell type. The size of the bubble indicates the percentage of cells expressing the gene of interest and color indicates average expression. The bubble plot is ordered by expression across each cell-type group. AMY2A/2B and KRT19 are indicated in bold because they are genes used for staining acinar cells and ductal cells, respectively, in the following immunofluorescence assays. ADM cells show expression of both of these markers in the scRNA data. e, Cell-type annotation and genomic alterations mapped across acinar, normal ductal, PanIN and ADM populations. UMAP of cell-type annotation indicates two distinct ADM populations annotated as ADM_Normal and ADM_Tumor. f, Copy number was annotated using CopyKAT, which predicts aneuploid cells independent of identifying tumor populations. Cells are colored by ploidy status. g,h, CDKN2A (g) and KRAS (h) mutation mappings are indicated in the lower two UMAPs and are colored by reference, variant and variant/reference supporting cells. i, Monocle pseudotime analysis indicates a cell-state transition from acinar cells to ADM_Tumor and ADM_Normal states independently. Each cell is colored by pseudotime which is a measurement of the change each cell is making through a process (for example, differentiation) and is annotated with a trajectory of change in the solid line overlaying the UMAP. Inset of the trajectory shows a summary of the cell-state transitions, with dots indicating cell type.
Fig. 5
Fig. 5. Validation of ADM using snRNA and immunofluorescence.
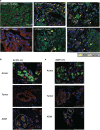
a, UMAP plots of acinar and ductal cells from two cases, HT288P1 and HT412P1. Cells are colored by sample. b, UMAP plots of acinar and ductal cells colored by cell types. c, Gene expression signatures derived from scRNA data of acinar and ductal genes across cell types. Each dot indicates expression of a given gene in an annotated cell cluster. The size indicates the percentage of cells expressing that gene and the color is average expression. ADM cells show expression of both acinar and ductal markers in the snRNA data. d, Immunofluorescence staining of tumor and NAT sections. Amylase stains acinar cells (green), cytokeratin-19 stains ductal cells (red), Ki67 stains proliferating cells (white) and Hoechst stains nuclei (blue). For select sections, individual cells expressing both acinar and ductal markers, indicating ADM, are highlighted by the yellow arrowheads. Acinar cells are denoted with a yellow arrow and ductal cells with an outlined yellow angle. e, Proposed models of PDAC development. Development of PDAC along the spectrum from normal to PDAC in humans was initially suggested to be derived predominantly from ductal origin, but, with evidence of ADM cells in humans, an additional model of transition from acinar origin to PDAC is proposed.
Fig. 6
Fig. 6. Tumor and transitional cell heterogeneity in spatial transcriptomics data.
a, H&E of the section used for spatial transcriptomics for HT288P1. b, Pathologist-annotated regions of HT288P1. Regions highlighted include tumor (red), pancreatitis-like (blue), normal duct (green) and acinar (pink). Numbers are listed next to each annotated area if more than one are reported. c, snRNA-seq mapping using the RCTD deconvolution approach for each spatial transcriptomics spot (Methods). Each spot is colored by the expected representation of the cell types discovered from snRNA-seq. Regions of tumor, normal duct and acinar are highlighted with black dashes, showing similarity between pathology-assisted annotations and deconvolution. d, Pathologist-annotated regions of HT259P1. Numbers are listed next to each annotated area if more than one is reported. e, Pathologist-annotated regions of HT231P1. Numbers are listed next to each annotated area if more than one is reported. f, DEGs identified by spatial transcriptomics pathology-assisted regions with a focus on normal duct and PanIN. The size of the bubble indicates the percentage of cells expressing that target gene and color indicates average expression. Top, HT259P1 spatial transcriptome DEG analysis. Middle, HT231P1 spatial transcriptome DEG analysis. Bottom, spatial transcriptome-derived DEGs mapped to scRNA-seq acinar, ductal and transition populations.
Fig. 7
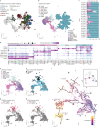
Fig. 7. CAF subpopulations across treatment groups.
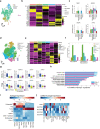
a, CAF subtype distribution across the cohort and across treatment groups. CAF subtype colors are indicated at the top and are consistent throughout panels ac. b, Key markers and DEGs in each CAF subtype. c, Expression of genes currently targeted by clinical trials across CAF subtypes. The size of the bubble indicates the percentage of cells expressing the gene of interest and color indicates average expression. d, Cell-type percentage differences in tumor, endothelial and fibroblast cells among treatment groups. The mixed and Chemo-RT singleton cases were excluded in these analyses (n = 41 treated, n = 25 untreated). ***P < 10−3 (exact P = 0.0026360), using a two-sided Wilcoxon rank sum test. The boxplots show the median with 1.5 × interquartile range whiskers. e, Top, average cell-type percentages split into treated versus untreated groups. Bottom, average cell-type distributions of the main CAF subtypes (iCAF, myCAF and apCAF) split into treated versus untreated groups (n = 41 treated, n = 25 untreated). ***P < 10−3 (exact P = 0.0065984), using a two-sided Wilcoxon rank sum test. f, DEGs between treated and untreated iCAFs. g, Expression of metallothionein genes across treatment groups in iCAFs and tumor cells. h, Top differentially expressed proteins across treated and untreated samples. i, Differential gene expression in specific cell types that match the proteins in panel h (n = 41 treated samples, n = 25 untreated samples). The boxplots show the median with 1.5 × interquartile range whiskers.
Fig. 8
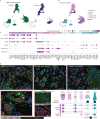
Fig. 8. Myeloid and lymphocyte populations in the TME.
a, Expression of Nrf2 pathway genes in myeloid and tumor cells. The size of the bubble indicates the percentage of cells expressing the gene of interest and color indicates average expression. b, Expression of immune checkpoint receptor and ligand genes across cell types. c, Expression of the four nectin receptors across all cell types. d, Average expression of TIGIT, NECTIN1, NECTIN2, NECTIN3 and NECTIN4 in exhausted T cells, NK cells, Tregs and tumor cells. Each column denotes a spatial sample and columns are grouped by case ID. e, TIGIT expression in lymphocyte-infiltrated regions from two spatial transcriptomics cases. f, NECTIN4 expression colocalization with tumor spots across the spatial transcriptomics cohort. For each slide, the bottom image shows TIGIT expression and the top shows cell types. Tumor cells are colored bright pink.
Extended Data Fig. 1
Extended Data Fig. 1. Details of Data Cohort Overview.
a) All 232,764 cells labeled by case ID. b) Same as A, but cells are labeled by cell type. c) scRNA cell type proportions across samples in the cohort. The bigger the circle, the higher the proportion. d). Spearman correlations of tumor estimates. The 95% confidence interval is shown. Top: histology vs scRNA, Middle: ABSOLUTE vs scRNA, Bottom: ABSOLUTE vs histology. e) Proteomics and phosphoproteomics PCAs labeled by case ID. f) Proteomics and phosphoproteomics PCAs labeled by TMT plex. g) Top: Genomic landscape of the cohort showing the top significantly mutated genes. The color scale denotes variant allele fraction (VAF) for each gene. The top bar plot indicates mutation burden for each sample. Bottom: Bulk omics overview of the cohort. The first row indicates germline mutation status followed by scRNA tumor fraction, immune subtype, relative scores of immune and stroma, and different PDAC subtypes (Moffitt, Collisson, Bailey) by piece.
Extended Data Fig. 2
Extended Data Fig. 2. Genomic Features in Heterogeneous KRAS Subpopulations.
a) Spearman correlation of scRNA estimates and ESTIMATE stroma score. b) Spearman correlation of scRNA estimates and ESTIMATE immune score. For panels A and B, the 95% confidence interval is shown. c) Top significant DEGs between specific KRAS hotspot mutations. Only cells with a mappable KRAS mutation were included in this analysis. d) KRAS mutations in tumor cells of 5 cases with multiple KRAS variants mapped. e) H&E images of the spatial samples in HT061P1. f) Arm and gene-level CNV events in HT061P1 mapped to different tumor clusters. g) Percent of mappable mutations or deep copy number amplifications and/or deletions in each sample for KRAS, TP53, CDKN2A, and SMAD4. Samples are grouped together by case and cases are separated by white lines. h) Protein-level pairwise spearman correlation between all 30 samples that underwent bulk proteomics. Boxed cases represent cases with high heterogeneity: HT064P1 in green, HT123P1 in red, and HT124P1 in purple. i) Cell type proportion distribution of the three heterogeneous cases from panel H. Cell types in dotted boxes represent substantial differences in cellular composition that likely underlie the observed heterogeneity.
Extended Data Fig. 3
Extended Data Fig. 3. Evaluating Transitional Populations in Published Studies.
a) Integration of downsampled cells from tumor samples from Peng et al., and WashU samples. UMAP shows integrated single cells colored by cell type. Circled region indicates cells that are specific to the WashU Cohort predominantly made of up PanIN and ADM identified cells. b) Integration of downsampled cells from tumor samples from Peng et al., and WashU samples. UMAP shows integrated single cells colored by case. Cases indicated with ‘HT#P1’ are WashU samples while samples with ‘T#’ are from Peng et. al.
Extended Data Fig. 4
Extended Data Fig. 4. Combined Channel Immunofluorescence Images of ADM Samples.
a) Combined channel immunofluorescence staining across four samples HT288P1 (Adjacent Normal), HT190P1 (Tumor), HT122P1 (Tumor) and HT288P1 (Tumor). Amylase stains acinar cells (green), cytokeratin 19 stains ductal cells (red), Ki67 stains proliferating cells (white), and Hoechst stains nuclei (blue). For select sections, individual cells expressing both acinar and ductal markers indicating acinar to ductal metaplasia (ADM) are highlighted by the yellow triangle. Acinar cells are denoted with a yellow arrow. b) Combined channel immunofluorescence staining across two samples HT412P1 (Tumor) and c) HT434P1 (Tumor). Amylase stains acinar cells (green), cytokeratin 19 stains ductal cells (red), Ki67 stains proliferating cells (white), and Hoechst stains nuclei (blue). Cells exhibiting co-expression of Amylase and cytokeratin 19 are circled in white. Regions of the section with high acinar content, tumor content and ADM content are shown from top to bottom for each sample.
Extended Data Fig. 5
Extended Data Fig. 5. Single Cell Analysis of Mouse Model Validating Transitional Acinar Populations.
a) UMAP of acinar and ductal single cells from mouse model. Cells are colored by cell type. b) UMAP of GFP expression. Cells are colored by expression value. c) UMAP of acinar and ductal cells separated by mouse model from which cells are derived from. d) Selected gene expression markers of acinar and ductal genes across cell types. Each dot indicates expression of a given gene in an annotated cell cluster. The size indicates the percent of cells expressing that gene and the color is average expression. e) Violin plot showing the distribution of expression levels of Sox9 across each annotated cell type.
Extended Data Fig. 6
Extended Data Fig. 6. Evaluating Transitional Populations with Spatial Transcriptomics and Published Studies.
a) H&E images associated with each piece of tumor that underwent spatial transcriptomics processing. Regions on slides are highlighted based on pathology assisted review. Regions are indicated as tumor (Red), PanIN (Yellow), Normal Duct (Green), Pancreatitis (Blue) and Acinar (Purple).
Extended Data Fig. 7
Extended Data Fig. 7. CAF Subtypes.
a) UMAP of all fibroblast cells labeled by CAF subtype. b) Top DEGs and pathways across iCAFs, myCAFs, and apCAFs. c) CAV1 and CAV2 expression in CAF subtypes, tumor cells, and fibroblasts from NAT samples. d) CXCR4 and CXCL12 expression in CAF subtypes and tumor cells. e) HIF1A and NFE2L2 expression in CAF subtypes, tumor cells, macrophages, and monocytes. FDR < 0.0001 for macrophage and monocyte upregulation of NFE2L2 and HIF1A. Panels D-F include expression from all cells in the study of the given cell type and the boxplots show the median with 1.5x IQR whiskers.
Extended Data Fig. 8
Extended Data Fig. 8. Immune Cells in PDAC.
a) UMAP of myeloid and dendritic cells (DC) labeled by cell type. b) Myeloid and DC cell type marker expression. c) Expression of the Keap1-Nrf2 (NFE2L2) pathways genes in all myeloid, DC, and tumor cells in the study. The boxplots show the median with 1.5x IQR whiskers. d) UMAP of lymphocyte and NK cells labeled by cell type. e) Lymphocyte cell type marker expression. f) Cell type percentages of lymphocytes across treatment groups. g) Expression of heat shock genes across treatment groups in Treg and CD4 + T cells (cells from n = 26 FOLFIRINOX samples, n = 15 Gemcitabine + Nab-paclitaxel samples, n = 25 untreated samples). The boxplots show the median with 1.5x IQR whiskers. h) Pathway enrichment of FOLFIRINOX vs treatment-naïve samples in Treg and CD4 + T cells using gene set overrepresentation analysis. i) Average expression of genes in lymphocytes and tumor cells in the scRNA data. j) Average expression of TIGIT and nectin genes across cell types in the snRNA data.

References

    1. Siegel RL, Miller KD, Fuchs HE, Jemal A. Cancer statistics, 2022. CA Cancer J. Clin. 2022;72:7–33. - PubMed
    1. McGuigan A, et al. Pancreatic cancer: a review of clinical diagnosis, epidemiology, treatment and outcomes. World J. Gastroenterol. 2018;24:4846–4861. - PMC - PubMed
    1. Saad AM, Turk T, Al-Husseini MJ, Abdel-Rahman O. Trends in pancreatic adenocarcinoma incidence and mortality in the United States in the last four decades; a SEER-based study. BMC Cancer. 2018;18:688. - PMC - PubMed
    1. Rawla P, Sunkara T, Gaduputi V. Epidemiology of pancreatic cancer: global trends, etiology and risk factors. World J. Oncol. 2019;10:10–27. - PMC - PubMed
    1. Ilic M, Ilic I. Epidemiology of pancreatic cancer. World J. Gastroenterol. 2016;22:9694–9705. - PMC - PubMed

Publication types

MeSH terms