. 2022 Sep;28(9):1924-1932.
doi: 10.1038/s41591-022-01953-6. Epub 2022 Aug 22.

Neutralization titer biomarker for antibody-mediated prevention of HIV-1 acquisition

Affiliations

Neutralization titer biomarker for antibody-mediated prevention of HIV-1 acquisition

Peter B Gilbert et al. Nat Med. 2022 Sep.

Abstract

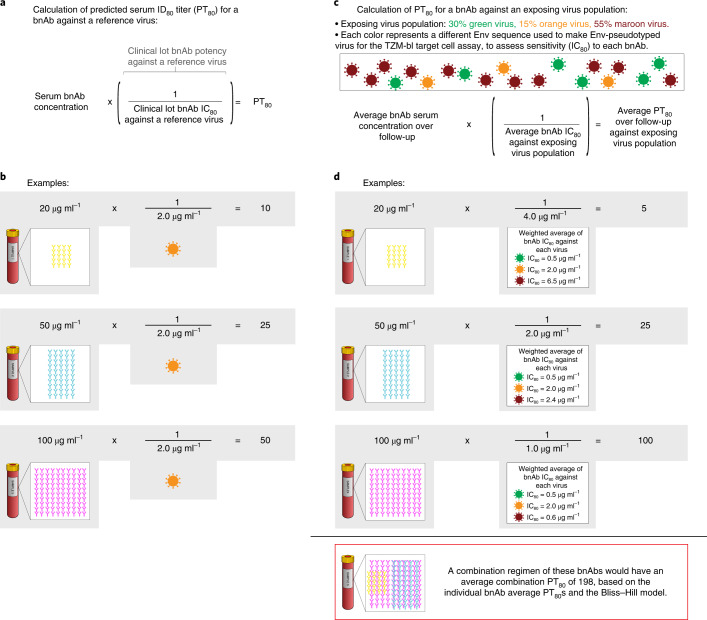
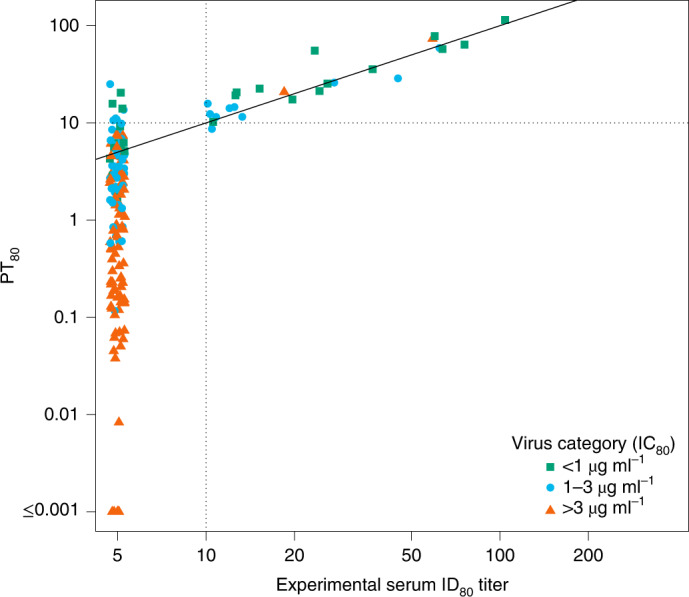
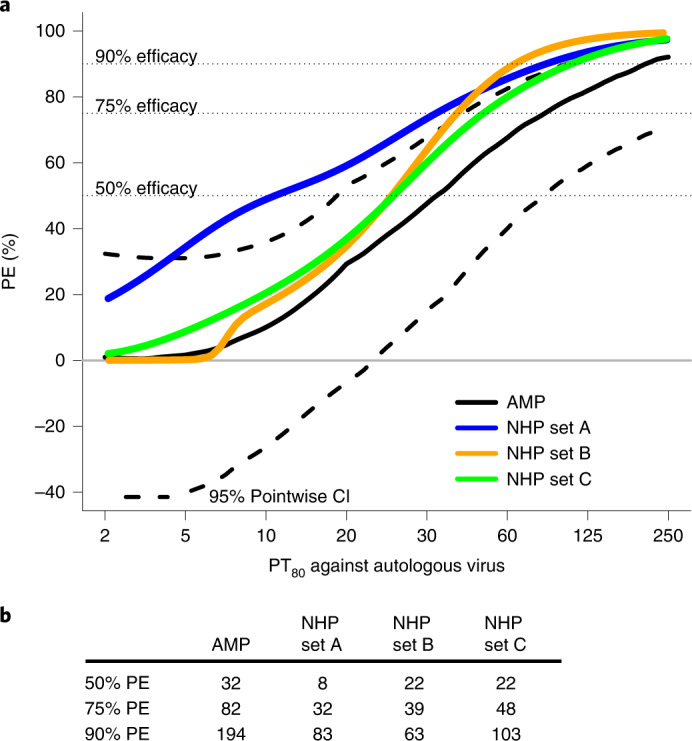
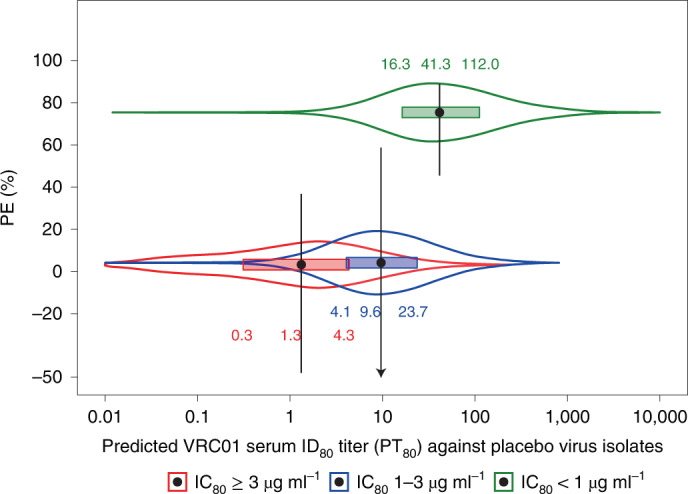
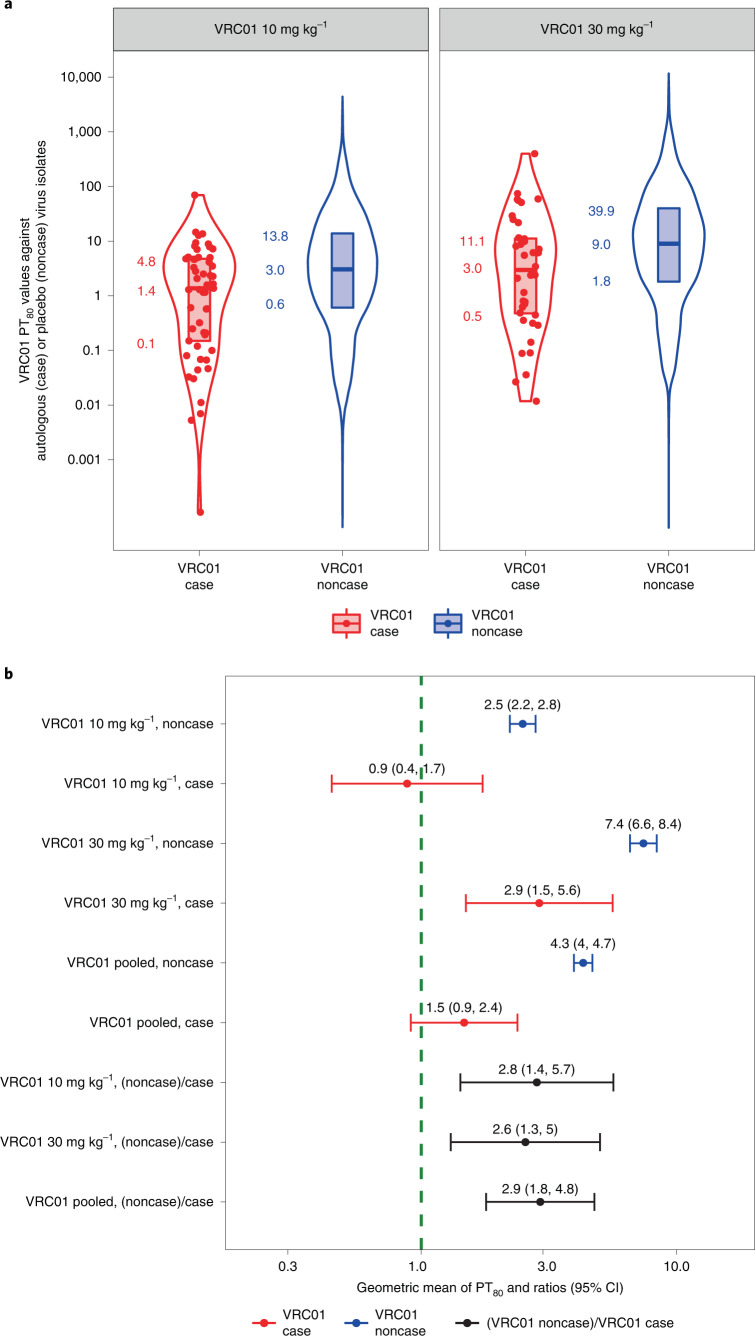
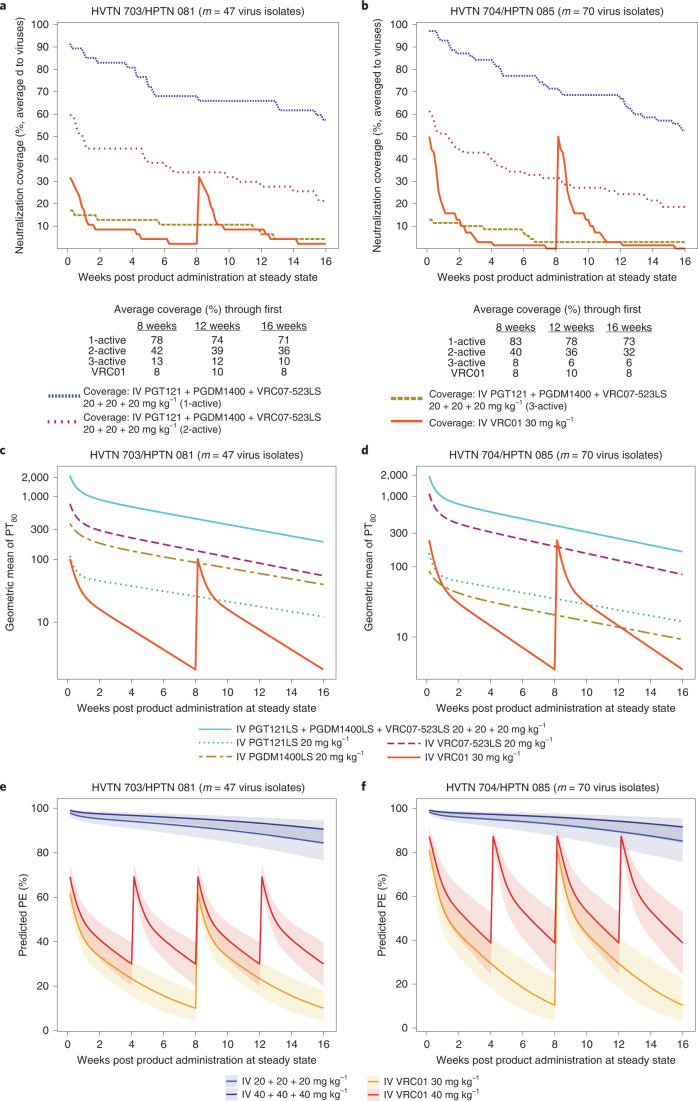
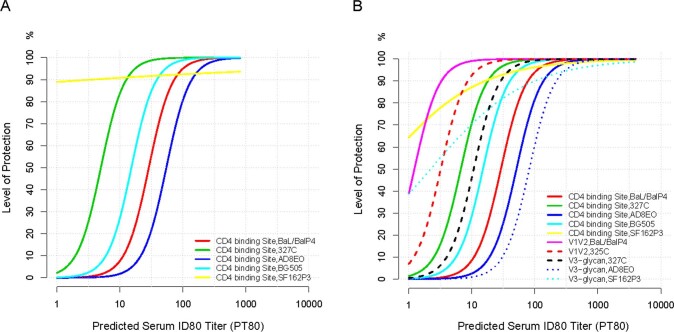
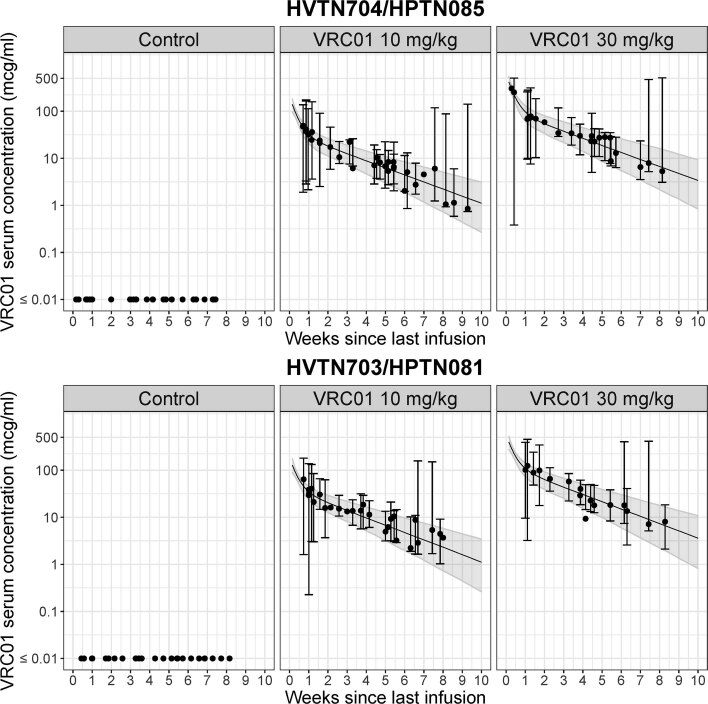
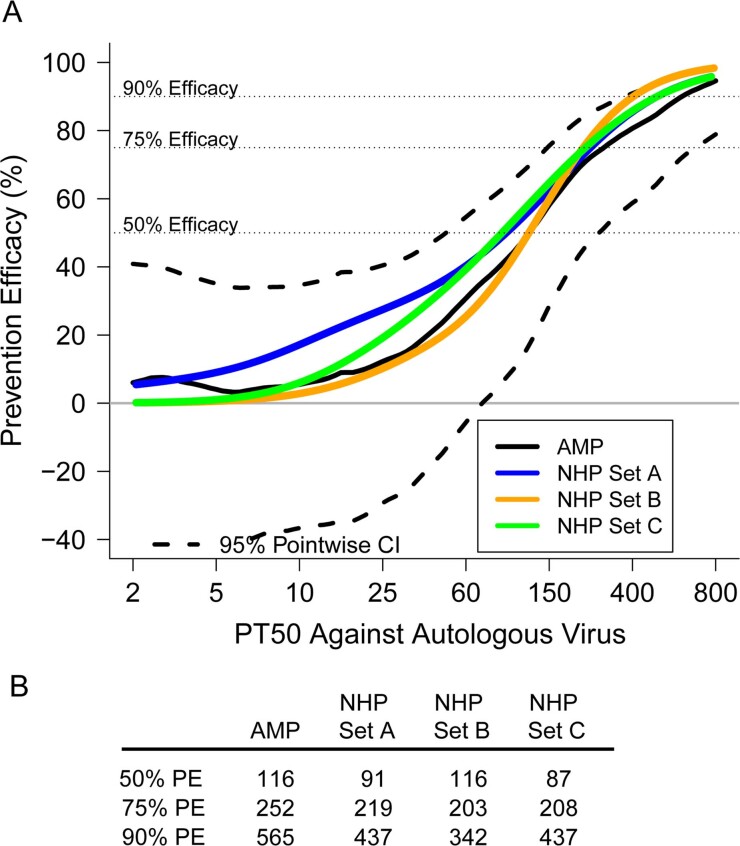
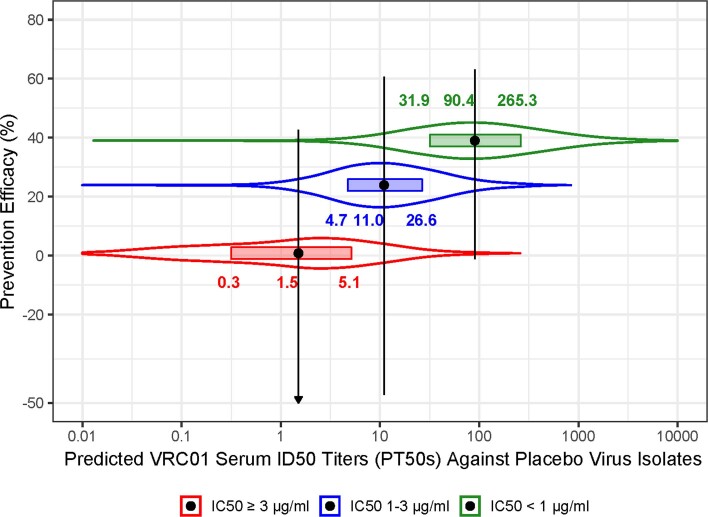
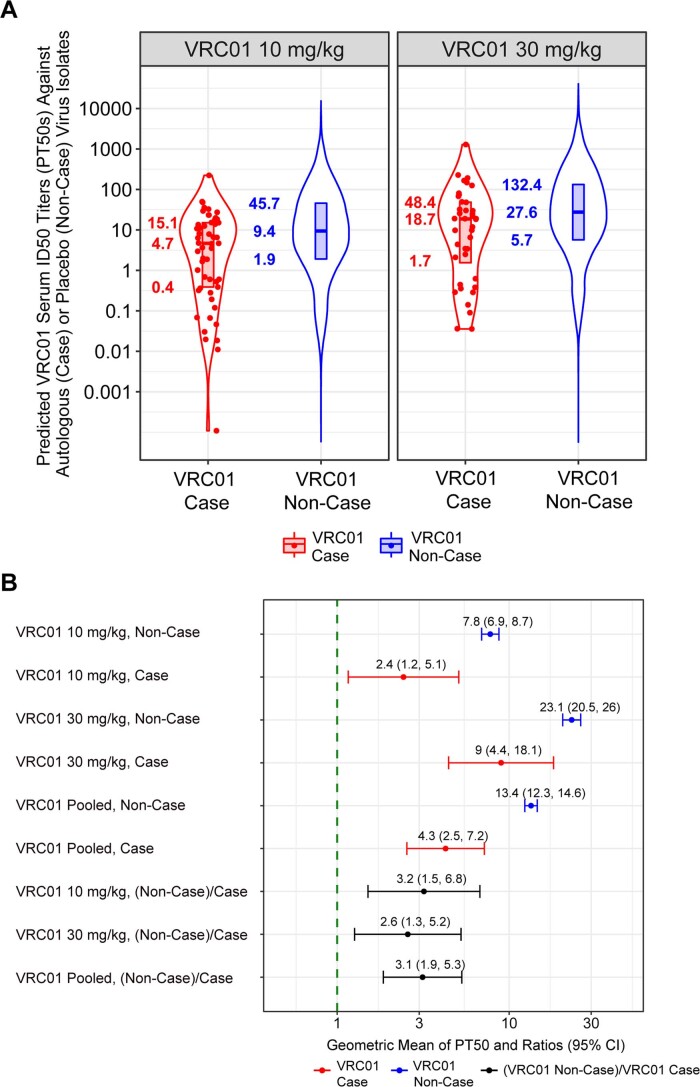
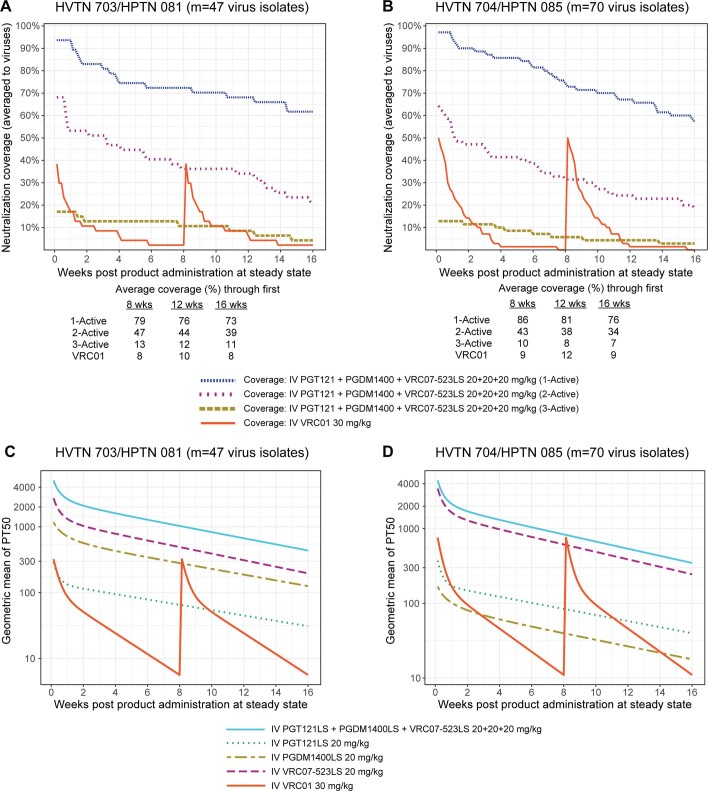
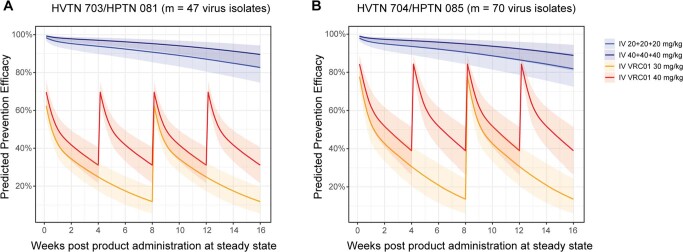
The Antibody Mediated Prevention trials showed that the broadly neutralizing antibody (bnAb) VRC01 prevented acquisition of human immunodeficiency virus-1 (HIV-1) sensitive to VRC01. Using AMP trial data, here we show that the predicted serum neutralization 80% inhibitory dilution titer (PT80) biomarker-which quantifies the neutralization potency of antibodies in an individual's serum against an HIV-1 isolate-can be used to predict HIV-1 prevention efficacy. Similar to the results of nonhuman primate studies, an average PT80 of 200 (meaning a bnAb concentration 200-fold higher than that required to reduce infection by 80% in vitro) against a population of probable exposing viruses was estimated to be required for 90% prevention efficacy against acquisition of these viruses. Based on this result, we suggest that the goal of sustained PT80 <200 against 90% of circulating viruses can be achieved by promising bnAb regimens engineered for long half-lives. We propose the PT80 biomarker as a surrogate endpoint for evaluatinon of bnAb regimens, and as a tool for benchmarking candidate bnAb-inducing vaccines.


Conflict of interest statement

The authors declare no competing interests.

Figures

Fig. 1
Fig. 1. Visual representation of how two independent pieces of information (serum bnAb concentration at a given time point and neutralization sensitivity of a target virus to the bnAb (IC80)) are used to calculate the PT80 biomarker.
a, Formula for calculation of PT80 for a bnAb against a target virus. IC80 for a clinical lot bnAb product against a target virus, as determined by the TZM-bl target cell assay, is the bnAb concentration needed for 80% reduction in RLU compared with target virus control wells after subtraction of background RLU. Based on the PT80 biomarker, increasing bnAb serum concentration and increasing target virus sensitivity (that is, decreasing IC80) have an equal impact on increasing PT80 and hence improvement in potential prevention efficacy. b, Example calculations showing how PT80 against a target virus differs for three different bnAbs sharing the same IC80 against the target virus yet are present at different serum concentrations. A similar result would be obtained (differing PT80 values) if the same bnAb was present at three different serum concentrations. c, Adaptation of the formula shown in a to a scenario where average PT80 is calculated against a population of exposing viruses. d, Example calculations of average PT80 over a follow-up period against an exposing virus population for three different bnAbs. The yellow bnAb has characteristics of VRC01 observed in the AMP trials (average serum concentration over VRC01 recipients and over 80 weeks of follow-up 20 µg ml–1, average IC80 of exposing viruses 4.0 µg ml–1, which is calculated as the weighted average of the three IC80s: for example, (0.5 µg ml–1) × 0.30 + (2.0 µg ml–1) × 0.15 + (6.5 µg ml–1) × 0.55 = 4.0 µg ml–1). If IC80 is used for comparison of the yellow and blue bnAbs, the results indicate that the blue bnAb is twofold better than the yellow in regard to its potential prevention efficacy, whereas if PT80 is used for comparison the blue bnAb is fivefold better than the yellow. The PT80 biomarker is superior on account of its enhanced measurement of neutralization potency against anticipated exposing viruses.
Fig. 2
Fig. 2. Agreement between predicted versus experimental serum neutralization ID80 titer.
Sera from samples from the last visit (and for a subset from the last two visits) and before the first positive HIV-1 RNA PCR test were assayed against autologous isolates from 64 VRC01 recipients who acquired HIV-1 infection (cases) (90 isolates, 164 titers). PT80 values are plotted against experimental ID80 for each sample and each isolate (Lin’s concordance correlation coefficient = 0.90 (95% CI 0.56–0.98)). PT80 was calculated as popPK model-predicted concentration divided by IC80. Nine of 164 experimental ID80 titers were below the limit of detection at PT80 > 10 (range 10.6–25.1). One of 164 experimental ID80 titers was at or above the limit of detection at PT80 < 10 (8.7). Dashed horizontal and vertical lines at a PT80 = 10 show the experimental ID80 limit of detection; concordance of predicted versus experimental values above versus below 10 was 154/164 (94%). Sera with PT80 < 1.0 were not experimentally tested, as this would have required concentration of sera.
Fig. 3
Fig. 3. Estimated PE by PT80 to the autologous acquired virus in AMP trials and in NHP studies.
a, Estimated PE by PT80 to the acquired virus in AMP (black solid line) compared with the protection curve in three different sets of NHP (blue, mustard and green lines). b, PT80 values associated with 50, 75 and 90% PE for AMP trials and each of the three sets of NHP. PT80 values <2 were set to 1. Set A: n = 274 NHPs that received a single bnAb followed by SHIV challenge, bnAb titer data from all neutralization assays; set B: only the NHPs in set A that received a CD4 binding site-targeting bnAb, excluding all that were challenged with SF162P3 and including only bnAb titer data from the TZM-bl target cell assay; and set C: all NHPs in set A but excluding those that received a membrane-proximal external region-targeting bnAb and all those challenged with SF162P3, and including only bnAb titer data from the TZM-bl target cell assay. The dashed horizontal lines are drawn at the y-axis values of 50, 75 and 90. These lines indicate the various curves that intersect a level of prevention efficacy of 50%, 75% or 90%.
Fig. 4
Fig. 4. Distributions of VRC01 serum PT80 against viruses acquired by placebo recipients, within each virus neutralization IC80 sensitivity category.
Approach 2 of Huang et al. was used to calculate PT80 against a given virus, by dividing the popPK model-predicted VRC01 serum concentration by the IC80 of the VRC01 drug product against the virus. The distributions are for PT80 values of the 82 noncases in the case-control cohort calculated each day over the 80-week follow-up against each of the viruses (n = 19 IC80 < 1 µg ml–1; n = 10 IC80 1–3 µg ml–1; n = 35 IC80 > 3 µg ml–1) acquired by placebo recipients. On the y axis, each filled black dot is a point estimate of PE against viruses in the specified sensitivity category and vertical lines are 95% CI estimates as previously reported. The arrow indicates a value (−108.7) below the y-axis lower limit. On the x axis, each filled black dot is the median PT80 against viruses acquired by placebo recipients within each virus neutralization IC80 sensitivity category; horizontal rectangles extend through the interquartile range, and on each side of the boxplot is a kernel density estimation of the distribution shape of PT80.
Fig. 5
Fig. 5. PT80 values to autologous acquired viruses at HIV-1 acquisition among VRC01 arm cases, and to placebo recipient-acquired viruses among VRC01 arm noncases.
a, Violin plots for VRC01-recipient cases versus noncases, where approach 2 of Huang et al. was used to calculate PT80 at a given time point against a given virus. For each VRC01-recipient case, PT80 at the estimated date of HIV-1 acquisition (red dots) was calculated as the estimated VRC01 concentration at acquisition divided by the VRC01 drug product IC80 against the autologous virus. For each of the 82 sampled VRC01-recipient noncases, PT80 at each day of follow-up against each placebo recipient-acquired virus was calculated as the estimated VRC01 concentration divided by VRC01 drug product IC80 against the virus (blue dots). The lower bound, horizontal line and upper bound of the vertical rectangular boxplots show the 25th, 50th and 75th percentiles, respectively. On each side of the boxplot is a kernel density estimation of the distribution shape of PT80. b, By VRC01 dose arm and across dose arms pooled: geometric mean PT80 at HIV-1 acquisition in VRC01-recipient cases against the autologous acquired virus, geometric mean PT80 in VRC01-recipient noncases (their individual-specific medians over follow-up) to placebo recipient-acquired viruses, and their ratio. Error bars represent 95% CIs.
Fig. 6
Fig. 6. Neutralization coverage, geometric mean PT80 and PT80-predicted prevention efficacy over time against viruses circulating in each of the AMP trials for the bnAb regimen, delivered IV every 16 weeks and evaluated in study cohorts of the same size as in the AMP trials.
a,b, Neutralization coverage (defined by PT80 > 200) (averaged to viruses). c,d, geometric mean PT80. e,f, PT80-predicted prevention efficacy. ad, PGT121LS + PGDM1400LS + VRC07-523LS, 20 + 20 + 20 mg kg–1. e,f, PGT121LS + PGDM1400LS + VRC07-523LS, 40 +40 + 40 mg kg–1.a,c,e, HVTN 703/HPTN 081. b,d,f, HVTN 704/HPTN 085. a,b, Tables below each plot provide neutralization coverage averaged to viruses and averaged over the given time frame. Virus exposure was considered covered by 1-, 2- or 3-active bnAbs if the coverage threshold (PT80 > 200) was achieved by at least one, at least two or all three bnAbs, respectively. All predictions were made under the scenario that PGT121LS and PGDM1400LS have 2.5-fold higher half-lives than PGT121 and PGDM1400, based on modeling of the observed serum concentration data of PGT121 and PGDM1400 (refs. ,). For each bnAb regimen, geometric mean PT80 at each time point was calculated as the geometric mean of predicted serum concentration across bnAb recipients at each time point during steady state (simulated based on popPK modeling of each bnAb as described in Methods), divided by the geometric mean of bnAb drug product IC80 across viruses circulating in the designated AMP trial. The PT80 of the triple-bnAb regimen was calculated using the Bliss–Hill interaction model of individual bnAb PT80 titers. The viruses circulating in each trial were: a,c,e, m = 47 viruses acquired by n = 29 703/081 (sub-Saharan Africa) placebo recipients; b,d,f, m = 70 viruses acquired by n = 35 704/085 (Americas + Switzerland) placebo recipients. e,f, Solid line, median; shaded area, 95% prediction interval.
Extended Data Fig. 1
Extended Data Fig. 1. Estimated protection curves (calculated from logistic regression) by day-of-challenge predicted serum ID80 titer (PT80) against the challenge SHIV, shown by bnAb class and by challenge SHIV, in subsets of N = 274 non-human primates (NHPs) that received a single bnAb and underwent SHIV challenge.
Day-of-challenge PT80 was calculated as day-of-challenge bnAb concentration divided by IC80 against the challenge SHIV, where PT80 values < 2 were set to 1. Only neutralization titer data obtained by the TZM-bl target cell assay were included. The bnAb and SHIV challenge description of each subset is shown in the lower right legend. a) Only CD4 binding site-targeting bnAbs, separated by challenge SHIV; b) All bnAbs excluding MPER-targeting bnAbs, separated by challenge SHIV. The figure shows that the estimated protection curve for SF162P3 challenge is an outlier.
Extended Data Fig. 2
Extended Data Fig. 2. Estimated serum VRC01 concentration (filled black dot) at the estimated time of infection (median of the Bayesian posterior distribution of infection time) since last infusion in all primary endpoint HIV-1 cases, by randomization arm in each trial.
(a) HVTN 704/HPTN 085 (n = 36 cases in Control, n = 31 cases in the 10 mg/kg arm and n = 25 cases in the 30 mg/kg arm) with an additional 3 cases not shown in the 30 mg/kg panel due to estimated infection time > 10 weeks since last infusion, and 7 and 1 case(s) not shown in the Control and 10 mg/kg panels, respectively, due to estimated infection time ≤ 0 or not being available. (b) HVTN 703/HPTN 081 (n = 27 cases in Control, n = 28 cases in the 10 mg/kg arm and n = 17 cases in the 30 mg/kg arm) with an additional 2 and 2 cases not shown in the Control and 30 mg/kg panels, respectively, due to estimated infection time ≤ 0 or not being available. For each VRC01-recipient case, vertical error bars represent the 90% prediction interval around the estimated serum VRC01 concentration at the estimated infection time (center of the error bars), accounting for variabilities in both the estimation of the infection time and the estimation of concentration are displayed for each VRC01-recipient case. The former uncertainty is incorporated via resampling infection time from the Bayesian posterior distribution of infection time and the latter is incorporated via variabilities estimated based on the final popPK model for the daily grid concentrations at each given estimated infection time (see Methods). The solid black line represents the median and the shaded area represents bands covered by the 2.5th and 97.5th percentiles of the estimated concentrations over time within each dose group using the median body weight of participants in the case-control cohort, accounting for between-individual variabilities estimated based on the final popPK model.
Extended Data Fig. 3
Extended Data Fig. 3. Predicted serum ID80 titer (PT80)-predicted prevention efficacy over time in the context of viruses circulating in each of the AMP trials for the bnAb regimen PGDM1400LS + PGT121LS + VRC07-523LS at 20 + 20 + 20 mg/kg or 40 + 40 + 40 mg/kg, delivered intravenously every 24 weeks and evaluated in study cohorts of the same sizes as the AMP trials.
Solid line: median. Shaded area: 95% prediction interval. Predictions made under the scenario that PGT121LS and PGDM1400LS have 2.5-times higher half-lives as PGT121 and PGDM1400, using observed serum concentration data,. The viruses circulating in each trial are: (a) the m = 47 viruses acquired by n = 29 703/081 (Sub-Saharan Africa) placebo recipients; (b) the m = 70 viruses acquired by n = 35 704/085 (Americas + Switzerland) placebo recipients. The PT80 of the triple-bnAb regimen was calculated using the Bliss-Hill interaction model of the individual bnAb PT80 titers.
Extended Data Fig. 4
Extended Data Fig. 4. Agreement between predicted vs experimental serum neutralization ID50 titer.
Sera from samples from the last visit (and for a subset from the last two last visits) prior to the first positive HIV-1 RNA PCR test were assayed against autologous isolates from 64 VRC01 recipients who acquired HIV-1 infection (cases) (90 isolates, 164 titers). Predicted serum ID50 titer (PT50) values are plotted against the experimental ID50 for each sample and each isolate [Lin’s concordance correlation coefficient = 0.92 (95% CI 0.80 to 0.97)]. PT50 was calculated as popPK model-predicted concentration divided by IC50. Thirty-two of 164 experimental ID50 titers were below the limit of detection when the PT50 was greater than 10 (range 10.2 to 36.3). Zero of 164 experimental ID50 titers was at or above the limit of detection when the PT50 was less than 10. Dashed horizontal and vertical lines at a value of 10 show the experimental ID50 limit of detection; concordance of predicted vs. experimental values above vs. below 10 was 132 of 164 (80.5%).
Extended Data Fig. 5
Extended Data Fig. 5. Estimated prevention efficacy (PE) by predicted serum ID50 titer (PT50) to the autologous acquired virus in the AMP trials and in non-human primate (NHP) studies.
a) Estimated PE by PT50 to the acquired virus in AMP (black line), compared to the protection curve in three different sets of NHP (blue, mustard, and green lines). b) PT50 associated with 50% PE, 75% PE, and 90% PE, for the AMP trials and for each of the three sets of NHP. Set A: N = 274 NHPs that received a single bnAb followed by SHIV challenge, bnAb titer data from all neutralization assays; Set B: only the NHPs in Set A that received a CD4 binding site-targeting bnAb, excluding all that were challenged with SF162P3, and only including bnAb titer data from the TZM-bl target cell assay; and Set C: all NHPs in Set A, but excluding those that received an MPER-targeting bnAb and excluding all that were challenged with SF162P3, and only including bnAb titer data from the TZM-bl target cell assay.
Extended Data Fig. 6
Extended Data Fig. 6. Distributions of predicted serum ID50 titers (PT50s) against viruses acquired by placebo recipients, within each virus neutralization IC50 sensitivity category.
Distributions of predicted serum ID50 titers (PT50s) against viruses acquired by placebo recipients, within each virus neutralization IC50 sensitivity category. Approach 2 of Huang et al. was used to calculate PT50 against a given virus by dividing the population PK model-predicted VRC01 serum concentration by the IC80 of the VRC01 drug product against the virus. The distributions are for PT50s of the 82 non-cases in the case-control cohort calculated at each day over the 80-week follow-up against each of the viruses acquired by placebo recipients. On the y-axis, each filled black dot is a point estimate of prevention efficacy against viruses in the specified sensitivity category and the vertical lines are 95% confidence interval estimates as previously reported. The downward arrowhead indicates a value below the y-axis lower limit. On the x-axis, each filled black dot is the median PT50 against viruses acquired by placebo recipients, within each virus neutralization IC50 sensitivity category; the horizontal rectangles extend through the interquartile range and on each side of the boxplot is a kernel density estimation of the distribution shape of the PT50.
Extended Data Fig. 7
Extended Data Fig. 7. Predicted serum ID50 titers (PT50s) to autologous acquired viruses at HIV-1 acquisition among VRC01 arm cases, and to placebo-recipient acquired viruses among VRC01 arm non-cases.
(a) Violin plots for VRC01-recipient cases vs. non-cases, where Approach 2 of Huang et al. was used to calculate PT50 at a given time point against a given virus. For each VRC01-recipient case, PT50 at the estimated date of HIV-1 acquisition (red dots) was calculated as the estimated VRC01 concentration at acquisition divided by the VRC01 drug product IC50 against the autologous virus. For each of the 82 sampled VRC01-recipient non-cases, PT50 at each day of follow-up against each placebo-recipient acquired virus was calculated as the estimated VRC01 concentration divided by the VRC01 drug product IC50 against the virus (blue dots). The lower bound, horizontal line, and upper bound of the vertical rectangle boxplots show the 25th, 50th, and 75th percentiles, respectively. On each side of the boxplot is a kernel density estimation of the distribution shape of the PT50. (b) By VRC01 dose arm and across dose arms pooled: geometric mean PT50 at HIV-1 acquisition in VRC01-recipient cases against the autologous acquired virus, geometric mean PT50 in VRC01-recipient non-cases (their individual-specific medians over follow-up) to placebo-recipient acquired viruses, and their ratio. Error bars represent 95% confidence intervals.
Extended Data Fig. 8
Extended Data Fig. 8. (A, B) Neutralization coverage (defined by PT50 > 600) (averaged to viruses) and (C, D) geometric mean predicted serum ID50 (PT50) titer against viruses circulating in each of the AMP trials for the bnAb regimen PGT121LS + PGDM1400LS + VRC07-523LS 20 + 20 + 20 mg/kg delivered intravenously every 16 weeks and evaluated in study cohorts of the same sizes as the AMP trials.
In (A, B), the tables below each plot provide the neutralization coverage averaged to viruses and averaged over the given time frame. A virus exposure was considered covered by 1-active, 2-active, or 3-active bnAbs if the coverage threshold (PT50 > 600) is achieved by at least 1, at least 2, or all 3 bnAbs. All predictions were made under the scenario that PGT121LS and PGDM1400LS have 2.5-times higher half-lives as PGT121 and PGDM1400, based on modeling of observed serum concentration data of PGT121 and PGDM1400,. For each bnAb regimen, geometric mean PT50 at each time-point was calculated as the geometric mean of predicted serum concentration across bnAb recipients at each time-point during steady state (simulated based on population PK modeling of each bnAb as described in Methods) divided by the geometric mean of bnAb drug product IC50 across viruses circulating in the designated AMP trial, that is (a, c) the m = 47 viruses acquired by n = 29 703/081 (Sub-Saharan Africa) placebo recipients; (b, d) the m = 70 viruses acquired by n = 35 704/085 (Americas + Switzerland) placebo recipients. The PT50 of the triple-bnAb regimen was calculated using the Bliss-Hill interaction model of the individual bnAb PT50 titers.
Extended Data Fig. 9
Extended Data Fig. 9. Predicted serum ID50 titer (PT50)-predicted prevention efficacy over time in the context of viruses circulating in each of the AMP trials for the bnAb regimen PGDM1400LS + PGT121LS + VRC07-523LS at 20 + 20 + 20 mg/kg or 40 + 40 + 40 mg/kg, delivered intravenously every 16 weeks and evaluated in study cohorts of the same sizes as the AMP trials.
Solid line: median. Shaded area: 95% prediction interval. Predictions made under the scenario that PGT121LS and PGDM1400LS have 2.5-times higher half-lives as PGT121 and PGDM1400, using observed serum concentration data,. The viruses circulating in each trial are: (a) the m = 47 viruses acquired by n = 29 703/081 (Sub-Saharan Africa) placebo recipients; (b) the m = 70 viruses acquired by n = 35 704/085 (Americas + Switzerland) placebo recipients. The PT50 of the triple-bnAb regimen was calculated using the Bliss-Hill interaction model of the individual bnAb PT50 titers.

References

    1. Plotkin SA. Correlates of protection induced by vaccination. Clin. Vaccin. Immunol. 2010;17:1055–1065. doi: 10.1128/CVI.00131-10. - DOI - PMC - PubMed
    1. Bekker LG, et al. The complex challenges of HIV vaccine development require renewed and expanded global commitment. Lancet. 2020;395:384–388. doi: 10.1016/S0140-6736(19)32682-0. - DOI - PubMed
    1. Plotkin SA, Gilbert PB. Nomenclature for immune correlates of protection after vaccination. Clin. Infect. Dis. 2012;54:1615–1617. doi: 10.1093/cid/cis238. - DOI - PMC - PubMed
    1. Pegu A, et al. A meta-analysis of passive immunization studies shows that serum-neutralizing antibody titer associates with protection against SHIV challenge. Cell Host Microbe. 2019;26:336–346. doi: 10.1016/j.chom.2019.08.014. - DOI - PMC - PubMed
    1. Pauthner MG, et al. Vaccine-induced protection from homologous Tier 2 SHIV challenge in nonhuman primates depends on serum-neutralizing antibody titers. Immunity. 2019;50:241–252. doi: 10.1016/j.immuni.2018.11.011. - DOI - PMC - PubMed

Publication types