. 2022 Aug 22;5(1):852.
doi: 10.1038/s42003-022-03727-9.

Brainprints: identifying individuals from magnetoencephalograms

Affiliations

Brainprints: identifying individuals from magnetoencephalograms

Shenghao Wu et al. Commun Biol. .

Abstract

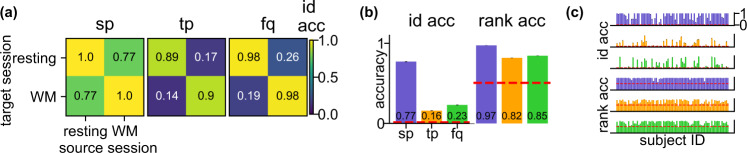
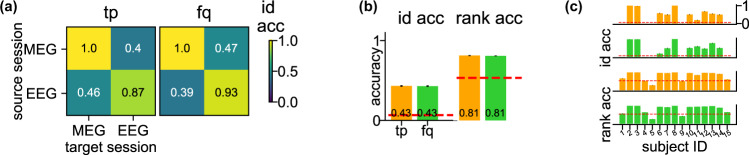
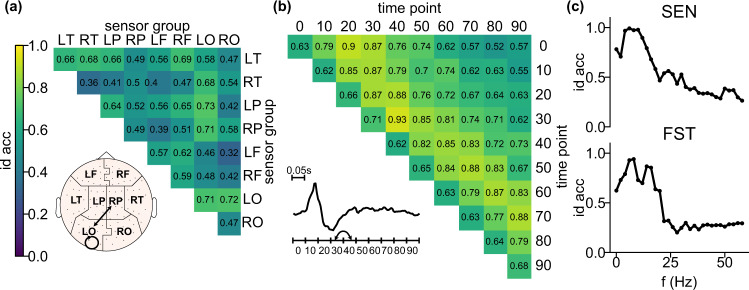
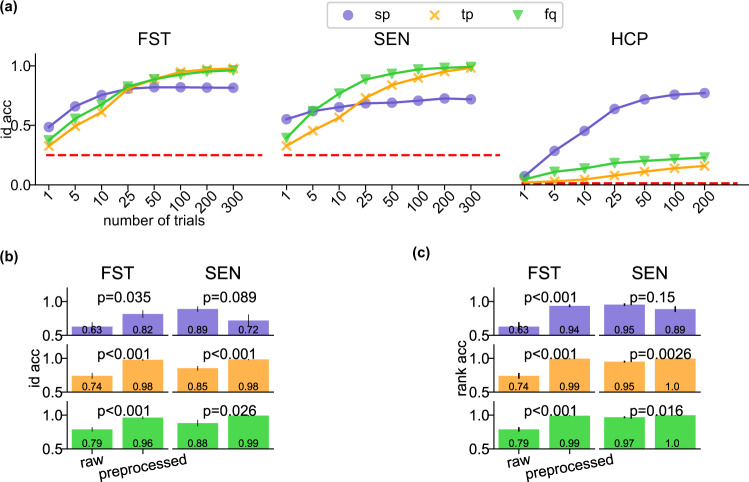
Magnetoencephalography (MEG) is used to study a wide variety of cognitive processes. Increasingly, researchers are adopting principles of open science and releasing their MEG data. While essential for reproducibility, sharing MEG data has unforeseen privacy risks. Individual differences may make a participant identifiable from their anonymized recordings. However, our ability to identify individuals based on these individual differences has not yet been assessed. Here, we propose interpretable MEG features to characterize individual difference. We term these features brainprints (brain fingerprints). We show through several datasets that brainprints accurately identify individuals across days, tasks, and even between MEG and Electroencephalography (EEG). Furthermore, we identify consistent brainprint components that are important for identification. We study the dependence of identifiability on the amount of data available. We also relate identifiability to the level of preprocessing and the experimental task. Our findings reveal specific aspects of individual variability in MEG. They also raise concerns about unregulated sharing of brain data, even if anonymized.


Conflict of interest statement

The authors declare no competing interests.

Figures

Fig. 1
Fig. 1. Individual identifiability is a function of individual and session variability in neuroimaging.
Consider repeating an experiment in multiple sessions for a group of individuals. Cross-session variability refers to the change in the recorded data for the same individual across sessions, while within-session variability refers to differences in a single session's recorded data across individuals (keeping all other variables, including the stimulus, unchanged). The ideal conditions for the scientific discovery of an effect shared by the group are low within-session and low cross-session variability. However, the combination of low within-session and high cross-session variability indicates an artifact or a confound in the experiment design (e.g., each month, one session is recorded for all individuals and the instrument has a drift over time). High within-session variability paired with low cross-session variability leads to individual identifiability with the individual's data acting like a stable signature that differentiates them from others. Finally, high within-session and cross-session variability lead to unreliable data.
Fig. 2
Fig. 2. Graphical abstract.
Identifying which subject a segment of MEG data belongs to is strikingly easy when other data from the same session is available for every subject. We propose three types of interpretable features that can also be used to identify individuals across sessions with high accuracy. Identifiability of individuals is influenced by factors such as resting state vs. task state, components of each feature, the sample size and the level of preprocessing. Our results reveal aspects of individual variability in MEG signals and highlight privacy risks associated with MEG data sharing.
Fig. 3
Fig. 3. High within-session identification accuracy on HP data with three interpretable features.
a Shape of the HP data before featurization. The HP data consists of participants reading a book chapter one word at a time for 0.5s each. The data are resampled to have the dimension [102 channels, 100 time points, n trials] where each trial corresponds to one word and n to the number of words. b The spatial correlation feature sp is a 102 × 102 Pearson's correlation coefficient matrix computed across the time points and trials. c The temporal correlation feature tp is a 100 × 100 Pearson's correlation matrix computed across the channels and trials. d The frequency feature fq is a vector in R51 where 51 is the number of frequency bands. The power at each band was averaged across channels and trials. e Identification accuracy with the three features. The accuracy was averaged across 100 identification runs of 8 individuals. The red dashed line represents the chance level (=0.125). The error bars are the standard errors across individuals and identification runs and are invisible since they are all zeros.
Fig. 4
Fig. 4. Cross-session identification on FST and SEN data confirms existence of brainprints.
a Schema of the cross-session identification task. For one identification run, the features of each individual are computed using randomly sampled trials (N = 300) from both the source and target session. Target session features are then classified by selecting the individual with the largest similarity score in the source session. b Heat maps of the cross-session identification accuracy using the three features on FST data. Each grid represents the average accuracy across 4 individuals and 100 identification runs. The within-session accuracy (diagonal entries) are computed using the same source-target splitting procedure as on the Harry Potter data to avoid data leakage. c Average cross-session identification accuracy and rank accuracy for each feature on FST data. Within-session accuracy (diagonal entries in b) were excluded in computation. Error bars are the SEs across cross-sessions (N = 12), individuals (N = 4), and identification runs (N = 100) and are invisible due to small values. Red dashed lines are the chance level for the identification accuracy (=0.25) and rank accuracy (=0.625). d Identification and rank accuracy on FST data by individual. Within-session accuracy were excluded in computation. Error bars are the SEs across cross-sessions (N = 12) and and identification runs (N = 100) and are invisible due to small values. The red dashed lines are the same as in (c). eg Same as (bd) but on SEN data with the same number of individuals and identification runs (N = 4 and N = 100) but different number of cross-sessions (N = 6). The high identification accuracy with the three features on multi-session datasets confirms these features can be brainprints for individual identification.
Fig. 5
Fig. 5. Consistent sp for cross-task identification on Human Connectome Project data.
a Heat maps of the cross-task identification accuracy using the three features on HP data. Both resting and working-memory (WM) data were recorded on the same day. For one identification run, the features of each individual were computed using randomly sampled trials (N = 200) from both the source and target session. Each grid represents the average accuracy across 77 individuals and 100 identification runs. The within-task accuracy (diagonal entries) were computed using the same source-target splitting procedure as on the Harry Potter data to avoid data leakage. b Average cross-task identification accuracy and rank accuracy for each feature on HCP data. Within-task accuracy (resting vs. resting, WM vs. WM) are excluded in computation. Error bars are the SEs across cross-task sessions (N = 2), individuals (N = 77), and identification runs (N = 100) and are invisible due to small values. The red dashed lines are the chance level for the identification accuracy (=177) and rank accuracy (=3977). c Identification (upper three rows) and rank (lower three rows) accuracy on HP data by individual. Within-task accuracy were excluded in computation. Error bars are the SEs across cross-task sessions (N = 2) and identification runs (N = 100) and are invisible due to small values. The red dashed lines are the same as in (b). These results indicate that sp is consistent even when performing different tasks (resting vs WM) in the source and target session.
Fig. 6
Fig. 6. Consistent tp and fq for cross-modality identification on MEG-EEG data.
a Heat maps of the cross-modality identification accuracy using the two features on MEG-EEG data. MEG and EEG data for the same individual were recorded on different days. For one identification run, the features of each individual were computed using randomly sampled trials (N = 200) from both the source and target session. Each grid represents the average accuracy across 15 individuals and 100 identification runs. The within-task accuracy (diagonal entries) was computed using the same source-target splitting procedure as on the Harry Potter data to avoid data leakage. b Average cross-modality identification accuracy and rank accuracy for each feature. Within-modality accuracy (MEG vs. MEG, EEG vs. EEG) were excluded in the computation. Error bars are the SEs across cross-modality sessions (N = 2), individuals (N = 15), and identification runs (N = 100) and are invisible due to small values. The red dashed lines are the chance level for the identification accuracy (=115) and rank accuracy (=1630). c Identification (upper two rows) and rank (lower two rows) accuracy on MEG-EEG data by individual. Within-modality accuracy is excluded in the computation. Error bars are the SEs across cross-modality sessions (N = 2) and identification runs (N = 100) and are invisible due to small values. The red dashed lines are the same as in (b). These results indicate that tp and fq are consistent even when different neuroimaging modalities were used in the source and target session.
Fig. 7
Fig. 7. Identification accuracy of components of the features.
See Supplementary Fig. 11 for (a, b) on FST data. a Identification accuracy of the sub-features of sp on SEN data. Each grid represents the identification accuracy using the corresponding entries of sp averaged across cross-sessions (N = 6), individuals (N = 4), and identification runs (N = 100). Inset is the plot of the sensor group layout and edges correspond to the sensor group pair with over 0.7 accuracy for both FST and SEN. The topomap was plotted using the python MNE package. b Identification accuracy of the sub-features of tp on SEN data. Each grid represents the identification accuracy using the corresponding entries of tp averaged across the same dimensions as in (a). Inset is an example MEG signal of one individual averaged across channels (N = 102) and trials (N = 1000). Arrows correspond to the entries of the heatmap with over 0.9 accuracy for both FST and SEN. c Identification accuracy of the sub-features of fq on SEN (upper plot) and FST (lower plot) data. Each dot represents the identification accuracy using the corresponding entries of tp averaged across cross-sessions (N = 6 for SEN and 12 for FST), individuals (N = 4), and identification runs (N = 100). Accuracy values of f larger than 60 Hz were truncated since the curve became flat. Error bars are SE across cross-sessions, individuals, and identification runs and are invisible due to small values. The curve peaks at f = 6 Hz for SEN and f = 8Hz for FST. The accuracy of some components of a feature is consistently higher than the rest on both datasets, indicating that some parts of a certain feature may be more important in identifying individuals.
Fig. 8
Fig. 8. Factors affecting identification accuracy.
a Identification accuracy with respect to the number of trials (sample size) used for the featurization of FST, SEN, and HCP data. Each dot represents the identification accuracy averaged across individuals, identification runs, and cross-sessions (or cross-task sessions) excluding the within-session or within-task results. Error bars are the SEs across the corresponding cross-sessions (or cross-task sessions), individuals, and identification runs of each dataset and are invisible due to small values. bc Identification (b) and rank (c) accuracy of the three features computed on raw and fully preprocessed FST and SEN data. The same color represents the same feature as in (a). For (b), the identification accuracy across sessions (N = 12 for FST, N = 6 for SEN) and individuals (N = 4) were averaged with respect to identification runs (N = 100) and were put into one vector (of N = 48 entries for FST and 24 entries for SEN) for each feature and level of preprocessing. The heights of the bar plots are the mean of the corresponding vector. A two-sided unpaired t-test was performed on the vectors of the same feature and dataset between the raw and preprocessed data. The p-values for all pairs are less than 0.05, except for the sp feature for SEN. For (c), the rank accuracy were put into one vector in the same way as in (b). The heights of the bar plots are the mean of the corresponding vector and the error bars are its SE A two-sided unpaired t-test was performed on the vectors of the same feature and dataset between the raw and preprocessed data. The p-values for all pairs are less than 0.05, except for the sp feature for SEN.

References

    1. Landrain T, Meyer M, Perez AM, Sussan R. Do-it-yourself biology: challenges and promises for an open science and technology movement. Syst. Synthetic Biology. 2013;7:115–126. doi: 10.1007/s11693-013-9116-4. - DOI - PMC - PubMed
    1. Gorgolewski, K., Esteban, O., Schaefer, G., Wandell, B. & Poldrack, R. Openneuro-a Free Online Platform for Sharing and Analysis of Neuroimaging Data 1677 (Organization for Human Brain Mapping, 2017).
    1. Sweeney L. Simple demographics often identify people uniquely. Health (San Francisco) 2000;671:1–34.
    1. Dunn HL. Record linkage. Am. J. Publ. Health Nations Health. 1946;36:1412–1416. doi: 10.2105/AJPH.36.12.1412. - DOI - PMC - PubMed
    1. Van Essen DC, et al. The Wu-minn human connectome project: an overview. Neuroimage. 2013;80:62–79. doi: 10.1016/j.neuroimage.2013.05.041. - DOI - PMC - PubMed

Publication types