. 2022 Aug;4(8):1071-1083.
doi: 10.1038/s42255-022-00617-6. Epub 2022 Aug 22.

GLP-1-mediated delivery of tesaglitazar improves obesity and glucose metabolism in male mice

Affiliations

GLP-1-mediated delivery of tesaglitazar improves obesity and glucose metabolism in male mice

Carmelo Quarta et al. Nat Metab. 2022 Aug.

Abstract

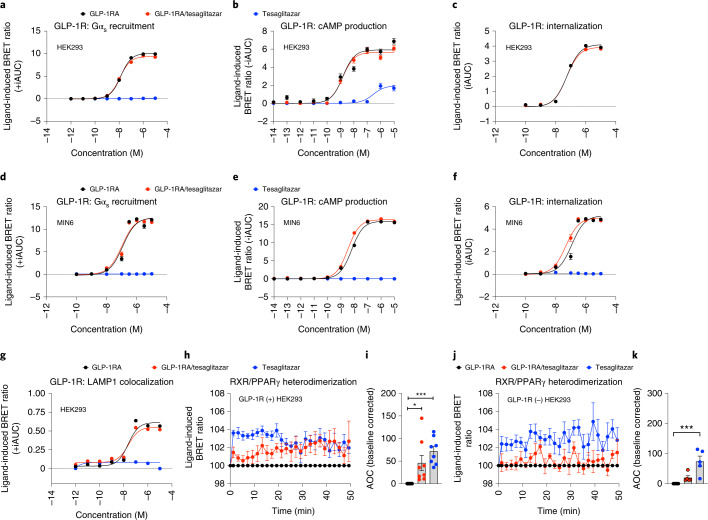
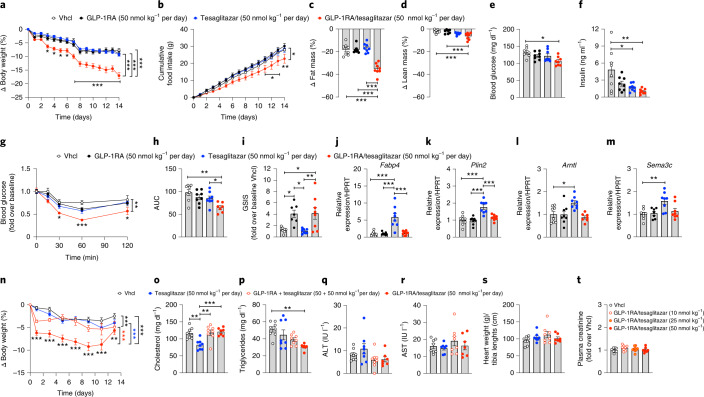
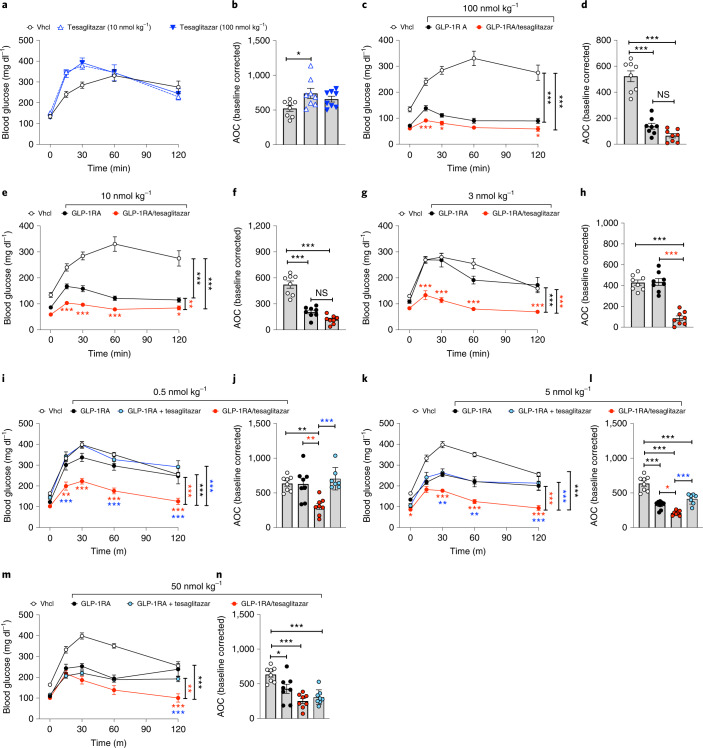
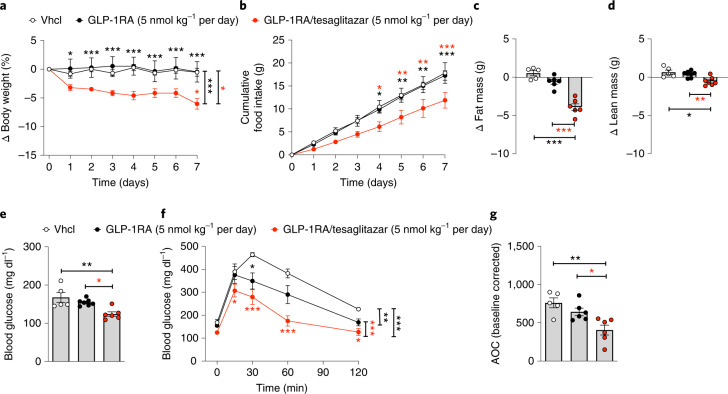
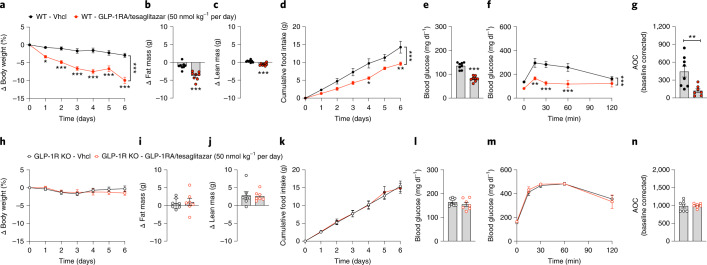
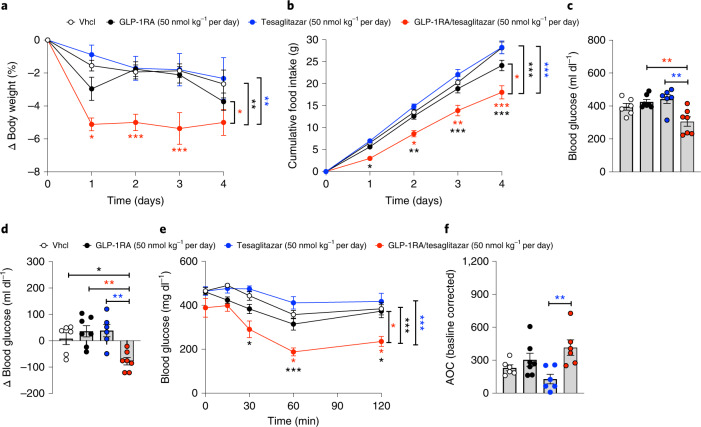
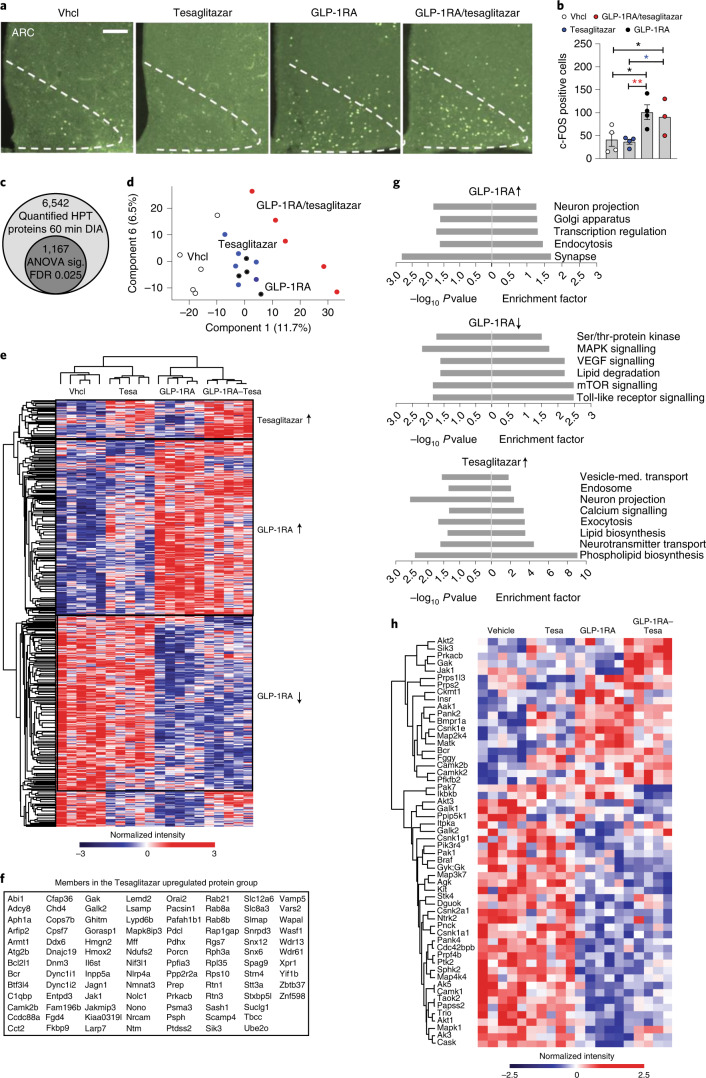
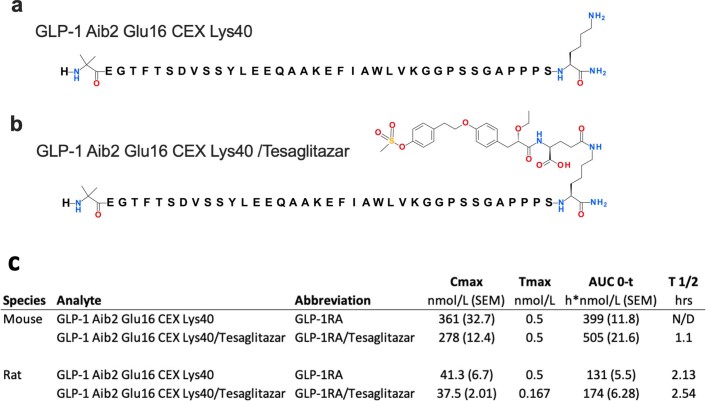
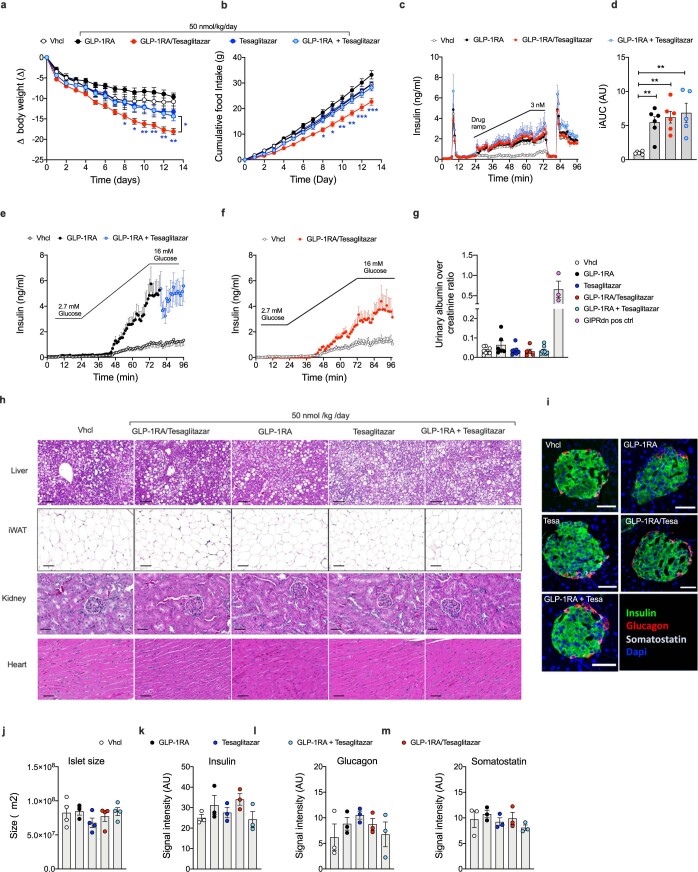
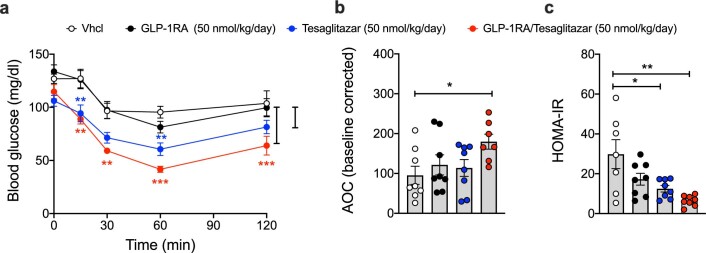
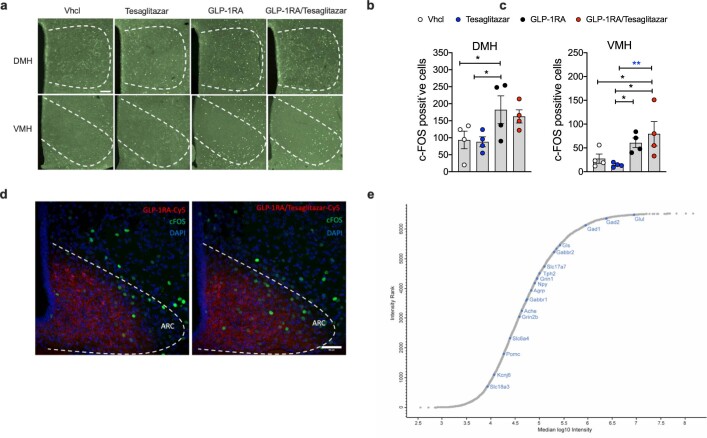
Dual agonists activating the peroxisome proliferator-activated receptors alpha and gamma (PPARɑ/ɣ) have beneficial effects on glucose and lipid metabolism in patients with type 2 diabetes, but their development was discontinued due to potential adverse effects. Here we report the design and preclinical evaluation of a molecule that covalently links the PPARɑ/ɣ dual-agonist tesaglitazar to a GLP-1 receptor agonist (GLP-1RA) to allow for GLP-1R-dependent cellular delivery of tesaglitazar. GLP-1RA/tesaglitazar does not differ from the pharmacokinetically matched GLP-1RA in GLP-1R signalling, but shows GLP-1R-dependent PPARɣ-retinoic acid receptor heterodimerization and enhanced improvements of body weight, food intake and glucose metabolism relative to the GLP-1RA or tesaglitazar alone in obese male mice. The conjugate fails to affect body weight and glucose metabolism in GLP-1R knockout mice and shows preserved effects in obese mice at subthreshold doses for the GLP-1RA and tesaglitazar. Liquid chromatography-mass spectrometry-based proteomics identified PPAR regulated proteins in the hypothalamus that are acutely upregulated by GLP-1RA/tesaglitazar. Our data show that GLP-1RA/tesaglitazar improves glucose control with superior efficacy to the GLP-1RA or tesaglitazar alone and suggest that this conjugate might hold therapeutic value to acutely treat hyperglycaemia and insulin resistance.


Conflict of interest statement

M.H.T. is a member of the scientific advisory board of ERX Pharmaceuticals. He was a member of the Research Cluster Advisory Panel (ReCAP) of the Novo Nordisk Foundation between 2017 and 2019. He attended a scientific advisory board meeting of the Novo Nordisk Foundation Center for Basic Metabolic Research, University of Copenhagen, in 2016. He received funding for his research projects by Novo Nordisk (2016–2020) and Sanofi-Aventis (2012–2019). He was a consultant for Bionorica SE (2013–2017), Menarini Ricerche S.p.A. (2016), and Bayer Pharma AG Berlin (2016). As former Director of the Helmholtz Diabetes Center and the Institute for Diabetes and Obesity at Helmholtz Zentrum München (2011–2018), and since 2018, as CEO of Helmholtz Zentrum München, he has been responsible for collaborations with a multitude of companies and institutions, worldwide. In this capacity, he discussed potential projects with and has signed/signs contracts for his institute(s) and for the staff for research funding and/or collaborations with industry and academia, worldwide, including but not limited to pharmaceutical corporations such as Boehringer Ingelheim, Eli Lilly, Novo Nordisk, Medigene, Arbormed, BioSyngen and others. In this role, he was/is further responsible for commercial technology transfer activities of his institute(s), including diabetes related patent portfolios of Helmholtz Zentrum München as, for example, WO/2016/188932 A2 or WO/2017/194499 A1. M.H.T. confirms that to the best of his knowledge none of the above funding sources were involved in the preparation of this paper. T.D.M. and K.S. receive research funding by Novo Nordisk. J.E.C. receives research funding from Novo Nordisk and Eli Lilly. D.J.D. has received speaking or consulting fees from Altimmune, Amgen, Eli Lilly, Kallyope, Merck, Novo Nordisk Inc. and Pfizer Inc. Mt. Sinai Hospital receives funding for preclinical studies in the Drucker laboratory from Novo Nordisk and Pfizer Inc. RDDiM is a coinventor on intellectual property owned by Indiana University and licensed to Novo Nordisk. He was previously employed by Novo Nordisk. B.F., B.Y., P.J.K., J.D. and B.D.B. are current employees of Novo Nordisk. The remaining authors declare no competing interests.

Figures

Fig. 1
Fig. 1. In vitro effects of GLP-1RA/tesaglitazar on GLP-1R signalling.
a,b, Dose responses for ligand-induced recruitment of Nluc-tagged Mini-Gαs to hGLP-1R-GFP (a) and cAMP production in hGLP-1R+ HEK293T cells (b). c, Dose responses for ligand-induced hGLP-1R-Rluc8 internalization as measured by loss of BRET with plasma membrane marker Venus-KRAS in HEK293T cells. df, Dose responses for ligand-induced hGLP-1R-GFP Mini-Gαs recruitment (d), cAMP production (e) and hGLP-1R-Rluc8 internalization (f) in the mouse β-cell MIN6 cells. g, Dose responses for ligand-induced hGLP-1R-Rluc8 co-localization with the terminal lysosome marker Lamp1-mNeonGreen in HEK293T cells. hk, Temporal resolution (h,j) and AOC (i,k) of ligand-induced (1 μM) RXR-Rluc8 and PPARγ2-YFP heterodimerization in hGLP-1R(+) HEK293T cells (h,i) and hGLP-1R(−) HEK293T cells (j,k). Data in a,c,d,g represent ± iAUC of n = 3 independent biological samples, each measured in an independent study with n = 4 technical replicates. Data in b,e,f represent ± iAUC of n = 4 independent biological samples, each measured in an independent study with n = 4 technical replicates. Data in h,i,j,k represent baseline-corrected temporal dynamics (h,j) and AOC (i,k) of n = 8 (h,i) or n = 5 (j,k) independent biological samples, each measured in an independent study with n = 4 technical replicates. Data were analysed using one-way ANOVA using the Bonferroni’s multiple comparison test. Date represent mean ± s.e.m.; asterisks indicate *P < 0.05; **P < 0.01 and ***P < 0.001. Exact P values for treatment effects are i, P = 0.0208 and P = 0.0005, k, P = 0.0008. Source data
Fig. 2
Fig. 2. Chronic high-dose effects of GLP-1RA/tesaglitazar in obese and lean mice.
ad, Effects on body weight (a), cumulative food intake (b) and change of fat (c) and lean tissue mass (d) in 34-week-old male C57BL/6J DIO mice treated for 14 days with 50 nmol kg−1 per day. e,f, Fasting levels of blood glucose (e) and insulin (f) at study day 7. g,h, i.p. insulin tolerance (ipITT) assessed at day 14: blood glucose (g) and AUC (h). i, In vivo glucose-stimulated insulin secretion (GSIS) in 47-week-old male DIO mice treated i.p. with 1.5 g glucose per kg body weight (blood was collected at time points 0 and 15 min after glucose injection) (i). jm, Expression of Fabp4 (j) and Plin2 (k) in liver and of Arntl (l) and Sema3c (m) in skeletal muscle of 30-week-old male DIO mice treated for 3 days with 50 nmol kg−1 per day. ns, Changes in body weight (n), plasma levels of cholesterol (o), triglycerides (p), aspartate-aminotransferase (q), alanine-transferase (r) as well as heart weight (s) in 16-week-old male lean C57BL/6J mice after 14 days treatment with 50 nmol kg−1 per day. t, Plasma levels of creatinine in 44-week-old male C57BL/6J DIO mice treated for 14 days with vehicle (Vhcl) or GLP-1RA/tesaglitazar at a dose of 10, 25 or 50 nmol kg−1 per day (n = 8 mice each group). Sample sizes for treatment with Vhcl, GLP-1RA, tesaglitazar or GLP-1RA/tesaglitazar (am) are n = 8/8/8/8 mice (a,d,f,j,k), n = 8/7/8/8 mice (c,i,m), n = 7/8/8/8 mice (e) and n = 8/8/8/7 mice (g,h,l). Cumulative food intake (b) was assessed per cage in n = 4/4/4/4 cages containing n = 8/8/8/8 mice. Sample sizes for treatment with Vhcl, tesaglitazar, GLP-1RA + tesaglitazar or GLP-1RA/tesaglitazar (ns) are n = 8/7/8/7 mice (n), n = 8/8/8/7 mice (oq,s) and n = 8/8/7/7 mice (r). Data represent means ± s.e.m. Data in a, b, g and n have been analysed by two-way ANOVA with Bonferroni post hoc comparison for individual time points. Data in cf, hm and ot have been analysed by one-way ANOVA using the Bonferroni’s multiple comparison test. Asterisks indicate *P < 0.05, **P < 0.01, ***P < 0.001. Exact P values for treatment effects are a all P ≤ 0.0001; b P = 0.043; c all P < 0.0001, d P = 0.0007 (versus Vhcl) and P = 0.0010 (versus GLP-1RA); e P = 0.0106; f P = 0.0216 and P = 0.0035; g P = 0.0064; h P = 0.0011 and P = 0.0359; i P = 0.024 (Vhcl versus GLP-1RA), P = 0.0143 (Vhcl versus GLP-1RA/tesaglitazar), P = 0.0125 (GLP-1RA versus GLP-1RA/tesaglitazar), P = 0.0072 (tesaglitazar versus GLP-1RA/tesaglitazar; j all P < 0.0001; k all P < 0.0001; l P = 0.0127; m P = 0.0032; n P = 0.0002 (GLP-1RA + tesaglitazar versus Vhcl), all other P < 0.0001; o P = 0.0012 (GLP-1RA + tesaglitazar versus Vhcl), P = 0.0008 (GLP-1RA/tesaglitazar versus tesaglitazar), P = 0.0020 (Vhcl versus tesaglitazar); p P = 0.0031. For exact P values at individual time points (a,b,g,n), see the data source file. Source data
Fig. 3
Fig. 3. Acute glycaemic effects of GLP-1RA/tesaglitazar in DIO mice.
ah, i.p. GTT in 34-week-old male naïve DIO mice 6 h after treatment with a single s.c. dose of tesaglitazar (10 (a) or 100 nmol kg−1 (b)), or with the GLP-1RA or GLP-1RA/tesaglitazar at a dose of 100 nmol kg−1 (c,d), 10 nmol kg−1 (e,f) or 3 nmol kg−1 (g,h). in, i.p. GTT in 27–29-week-old male DIO mice 6 h after single s.c. treatment at doses of 0.5 nmol kg−1 (i,j), 5 nmol kg−1 (k,l) or 50 nmol kg−1 (m,n). In ah, sample sizes are n = 8 mice each treatment group. In in, sample sizes for treatment with Vhcl, GLP-1RA, GLP-1RA + tesaglitazar and GLP-1RA/tesaglitazar are n = 8/8/8/7 mice (i,j,m,n), n = 8/8/8/8 mice (k) and n = 8/8/7/7 mice (l). Data represent means ± s.e.m. Data in a, c, e, g, I, k and m have been analysed by two-way ANOVA with Bonferroni post hoc comparison for individual time points. Data in b, d, f, h, j, l and n have been analysed by one-way ANOVA using Bonferroni’s multiple comparison test. Asterisks indicate *P < 0.05, **P < 0.01, ***P < 0.001. Black asterisks indicate comparison to Vhcl, red asterisks indicate comparison to GLP-1RA, blue asterisks indicate comparison to the GLP-1RA + tesaglitazar cotherapy. Exact P values for treatment effects are b P = 0.0199; c both P < 0.0001; d both P < 0.0001; e P = 0.0056, P < 0.0001 and P < 0.0001; f both P < 0.0001; g both P < 0.0001; h both P < 0.0001; i all P < 0.0001; j P = 0.0021 (black asterisks), P = 0.0027 (red asterisks), P = 0.0003 (blue asterisks); k P = 0.0011 (red asterisks), P < 0.0001 (blue asterisks) and P < 0.0001 (black asterisks); l P = 0.0388 (red asterisks), P = 0.0002 (blue asterisks), P < 0.0001 (Vhcl versus all other groups); m P = 0.0036 (red asterisks), P < 0.0001 (black asterisks); n P = 0.0229, P = 0.0002 (Vhcl versus GLP-1RA + tesaglitazar), P < 0.0001 (Vhcl versus GLP-1RA/tesaglitazar). For exact P values at individual time points (b,e,g,i,k,m), see the data source file. Source data
Fig. 4
Fig. 4. Chronic low-dose effects of GLP-1RA/tesaglitazar in DIO mice.
ad, Body weight (a), cumulative food intake (b) and change in fat (c) and lean tissue mass (d) of 36-week-old male C57BL/6J DIO mice treated for 7 days with either vehicle or 5 nmol kg−1 per day of either GLP-1 or GLP-1/tesaglitazar. eg, Fasting levels of blood glucose (e) and i.p. GTT (f,g). Sample sizes for treatment with Vhcl, GLP-1RA or GLP-1RA/tesaglitazar are n = 5/7/6 (ag). Cumulative food intake was assessed per cage in n = 3/4/3 cages containing n = 5/7/6 mice (d). Data in a,b and f have been analysed by two-way ANOVA with Bonferroni post hoc comparison for individual time points. Data in c, d, e and g have been analysed by one-way ANOVA using the Bonferroni’s multiple comparison test. Data represent means ± s.e.m.; asterisks indicate *P < 0.05, **P < 0.01, ***P < 0.001. Red asterisks indicate comparison to the GLP-1RA, black asterisks indicate comparison to Vhcl. Exact P values for treatment effects are: a P = 0.044 and P = 0.0007, c all P < 0.0001; d P = 0.0099 and P = 0.0284; e P = 0.0035 and P = 0.0242; f P = 0.0030, P = 0.0004 (red asterisks) and P < 00001 (black asterisks), g P = 0.0027 and P = 0.030. For exact P values at individual time points (a,b,f), see the data source file. Source data
Fig. 5
Fig. 5. GLP-1RA/tesaglitazar in obese GLP-1R knockout mice.
an, Body weight (a,h), change in fat and lean tissue mass (b,c,i,j), cumulative food intake (d,k), blood glucose (e,l) and i.p. GTT (f,m) in 36-week-old male DIO wildtype (WT) (ag) or GLP-1R knockout (KO) mice (hn) treated for 6 days with either vehicle or 50 nmol kg−1 per day of GLP-1RA/tesaglitazar. Sample sizes for treatment with Vhcl or GLP-1RA/tesaglitazar are n = 8/8 (ac,e,f), n = 8/7 (g) and n = 7/7 (hj,ln). Cumulative food intake was assessed per cage in n = 4/3 cages containing n = 8/8 mice (d) and n = 4/5 cages containing n = 7/7 mice (k). Data in a, d, f, h, k and m have been analysed by two-way ANOVA with Bonferroni post hoc comparison for individual time points. Data in b, c, e, g, i, j, l and n have been analysed by one-way ANOVA using Bonferroni’s multiple comparison test. Data represent means ± s.e.m.; asterisks indicate *P < 0.05, **P < 0.01, ***P < 0.001. Exact P values for treatment effects are: a,b,df, P < 0.0001; c, P = 0.0003; g, P = 0.0078. For exact P values at individual time points (a,d,f,h,k,m), see the data source file. Source data
Fig. 6
Fig. 6. GLP-1RA/tesaglitazar effects in obese db/db mice.
af, Body weight (a), cumulative food intake (b), plasma glucose (c), change in blood glucose (d) and glucose tolerance (e,f) in 6-week-old obese db/db mice treated for 4 days at a dose of 50 nmol kg−1 per day. Sample sizes for treatment with Vhcl, GLP-1RA, tesaglitazar or GLP-1RA/tesaglitazar are n = 6/7/6/7 (a,c,d) and n = 6/7/6/6 (e,f). Cumulative food intake was assessed per cage in n = 4/4/4/4 cages containing n = 6/7/6/7 mice (b). Data in a, b and e have been analysed by two-way ANOVA with Bonferroni post hoc comparison for individual time points. Data in c, d and f have been analysed by one-way ANOVA using the Bonferroni’s multiple comparison test. Data represent means ± s.e.m.; asterisks indicate *P < 0.05, **P < 0.01, ***P < 0.001. Black asterisks indicate comparison to Vhcl, red asterisks indicate comparison to GLP-1RA, blue asterisks indicate comparison to tesaglitazar. Exact P values for treatment effects are: a, P = 0.0353 (red asterisk), P = 0.0078 (black asterisks) and P = 0.0031 (blue asterisks); b, P = 0.0112 (red asterisk), P = 0.0007 (black asterisks) and P = 0.0002 (blue asterisks); c, P = 0.0062 (red asterisks) and P = 0.0025 (blue asterisks); d, P = 0.0409 (black asterisk), P = 0.0027 (red asterisks) and P = 0.0032 (blue asterisks); e, P = 0.0165 (red asterisk), P = 0.0009 (black asterisks) and P = 0.0002 (blue asterisks); f, P = 0.0075. For exact P values at individual time points (a,b,e), see the data source file. Source data
Fig. 7
Fig. 7. GLP-1RA/tesaglitazar effects on the hypothalamic proteome and cFOS.
a,b, Representative immunofluorescence (a) and quantification (b) of cFos positive neurons in the ARC of 47-week-old male DIO mice after single s.c. treatment with Vhcl or 150 nmol kg−1 of GLP-1RA, tesaglitazar or GLP-1RA/tesaglitazar (n = 4/4/4/3 mice; scale bar, 100 µm). ch, LC–MS analysis of acute drug effects on the hypothalamic proteome. c, Identified total number of quantified protein groups across all samples, as well as significantly changed number of proteins as determined by ANOVA (FDR < 0.025). d,e, PCA of proteomic samples (d) and heat map of z-scored protein intensities among all significantly changed proteins (e). f, List of proteins upregulated by tesaglitazar and by GLP-1/tesaglitazar. g,h, Selected gene annotations positively enriched in the specific treatment groups (g) and heat map of kinases significantly changed (ANOVA, FDR < 0.025) by the respective treatment groups (h). Proteins are grouped by hierarchical clustering, colouring represents z-scored protein intensities. Data in a and b were obtained after 90 min of drug exposure in n = 4/4/4/3 mice, data in ch were obtained after 10 h of drug exposure in 49-week-old C57BL6J DIO mice (n = 5 mice each group). Data in b were analysed by one-way ANOVA and Fisher’s least-significant difference test. Data represent means ± s.e.m.; asterisks indicate *P < 0.05, **P < 0.01. Exact P values for treatment effects are: b P = 0.0138 (Vhcl versus tesaglitazar), P = 0.0466 (Vhcl versus GLP-1RA/tesaglitazar), P = 0.0326 (GLP-1RA/tesaglitazar versus tesaglitazar) and P = 0.0093 (GLP-1RA versus tesaglitazar). Source data
Extended Data Fig. 1
Extended Data Fig. 1. Structure and pharmacokinetics of the GLP-1RA and the GLP-1RA/Tesaglitazar conjugate.
Chemical structures of the GLP-1RA (a) and the GLP-1RA/Tesaglitazar conjugate (b). Pharmacokinetic analysis of GLP-1RA and GLP-1RA/Tesaglitazar in 25–30-week-old male C57BL6/J mice (n = 4/4 mice) and 8–10-week-old male Sprague Dawley rats (n = 4/4 rats) (c). Abbreviations indicate half-life (T1/2), maximum plasma concentration (Cmax), time for maximal plasma concentration (Tmax) and area under the curve from zero to last valid measurable concentration-timepoint (AUC0-t). N/D not determinable. Data represent means ± SEM. Source data
Extended Data Fig. 2
Extended Data Fig. 2. Effects of GLP-1RA/Tesaglitazar relative to GLP-1RA + Tesaglitazar co-therapy.
Change in body weight (a) and food intake (b) of 47-wk old male DIO C57BL6/J mice treated daily s.c. with Vhcl (n = 8 mice) or 50 nmol/kg of either GLP-1RA (n = 7 mice), Tesaglitazar (n = 8 mice), GLP-1RA/Tesaglitazar (n = 8 mice) or GLP-1RA + Tesaglitazar (n = 8 mice). Cumulative food intake was assessed per cage in n = 4/4/4/4 cages containing n = 8/7/8/8 mice (b). Glucose-stimulated insulin secretion in islets isolated from n = 10 male 18-wk old C57BL6/J mice (Run 1) and n = 10 female 12-wk old C57BL/6 J mice (Run 2), and which were treated with either control, GLP-1RA, GLP-1/Tesaglitazar or GLP-1RA + Tesaglitazar (n = 6/6/6/5 biologically independent replicates) under dynamic drug concentrations up to 3 nM under glucose concentrations of 10 mM (c,d). Data in (c,d) represent combined results from the two independent runs. Islets were pooled and separated randomly between the treatment groups. After 4 min of low glucose (2.7 mM), levels of glucose were increased to 10 mM at t = 5 min. The peak at t = 10 min represents 1st phase insulin secretion, the peak at t = 80 min represents treatment with 2.7 mM glucose + 30 mM KCL (c,d). Glucose-stimulated insulin secretion in pooled islets isolated from 10–15-wk old male (n = 9) and female (n = 6) C57BL6/J mice treated with either control, GLP-1RA or GLP-1RA + Tesaglitazar (n = 9/6/6 biologically independent biological replicates) (e) or with control or GLP-1RA/Tesaglitazar (n = 9/6 independent biological replicates) (f) under dynamic glucose concentrations ranging from 2.7–16 mM at drug concentrations of 3 nM. Urinary albumin over creatinine ratio in 49-wk old male DIO C57BL6/J mice after 14 days of daily s.c. treatment with Vhcl or 50 nmol/kg of either GLP-1RA/Tesaglitazar, GLP-1RA, Tesaglitazar, GLP-1RA + Tesaglitazar (n = 8/5/6/7/8 mice) (g). Urinary samples of a mouse model for diabetic nephropathy (GIPRdn) (n = 3 mice) serves as positive control (g). Representative images of histopathological analysis of liver, iWAT, kidney and heart in 49-wk old male DIO C57BL6/J mice after 14 days of daily s.c. treatment with 50 nmol/kg (scale bar liver/iWAT: 100 µm, kidney/heart: 50 µm) (h). Representative confocal images of pancreatic sections obtained in 49-wk old male DIO C57BL6/J mice after 14 days of daily s.c. treatment with 50 nmol/kg and stained for different pancreatic hormones (scale bar 50 μm) (i). Pancreatic islet size (j) and hormone content between different groups (k-m) of 49-wk old male DIO C57BL6/J mice after 14 days of daily s.c. treatment with Vhcl or 50 nmol/kg of either GLP-1RA, Tesaglitazar, GLP-1RA + Tesglitazar or GLP-1RA/Tesaglitazar. Sample sizes are n = 4/3/4/4/4 mice (j) and n = 3/3/3/3 mice (k-m). Data in panel a and b have been analyzed by 2-way ANOVA using the Bonferroni’s multiple comparison test for individual time points. Data in panel d, g, and j-m have been analyzed by 1-way ANOVA with Bonferroni multiple comparison test. Data represent means ± SEM; asterisks indicate * p < 0.05, ** p < 0.01, *** p < 0.001. Blue asterisks in panel a and b indicate significance of GLP-1RA/Tesaglitazar over the fixed dose combination of the GLP-1RA + Tesaglitazar. Exact p-values for treatment effects are (a) p = 0.0105, (d) p = 0.0089 (Cntrl. vs. GLP-1RA), p = 0.0021 (Cntrl. vs. GLP-1RA/Tesaglitazar), p = 0.0011 (Cntrl. vs. GLP-1RA + Tesaglitazar). For exact p-values at individual time points (a,b) see data source file. Source data
Extended Data Fig. 3
Extended Data Fig. 3. Insulin sensitivity in DIO mice after treatment with GLP-1/Tesaglitazar.
Intraperitoneal insulin tolerance (ITT) (a), baseline-corrected area of curve (AOC) (b) and HOMA-IR (c) of male 34-wk old DIO mice treated for 14-days with Vhcl or 50 nmol/kg of either GLP-1RA, Tesaglitazar or GLP-1RA/Tesaglitazar. Sample sizes are n = 8/8/8/7 mice (a,b) and n = 7/8/8/8 mice (c). Data in (a) were analyzed by 2-way ANOVA with Bonferroni post-hoc comparison for individual time points. Data in (b,c) were analyzed by 1-way ANOVA with Bonferroni multiple comparison test. Data represent means ± SEM; asterisks indicate * p < 0.05, ** p < 0.01, *** p < 0.001. Red asterisks indicate significance of GLP-1RA/Tesaglitazar over Vhcl, blue asterisks indicate significance of Tesaglitazar over Vhcl. Exact p-values for treatment effects are (a) p = 0.0016 and p < 0.0001; (b) p = 0.0424; (c) p = 0.0193 and p = 0.0010. Source data
Extended Data Fig. 4
Extended Data Fig. 4. Acute drug effects on hypothalamic cFOS and neuronal marker.
Immunofluorescence (a) and quantification (b,c) of cFos positive neurons in the ventromedial hypothalamus (VMH) and dorsomedial hypothalamus (DMH) (n = 4 male 47-wk old C57BL/6 J mice each group, scale bar: 100 µm). Representative immunofluorescence image of Cyanine 5 (Cy5) labeled appearance of GLP-1RA and GLP-1RA/Tesaglitazar in the ARC of 49-wk old male C57BL/6 J DIO mice after 90 min of treatment with a single s.c. dose of 150 nmol/kg of either GLP-1RA-Cy5 or GLP-1RA/Tesaglitazar-Cy5 (n = 3/4 mice; scale bar: 50 µm) (d). Neuronal markers in the hypothalamic proteome (e). To illustrate the large dynamic range, quantified proteins across all hypothalamic samples were ranked and plotted according to their median Intensity. Marker proteins of different neuronal subtypes are highlighted in blue. Data in (b,c) were analyzed by 1-way ANOVA and Fisher’s LSD test. Data represent means ± SEM; asterisks indicate * p < 0.05, ** p < 0.01, *** p < 0.001. Exact p-values for treatment effects are (b) p = 0.0388 (Vhcl vs. GLP-1RA) and p = 0.0299 (Tesaglitazar vs. GLP-1RA); (c) p = 0.0269 (Vhcl vs. GLP-1RA/Tesaglitazar), p = 0.0446 (GLP-1RA vs. Tesaglitazar) and p = 0.0082 (GLP-1RA vs. GLP-1RA/Tesaglitazar). Source data

Comment in

References

    1. Fievet C, Fruchart JC, Staels B. PPARalpha and PPARgamma dual agonists for the treatment of type 2 diabetes and the metabolic syndrome. Curr. Opin. Pharmacol. 2006;6:606–614. doi: 10.1016/j.coph.2006.06.009. - DOI - PubMed
    1. Montaigne D, Butruille L, Staels B. PPAR control of metabolism and cardiovascular functions. Nat. Rev. Cardiol. 2021 doi: 10.1038/s41569-021-00569-6. - DOI - PubMed
    1. Frick MH, et al. Helsinki Heart Study: primary-prevention trial with gemfibrozil in middle-aged men with dyslipidemia. Safety of treatment, changes in risk factors, and incidence of coronary heart disease. N. Engl. J. Med. 1987;317:1237–1245. doi: 10.1056/NEJM198711123172001. - DOI - PubMed
    1. Gross B, Pawlak M, Lefebvre P, Staels B. PPARs in obesity-induced T2DM, dyslipidaemia and NAFLD. Nat. Rev. Endocrinol. 2017;13:36–49. doi: 10.1038/nrendo.2016.135. - DOI - PubMed
    1. Sarruf DA, et al. Expression of peroxisome proliferator-activated receptor-gamma in key neuronal subsets regulating glucose metabolism and energy homeostasis. Endocrinology. 2009;150:707–712. doi: 10.1210/en.2008-0899. - DOI - PMC - PubMed

Publication types

Grants and funding