. 2022 Aug;4(8):1007-1021.
doi: 10.1038/s42255-022-00620-x. Epub 2022 Aug 22.

BMP4 and Gremlin 1 regulate hepatic cell senescence during clinical progression of NAFLD/NASH

Affiliations

BMP4 and Gremlin 1 regulate hepatic cell senescence during clinical progression of NAFLD/NASH

Ritesh K Baboota et al. Nat Metab. 2022 Aug.

Abstract

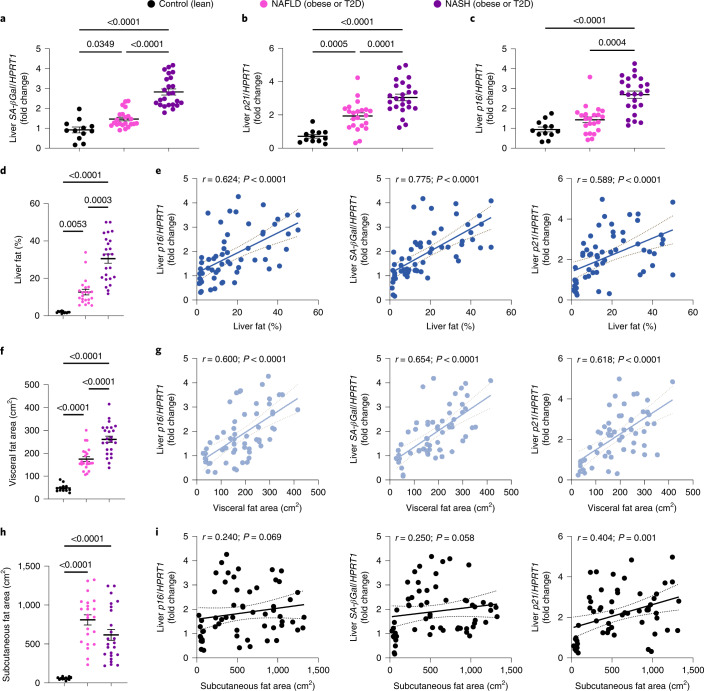
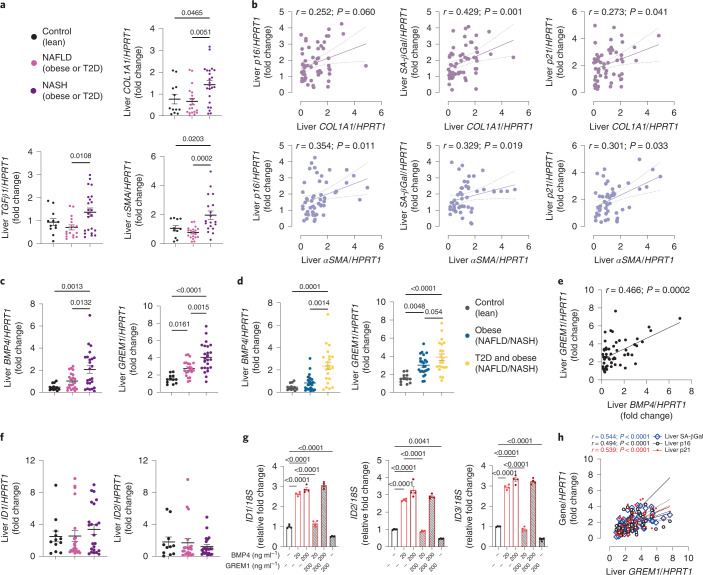
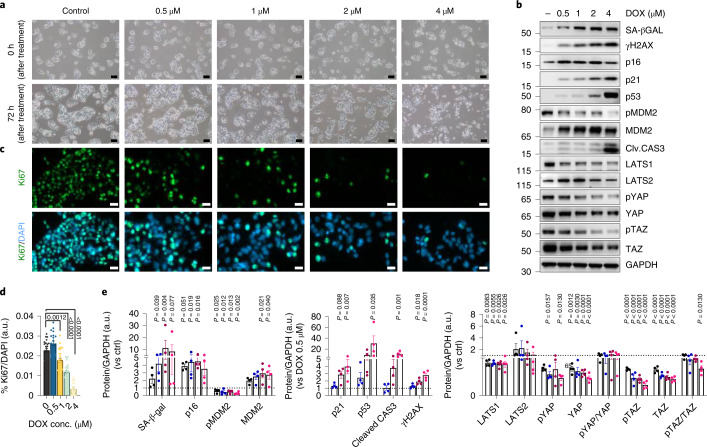
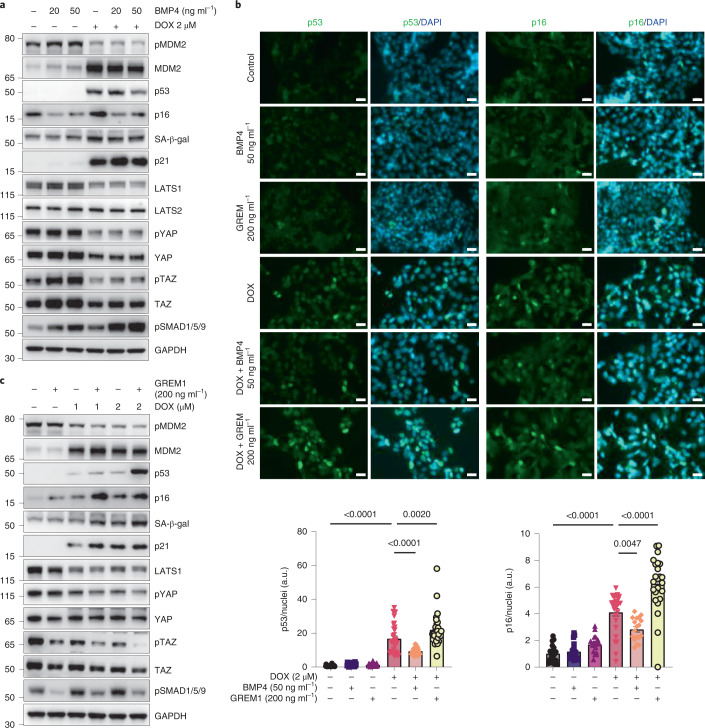
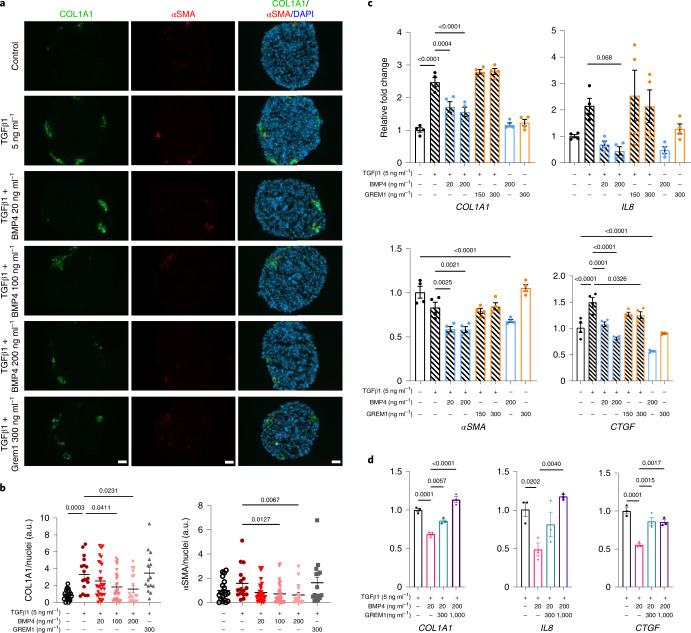
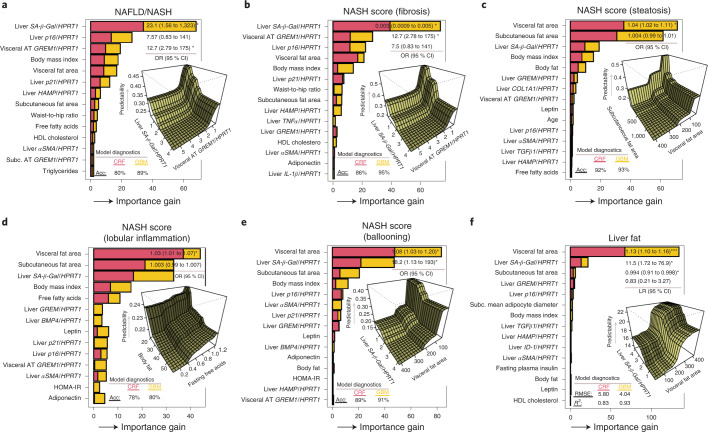
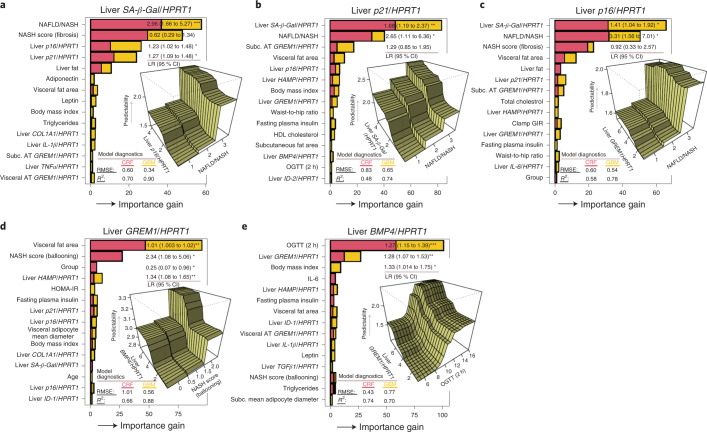
The role of hepatic cell senescence in human non-alcoholic fatty liver disease (NAFLD) and non-alcoholic steatohepatitis (NASH) is not well understood. To examine this, we performed liver biopsies and extensive characterization of 58 individuals with or without NAFLD/NASH. Here, we show that hepatic cell senescence is strongly related to NAFLD/NASH severity, and machine learning analysis identified senescence markers, the BMP4 inhibitor Gremlin 1 in liver and visceral fat, and the amount of visceral adipose tissue as strong predictors. Studies in liver cell spheroids made from human stellate and hepatocyte cells show BMP4 to be anti-senescent, anti-steatotic, anti-inflammatory and anti-fibrotic, whereas Gremlin 1, which is particularly highly expressed in visceral fat in humans, is pro-senescent and antagonistic to BMP4. Both senescence and anti-senescence factors target the YAP/TAZ pathway, making this a likely regulator of senescence and its effects. We conclude that senescence is an important driver of human NAFLD/NASH and that BMP4 and Gremlin 1 are novel therapeutic targets.


Conflict of interest statement

The authors declare no competing interests.

Figures

Fig. 1
Fig. 1. Elevated levels of hepatic senescence markers are associated with liver fat and visceral adipose tissue.
ac, RT–qPCR analysis to assess the expression levels of SA-β-Gal (a), p21 (b) and p16 (c) in lean individuals, patients with NAFLD and patients with NASH. d,e, Amount of liver fat (%) in lean individuals, patients with NAFLD and patients with NASH (d) and its correlation with mRNA levels of hepatic senescence markers (e). f,h, Amount of visceral (f) and subcutaneous (h) fat area in lean individuals, patients with NAFLD and patients with NASH. g,i, Correlation comparisons between mRNA levels of hepatic senescence markers and visceral fat area (g) or subcutaneous fat area (i). Data were collected in lean participants (n = 12), patients with NAFLD (n = 22) and patients with NASH (n = 24). Associations were determined using Pearson or Spearman correlation analysis. Values are mean ± s.e.m. Statistical significance was determined by one-way ANOVA with post hoc Tukey’s test or Kruskal–Wallis with post hoc Dunn’s test. Source data
Fig. 2
Fig. 2. Hepatic senescence markers are associated with inflammation and hepatic fibrosis.
a,c, Circulating levels of IL-6 and adiponectin (a), and RT–qPCR analysis of hepatic inflammatory markers IL-1β and IL-6 (c) in lean individuals, patients with NAFLD and patients with NASH. b,d,eh, Correlation comparisons of mRNA levels of hepatic senescence markers with IL-1β (b) and IL-6 (d) mRNA levels, and with parameters of histological grading: steatosis score (e), ballooning score (f), lobular inflammation score (g) and fibrotic score (h). Data were collected in lean participants (n = 11–12), patients with NAFLD (n = 21–22) and patients with NASH (n = 22–24). Associations were determined using Pearson or Spearman correlation analysis. Values are mean ± s.e.m. Statistical significance was determined using Kruskal–Wallis with post hoc Dunn’s test. Source data
Fig. 3
Fig. 3. Hepatic senescence markers are associated with hepatic fibrosis.
a, RT–qPCR analysis of hepatic fibrosis markers (TGFβ1, COL1A1 and αSMA) in lean individuals, patients with NAFLD and patients with NASH. b, Correlation comparisons between hepatic senescence markers and COL1A1 or αSMA mRNA levels. c, RT–qPCR analysis of hepatic BMP4 and GREM1 mRNA levels in lean individuals, patients with NAFLD and patients with NASH. d, RT–qPCR analysis of hepatic mRNA expression of BMP4 and GREM1 in lean (n = 12), obese (n = 24) and diabetic–obese (n = 22) individuals. e, Correlation between hepatic BMP4 and GREM1 mRNA levels. f, RT–qPCR analysis of hepatic ID1 and ID2 mRNA expression in lean individuals, patients with NAFLD and patients with NASH. g, RT–qPCR analysis of ID1, ID2 and ID3 mRNA levels in IHH cells including the effect of BMP4, in the presence or absence of GREM1, on expression of these genes (n = 4 biologically independent experiments). h, Correlation comparison between mRNA levels of hepatic GREM1 and senescence markers. Data were collected in lean participants (n = 11–12), patients with NAFLD (n = 17–22) and patients with NASH (n = 19–24). Associations were determined using Spearman correlation analysis. Values are mean ± s.e.m. Statistical significance was determined by one-way ANOVA with post hoc Tukey’s test or Kruskal–Wallis with post hoc Dunn’s test. Source data
Fig. 4
Fig. 4. DOX-induced senescence in IHH cells.
a, Representative images (bright-field) of IHH cells treated with different concentrations of DOX for 72 h (n = 3 biologically independent experiments). Scale bars represent 100 µm. b, Representative immunoblots of respective proteins in control and DOX-treated cells after 72 h (n = 4 biologically independent experiments). c, Representative immunofluorescence images of control and DOX-treated cells stained for Ki67 (green) and nuclei (DAPI, blue) (n = 3 biologically independent experiments). Scale bars represent 20 µm. d, Bar graphs showing Ki67 positivity in control and DOX-treated hepatocytes (n = 3, 7–10 randomly chosen fields from each experiment). e, Bar graphs showing the relative protein levels of senescence markers, as well as markers of the YAP/TAZ pathway, in control and DOX-treated cells, normalized to GAPDH (n = 4 biologically independent experiments). Values are mean ± s.e.m. Statistics were calculated using one-way ANOVA followed by Dunnett’s post hoc test or Kruskal–Wallis with post hoc Dunn’s test. a.u., arbitrary unit. Source data
Fig. 5
Fig. 5. BMP4 prevents the increase in DOX-induced senescence markers, whereas GREM1 enhances the effects of DOX.
a,c, Representative immunoblots of respective proteins in control and DOX-treated cells stimulated with or without BMP4 (20 ng ml−1 and 50 ng ml−1) (a) or GREM1 (200 ng ml−1) (c) (n = 6 or 7 biologically independent experiments, except for LATS2 (n = 5) and pSMA1/5/9 (n = 4)). b, Representative immunofluorescent images of control and DOX-treated cells, stimulated with or without BMP4 or GREM1, stained for p53 (green), p16 (green) and nuclei (DAPI, blue). Scale bars represent 20 µm. Bar graph displays fluorescence intensities quantified using ImageJ and normalized to the number of nuclei (n = 3, 6–10 randomly chosen fields from each experiment). Values are mean ± s.e.m. Statistics were calculated using one-way ANOVA followed by Bonferroni’s post hoc test. Source data
Fig. 6
Fig. 6. BMP4 reduced liver fibrogenic and inflammatory markers in TGF-β1-induced 3D spheroids.
a, Representative immunofluorescence images of 3D spheroids (IHH/LX-2, 24:1), treated with TGF-β1 in presence or absence of BMP4 or GREM1 for 48 h, stained for COL1A1 (green), αSMA (red) and nuclei (DAPI, blue). Scale bars represent 50 µm. b, Bar graph displays fluorescence intensities of COL1A1 and αSMA quantified using ImageJ and normalized to the number of nuclei (n = 15–30 spheroids from three different experiments). c, RT–qPCR analysis of COL1A1, αSMA, IL-8 and CTGF in 3D spheroids, treated with TGF-β1 in presence or absence of BMP4 (n = 4 biologically independent experiments). d, RT–qPCR analysis of IL-8, CTGF and COL1A1 in TGF-β1-treated 3D spheroids, stimulated with BMP4 in presence or absence of GREM1 (n = 3 biologically independent experiments). Values are mean ± s.e.m. Statistical significance was determined using one-way ANOVA followed by Bonferroni post hoc test or Kruskal–Wallis with post hoc Dunn’s test. Source data
Fig. 7
Fig. 7. Strength of association of selected predictors for features of NAFLD/NASH and liver fat in patients with NAFLD/NASH.
af, Relative feature importance for NAFLD/NASH features (including steatosis, ballooning, inflammation and fibrosis score) and liver fat using predictive machine learning models such as conditional random forest, gradient boosting models and partial dependence plots. Predictors that display a pronounced increase in relative importance are considered strong predictors for the outcome. Model diagnostics (that is, R2 and r.m.s.e.) for predictive machine learning models are presented in each panel. Partial dependence plots were used to investigate interaction effects between important features. To assess significance level and estimate risk association for important features, according to machine learning models, we subsequently constructed either a linear or logistic regression model and included the most important features. AT, adipose tissue.
Fig. 8
Fig. 8. Strength of association of selected predictors for senescence markers and GREM1 and BMP4 mRNA levels in patients with NAFLD/NASH.
ae, Relative feature importance for senescence markers and GREM1 and BMP4 mRNA, using conditional random forest and gradient boosting model diagnostics, is presented in each panel. Predictors that display a pronounced increased in importance compared with other predictors are strong predictors for the outcome. Partial dependence plots are included to display interaction effects between features with strong predictability for the outcome.
Extended Data Fig. 1
Extended Data Fig. 1. Hepatic senescence markers are associated with insulin resistance.
(a) Adipo-IR index in lean, NAFLD, and NASH individuals. (b) Correlation comparisons of Adipo-IR with hepatic senescence markers. (c) RT-qPCR analysis of hepatic senescence markers including p16, p21, and SA-β-Gal, in T2D individuals compared to non-diabetic individuals within lean, NAFLD, and NASH individuals. (d, f, h) Measurement of FPI (d), FPG (f), and GIR (h) in lean, NAFLD, and NASH individuals. (e, g, i) Correlation comparisons of mRNA levels of hepatic senescence markers with FPI (e), FPG (g), and GIR (i). Data were collected in lean subjects (n = 12), NAFLD subjects (n = 22), and NASH subjects (n = 24). Associations were determined using Spearman correlation analysis. Values are mean ± SEM. Statistical significance was determined by one-way ANOVA with post-hoc Tukey’s test or Kruskal-Wallis with post-hoc Dunn’s test. FPI, Fasting plasma insulin; FPG, fasting plasma glucose; GIR, glucose infusion rate. Source data
Extended Data Fig. 2
Extended Data Fig. 2. Doxorubicin-induced senescence in IHH cells.
(a) Brightfield microscopy images of control and DOX-treated cells assayed for SA-β-Gal (blue). Scale bar represents 100 µm. (b-d) Representative immunofluorescence images of control and DOX-treated cells stained for p53 (green) (b), p21 (green) (c), γH2AX (green) (d), and nuclei (DAPI, blue). Scale bar represents 20 µm. (e) Bar graph displays fluorescence intensities quantified using ImageJ and normalized to number of nuclei (n = 3, 6-10 randomly chosen fields from each experiment). (f) After 48 h, DOX-treated IHH cells were stimulated with OA for 24 h. Cells were stained for lipid droplet accumulation (ORO, red) and nuclei (DAPI). Scale bar represents 100 µm. (g) Intracellular lipid accumulation was quantified by spectrophotometry and normalized to number of nuclei (n = 3). (h) RT-qPCR analysis of genes involved in lipid metabolism in DOX-treated cells (n = 4). (i) Representative transmission electron micrographs of control and DOX-treated hepatocytes. Scale bar represents 1 μm. (n = 3 biologically independent experiments). (j) Representative fluorescence images of control and DOX-treated cells stained with Mitotracker Red dye (mitochondria, red), which detects mitochondrial polarization status. Scale bar represents 20 μm. Bar graph displays fluorescence intensities of Mitotracker Red, normalized to number of nuclei (n = 3, 6-10 randomly chosen fields from each experiment). Values are mean ± SEM. Statistics: 2-tailed, Unpaired t-test for (e) (p21 & γH2AX), Mann-Whitney test for (e, j) (p53 & Mitotracker), and one-way ANOVA followed by Bonferroni’s/Dunnett’s post-hoc test or Kruskal-Wallis with post-hoc Dunn’s test (g, h). Black arrows indicate normal mitochondria and red arrows indicate mitochondria with disrupted cristae. a.u., arbitrary unit. Source data
Extended Data Fig. 3
Extended Data Fig. 3. Effects of BMP4 in DOX-treated IHH cells.
(a) RT-qPCR analysis of genes involved in the YAP/TAZ pathway and inflammation in control and DOX-treated cells, stimulated with or without BMP4 (n = 4). (b) Representative immunoblots of proteins (p53, p21, and MDM2), and their quantification by densitometry (bar graphs) in siRNA-transfected IHH cells. (c-e) Bar graphs showing expression of respective proteins in control cells (with or without BMP4, n = 6) (c) and DOX-treated cells (with or without BMP4, n = 4) (d, e). Values are mean ± SEM. Statistics: One-way ANOVA followed by Bonferroni’s/Dunnett’s post-hoc test or Kruskal-Wallis with post-hoc Dunn’s test for (a, c, e), 2-tailed paired t-test for (b, d). a.u., arbitrary unit. Source data
Extended Data Fig. 4
Extended Data Fig. 4. Effects of GREM1 in DOX-treated IHH cells.
(a) Quantification of cell viability of non-senescent and induced senescent cells (preadipocytes, HUVECs, and astrocytes) incubated with increasing concentrations of BMP4 (n = 5). (b) Bar graphs showing expression of respective proteins in control cells (with or without GREM1, n = 4), DOX (1 µM)-treated cells (with or without GREM1, n = 4), and DOX (2 µM)-treated cells (with or without GREM1, n = 4) (h). (c) RT-qPCR analysis of respective genes involved in the YAP/TAZ pathway and inflammation in control and DOX-treated cells, stimulated with or without GREM1 (n = 4). Values are mean ± SEM. Statistics were calculated using Mann-Whitney test for (b) and one way ANOVA followed by Bonferroni’s post-hoc test or Kruskal-Wallis with post-hoc Dunn’s test for (c). a.u., arbitrary unit. Source data
Extended Data Fig. 5
Extended Data Fig. 5. Effects of BMP4 in cocktail-induced 3D spheroids.
(a, b) Representative immunofluorescence images of 3D spheroids (IHH/LX-2, 24:1) treated with cocktail (oleic acid (200 µM) + TGFβ1 (5 ng/ml) + TNFα (0.2 nM)) in presence or absence of BMP4/GREM1 for 48 h, stained for ORO (red) (a), COL1A1 (green) (b), and nuclei (DAPI, blue). Scale bar represents 50 µm. (c, d) Bar graph displays fluorescence intensities of ORO (c) and COL1A1 (d) quantified using ImageJ and normalized to number of nuclei (n = 20-30 spheroids from 3 different experiments). Values are means ± SEM. Statistical significance was determined using Kruskal-Wallis with post-hoc Dunn’s test. a.u., arbitrary unit. Source data
Extended Data Fig. 6
Extended Data Fig. 6. BMP4 inhibits the expression of pro-inflammatory markers.
(a) RT-qPCR analysis of CCL2, IL8, IL6, and IL-1β in LX2 cells treated with conditioned medium (50%; v/v) from control or DOX-treated IHH cells. (b) Bar graph displays BMP4 per se effects on mRNA levels of inflammatory genes (CCL2, IL-6, and IL-1β) (n = 3). (c) Quantification of IL-1β secretion in supernatant of LX2 cells treated with TNFα in presence or absence of BMP4 (n = 3). (d-f) RT-qPCR analysis of inflammatory genes (CCL2, IL-6, and IL-1β) in LX2 cells treated with TNFα (d), Etoposide (e), or DOX (f) in presence or absence of BMP4 for 48 h. Values are as mean ± SEM. Statistics: Statistical significance was determined using 2-tailed unpaired t-test for (a, f) and one-way ANOVA followed by Bonferroni’s post-hoc test for (b-e, g, h). a.u., arbitrary unit. Source data
Extended Data Fig. 7
Extended Data Fig. 7. RNA-seq analysis of GREM1-treated IHH cells.
(a) Principal component analysis representing RNA-seq expression data from all biological replicates. (b) RNA-seq was performed in IHH cells treated with GREM1 for 24 h (n = 4) and subsequently, KEGG pathway analysis was performed on DEGs with p < 0.05 and is represented as upregulated and downregulated pathways. (c) List of genes involved in TGF beta signaling pathway. Significant genes with padj<0.0001 and p < 0.0001 are included in the list. (d) RT-qPCR validation of RNA-seq data for HAMP gene, including the effect of BMP4, in presence or absence of GREM1, on the mRNA level of these target genes (n = 4). Values are mean ± SEM. Statistical significance was determined using one-way ANOVA followed by Bonferroni post-hoc test. Source data

References

    1. Godoy-Matos AF, Silva Júnior WS, Valerio CM. NAFLD as a continuum: from obesity to metabolic syndrome and diabetes. Diabetol. Metab. Syndr. 2020;12:60. doi: 10.1186/s13098-020-00570-y. - DOI - PMC - PubMed
    1. Younossi ZM, et al. Global epidemiology of nonalcoholic fatty liver disease—meta-analytic assessment of prevalence, incidence, and outcomes. Hepatology. 2016;64:73–84. doi: 10.1002/hep.28431. - DOI - PubMed
    1. Friedman SL, Neuschwander-Tetri BA, Rinella M, Sanyal AJ. Mechanisms of NAFLD development and therapeutic strategies. Nat. Med. 2018;24:908–922. doi: 10.1038/s41591-018-0104-9. - DOI - PMC - PubMed
    1. Aravinthan A, et al. Hepatocyte senescence predicts progression in non-alcohol-related fatty liver disease. J. Hepatol. 2013;58:549–556. doi: 10.1016/j.jhep.2012.10.031. - DOI - PubMed
    1. Wiemann SU, et al. Hepatocyte telomere shortening and senescence are general markers of human liver cirrhosis. FASEB J. 2002;16:935–942. doi: 10.1096/fj.01-0977com. - DOI - PubMed

Publication types

MeSH terms

Substances