. 2022 Aug 12:2022:8122532.
doi: 10.1155/2022/8122532. eCollection 2022.

Identification and Experimental Validation of Marker Genes between Diabetes and Alzheimer's Disease

Affiliations

Identification and Experimental Validation of Marker Genes between Diabetes and Alzheimer's Disease

Cheng Huang et al. Oxid Med Cell Longev. .

Abstract

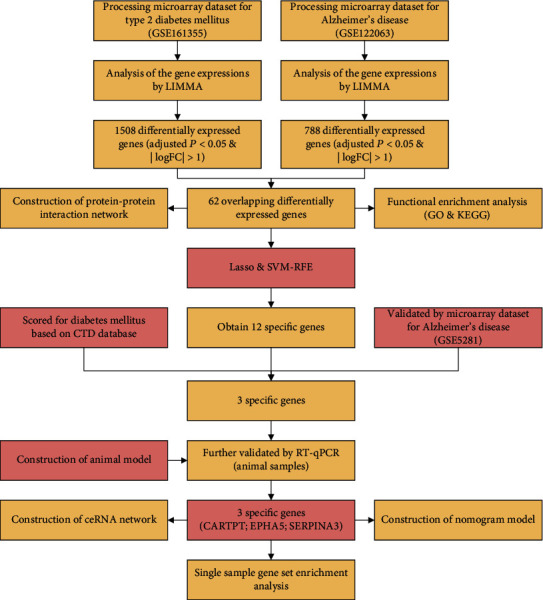
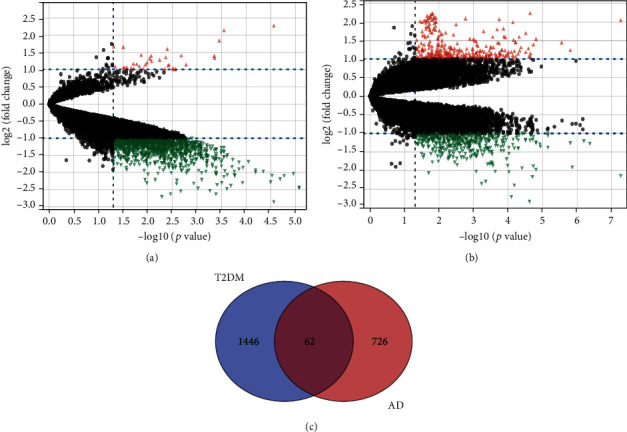
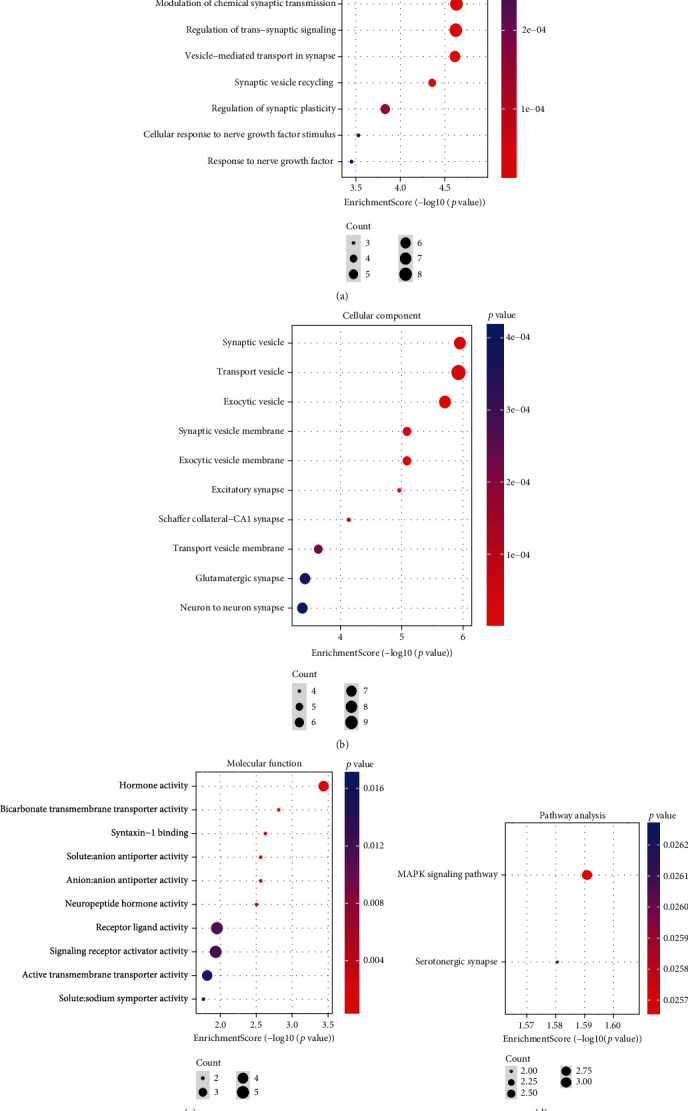
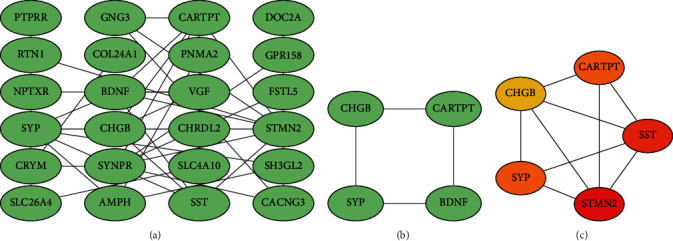
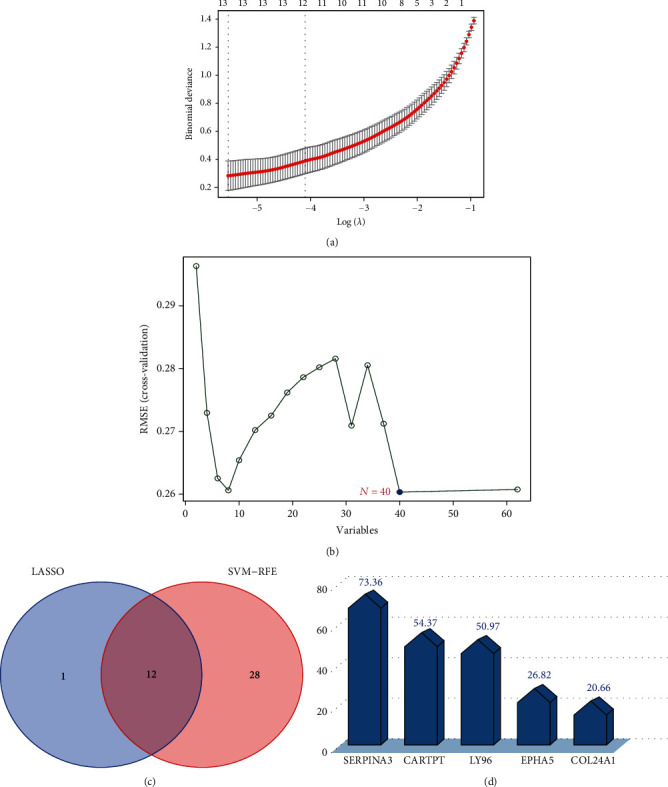
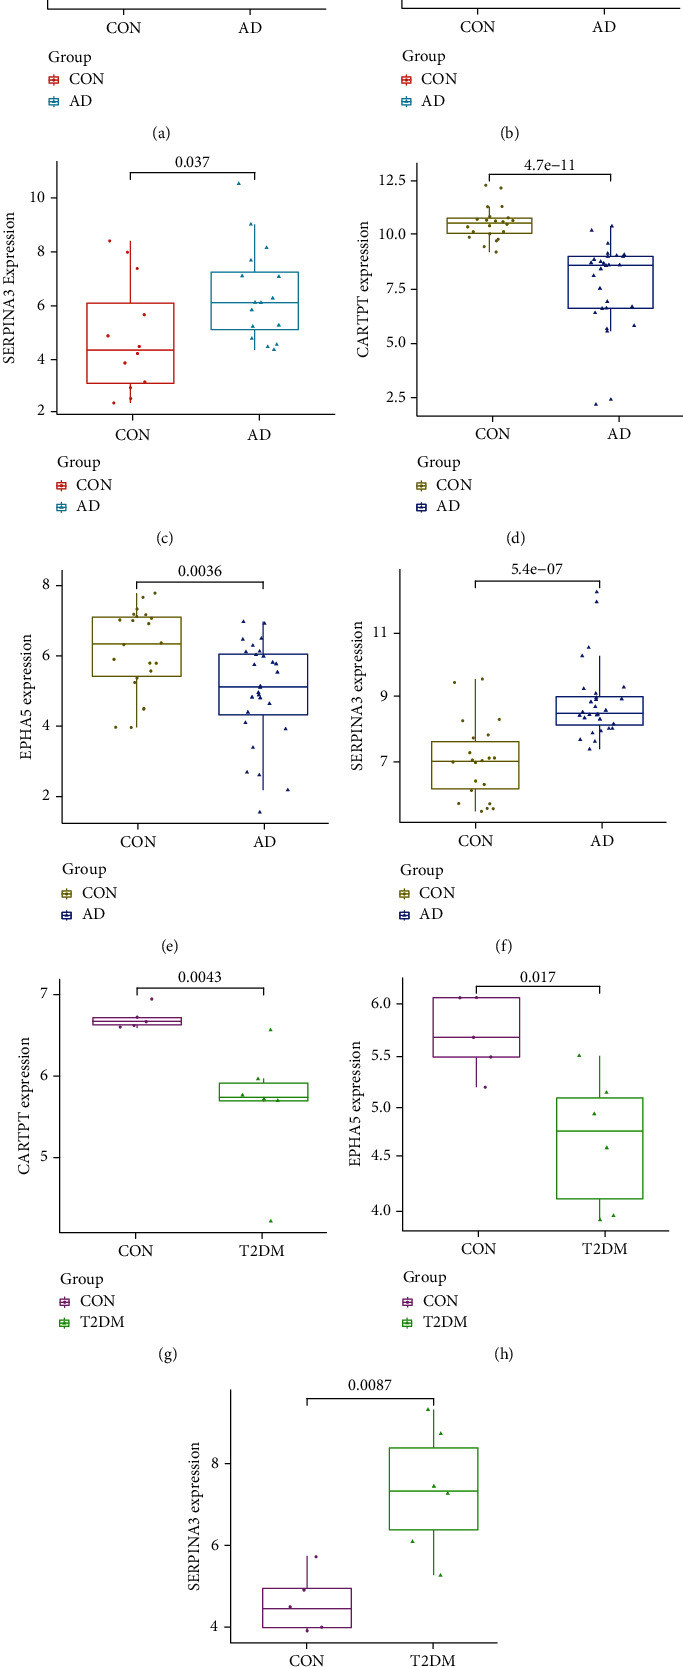
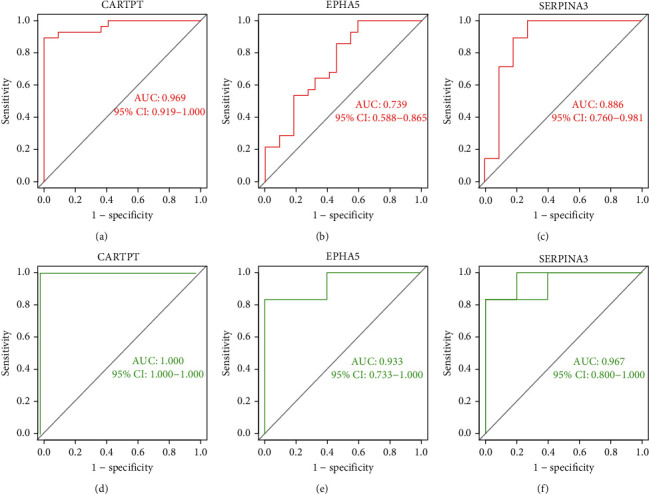
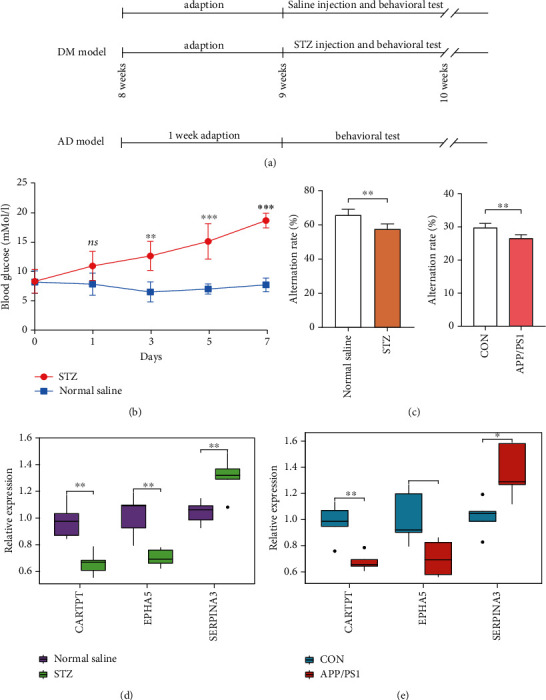
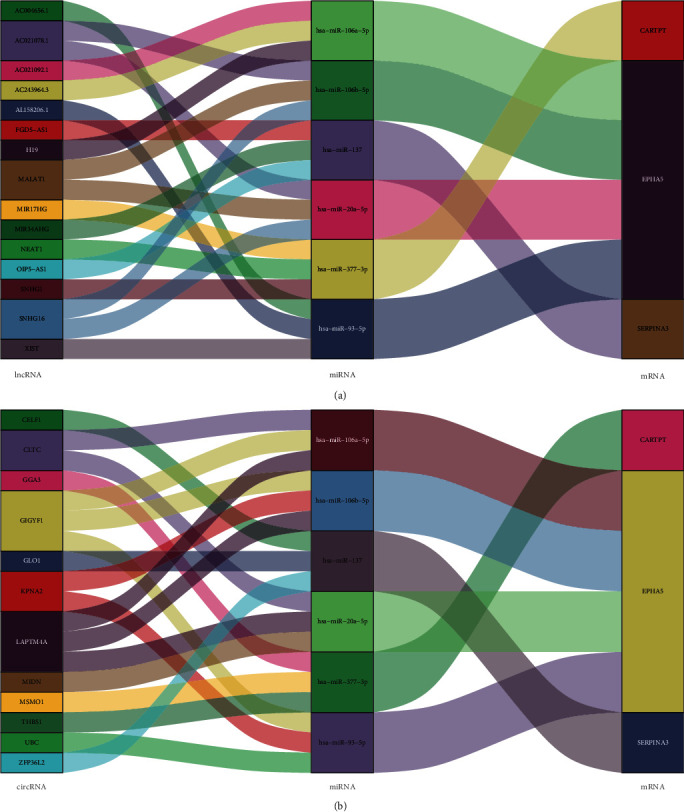
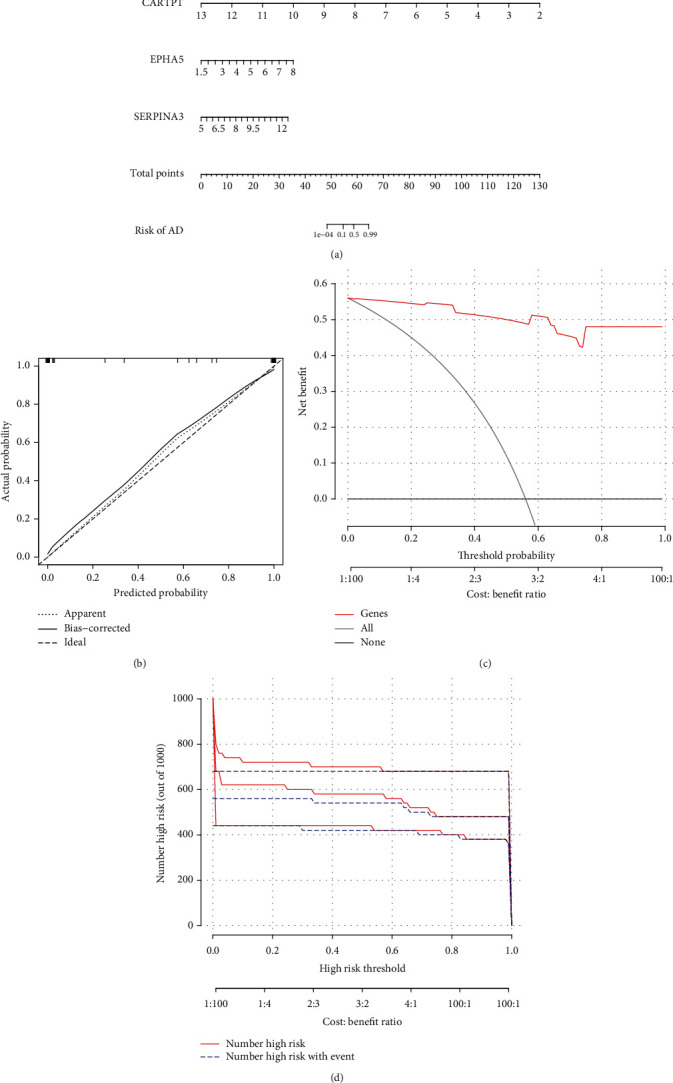
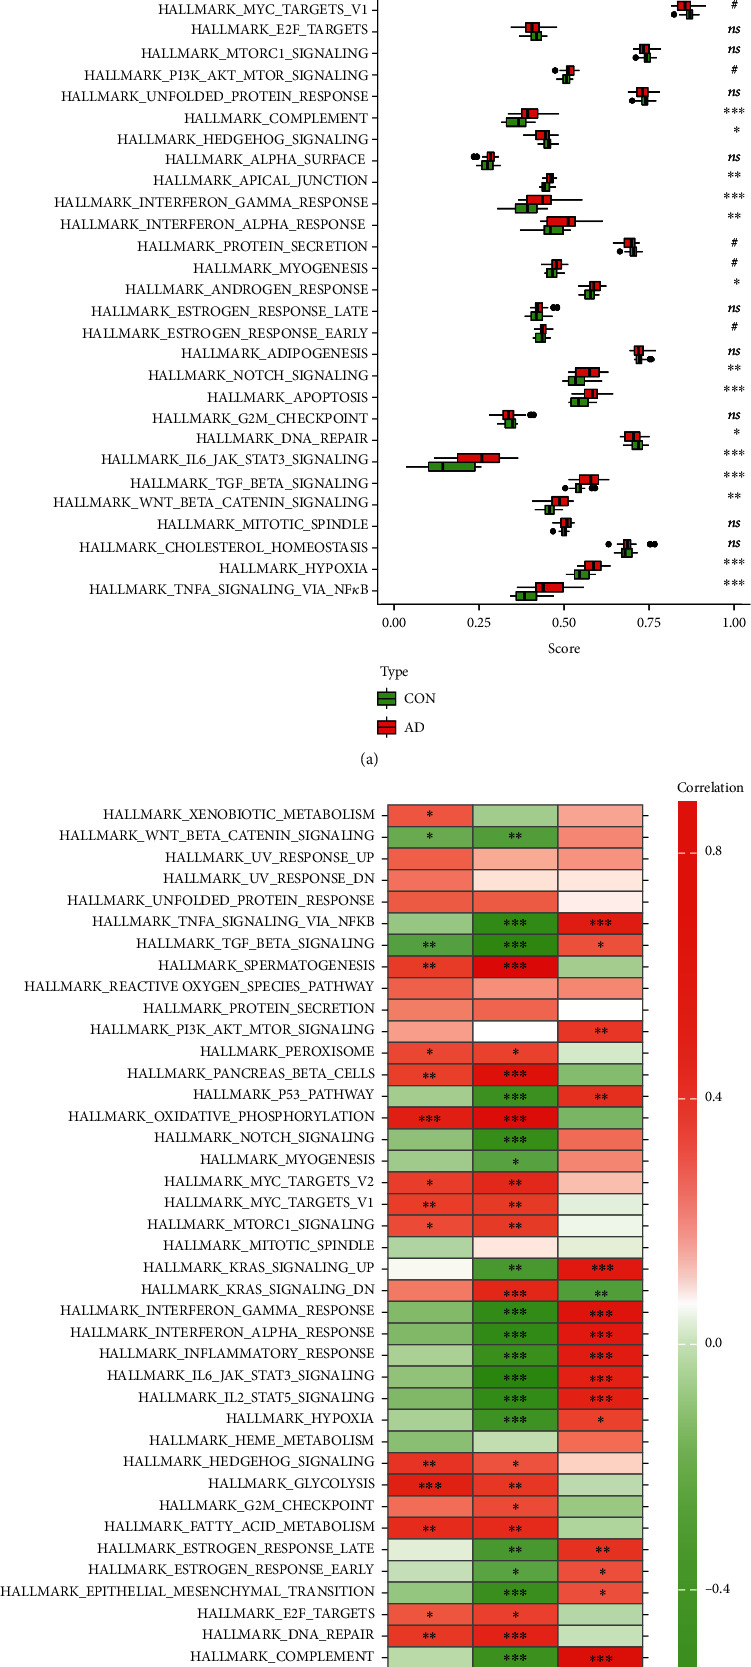
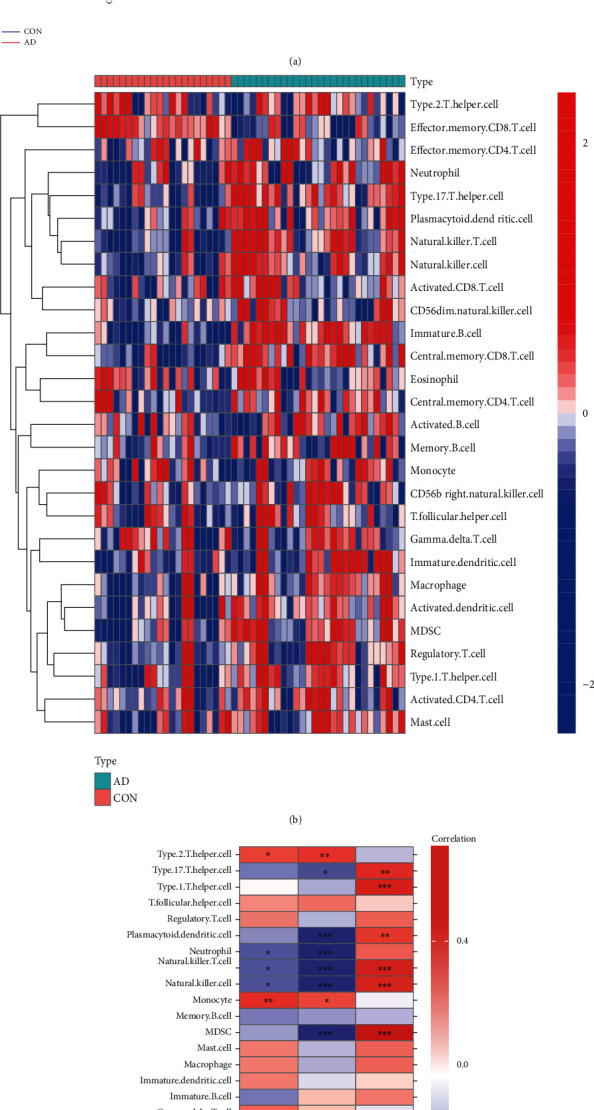
Currently, Alzheimer's disease (AD) and type 2 diabetes mellitus (T2DM) are widely prevalent in the elderly population, and accumulating evidence implies a strong link between them. For example, patients with T2DM have a higher risk of developing neurocognitive disorders, including AD, but the exact mechanisms are still unclear. This time, by combining bioinformatics analysis and in vivo experimental validation, we attempted to find a common biological link between AD and T2DM. We firstly downloaded the gene expression profiling (AD: GSE122063; T2DM: GSE161355) derived from the temporal cortex. To find the associations, differentially expressed genes (DEGs) of the two datasets were filtered and intersected. Based on them, enrichment analysis was carried out, and the least absolute shrinkage and selection operator (LASSO) logistic regression and support vector machine-recursive feature elimination (SVM-RFE) algorithms were used to identify the specific genes. After verifying in the external dataset and in the samples from the AD and type 2 diabetes animals, the shared targets of the two diseases were finally determined. Based on them, the ceRNA networks were constructed. Besides, the logistic regression and single-sample gene set enrichment analysis (ssGSEA) were performed. As a result, 62 DEGs were totally identified between AD and T2DM, and the enrichment analysis indicated that they were much related to the function of synaptic vesicle and MAPK signaling pathway. Based on the evidence from external dataset and RT-qPCR, CARTPT, EPHA5, and SERPINA3 were identified as the marker genes in both diseases, and their clinical significance and biological functions were further analyzed. In conclusion, discovering and exploring the marker genes that are dysregulated in both 2 diseases could help us better comprehend the intrinsic relationship between T2DM and AD, which may inspire us to develop new strategies for facing the dilemmas of clinical or basic research in cognitive dysfunction.


Conflict of interest statement

The authors declared no potential conflicts of interest with respect to the research, authorship, and/or publication of this article.

Figures

Figure 1
Figure 1
The whole analysis flow for this study.
Figure 2
Figure 2
Volcano plot of differently expressed genes. (a) GSE161355 (T2DM), (b) GSE122063 (AD), and (c) the intersection of the two sets of DEGs: 62 genes.
Figure 3
Figure 3
Bubble diagram displays the significant enrichment terms for the 62 DEGs. (a) BP terms, (b) CC terms, (c) MF terms, and (d) KEGG terms.
Figure 4
Figure 4
(a) PPI network constructed by the 62 DEGs (the disconnected nodes were hidden), (b) the most significant module in the network (score: 2.7), and (c) top 5 genes computed by the MCC algorithm (the darker the color, the higher the score).
Figure 5
Figure 5
Machine learning algorithms for finding characteristic genes. (a) The LASSO logistic regression algorithm (13 genes). (b) The SVM-RFE algorithm (40 genes). (c) The intersection of the two algorithms (12 genes). (d) The inference score of T2DM based on the CTD database (of these overlapping 12 genes, the top 5 ranked were visualized).
Figure 6
Figure 6
The expression value of CARTPT, EPHA5, and SERPINA3. (a) Validated in the GSE5281 (AD, P < 0.05), (b) expression value calculated based on the GSE122063 (AD, P < 0.05), and (c) expression value calculated based on the GSE161355 (T2DM, P < 0.05).
Figure 7
Figure 7
Diagnostic performance of CARTPT, EPHA5, and SERPINA3. (a–c) The ROC curves based on the GSE122063 (AD) and (d–f) the ROC curves based on GSE161355 (T2DM).
Figure 8
Figure 8
Temporal cortex tissue for external validation: (a) time-flow diagram; (b) changes in blood glucose; (c) results of behavioral test (Y maze); (d) RT-qPCR for CARTPT, EPHA5, and SERPINA3 (n = 5 in the control mice; n = 5 in the T2DM mice); and (e) RT-qPCR for CARTPT, EPHA5, and SERPINA3 (n = 5 in the control mice; n = 5 in the APP/PS1 mice). The significance of differences indicated in figures: P < 0.05, ∗∗P < 0.01, and ∗∗∗P < .001.
Figure 9
Figure 9
Sankey diagram for the ceRNA network of CARTPT, EPHA5, and SERPINA3. (a) lncRNA-miRNA-mRNA network and (b) circRNA-miRNA-mRNA network.
Figure 10
Figure 10
The nomogram model based on the gene expression in GSE122063 (AD). (a) The nomogram, (b) the calibration curve, (c) the DCA curve, and (d) the clinical impact curve.
Figure 11
Figure 11
Analysis of hallmark gene sets associated with AD (GSE122063): (a) the specific distribution of the 50 hallmark gene sets in AD and (b) the correlation analysis of the 50 hallmark gene sets with CARTPT, EPHA5, and SERPINA3.
Figure 12
Figure 12
Analysis of immune landscape associated with AD (GSE122063) (a) violin plot: 14 types of immune cells were differently distributed between healthy control and AD (b) heatmap; (c) the relationship between 3 genes (CARTPT, EPHA5, and SERPINA3) and immune cell infiltration.

References

    1. Feldman H., Woodward M. The staging and assessment of moderate to severe Alzheimer disease. Neurology . 2005;65(6) Supplement 3:S10–S17. doi: 10.1212/WNL.65.6_suppl_3.S10. - DOI
    1. Breijyeh Z., Karaman R. Comprehensive review on Alzheimer's disease: causes and treatment. Molecules (Basel, Switzerland) . 2020;25(24) doi: 10.3390/molecules25245789. - DOI - PMC - PubMed
    1. Xu W., Qiu C., Winblad B., Fratiglioni L. The effect of borderline diabetes on the risk of dementia and Alzheimer’s disease. Diabetes . 2007;56(1):211–216. doi: 10.2337/db06-0879. - DOI - PubMed
    1. Adeghate E., Schattner P., Dunn E. An update on the etiology and epidemiology of diabetes mellitus. Annals of the New York Academy of Sciences . 2006;1084(1):1–29. doi: 10.1196/annals.1372.029. - DOI - PubMed
    1. Eberle C., Stichling S. Clinical improvements by telemedicine interventions managing type 1 and type 2 diabetes: systematic meta-review. Journal of Medical Internet Research . 2021;23(2, article e23244) doi: 10.2196/23244. - DOI - PMC - PubMed