

Allosteric aptasensor-initiated target cycling and transcription amplification of light-up RNA aptamer for sensitive detection of protein
- PMID: 35996600
- PMCID: PMC9385276
- DOI: 10.1016/j.snb.2022.132526
Allosteric aptasensor-initiated target cycling and transcription amplification of light-up RNA aptamer for sensitive detection of protein
Abstract
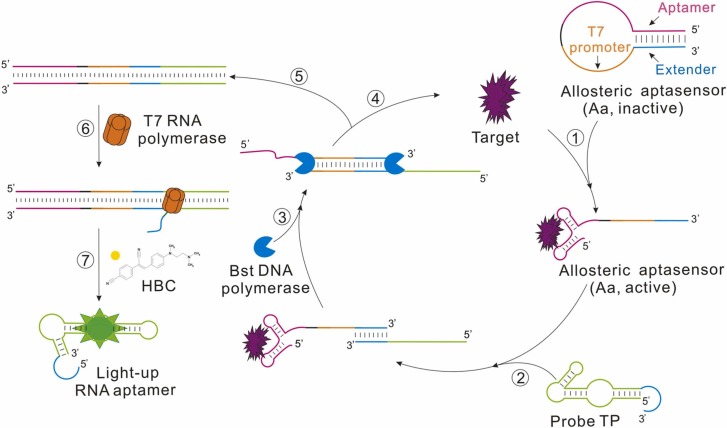
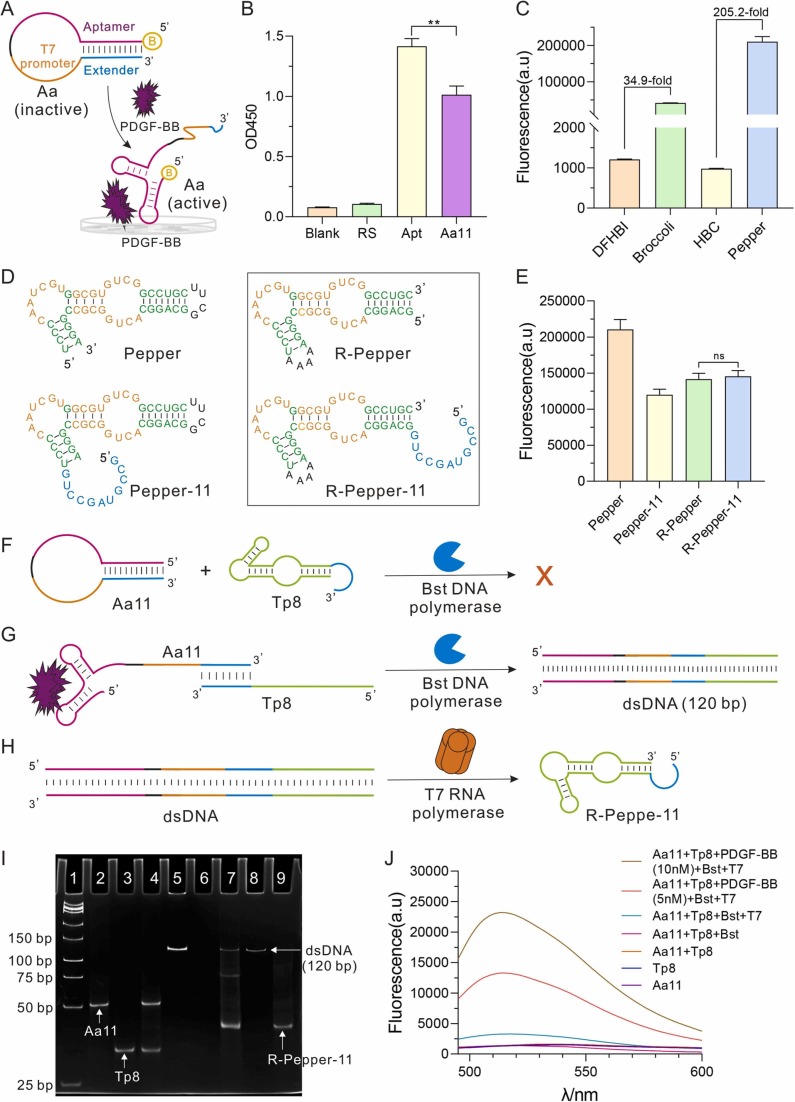
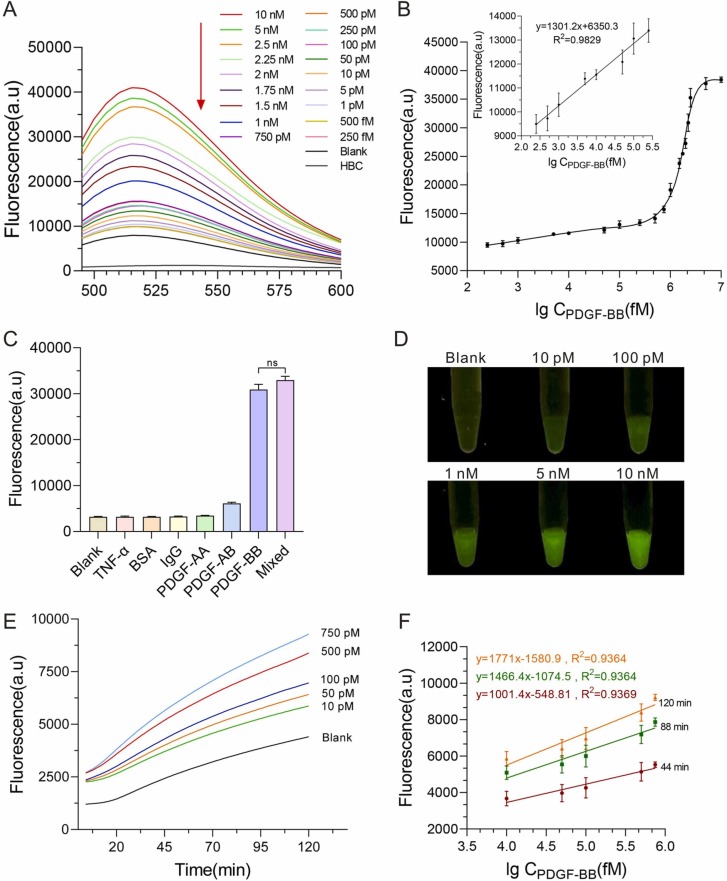
The early detection of biomarker proteins in clinical samples is of great significance for the diagnosis of diseases. However, it is still a challenge to detect low-concentration protein. Herein, a label-free aptamer-based amplification assay, termed the ATC-TA system, that allows fluorescence detection of very low numbers of protein without time-consuming washing steps and pre-treatment was developed. The target induces a conformational change in the allosteric aptasensor, triggers the target cycling and transcription amplification, and ultimately converts the input of the target protein into the output of the light-up aptamer (R-Pepper). It exhibits ultrahigh sensitivity with a detection limit of 5.62 fM at 37 ℃ and the accuracy is comparable to conventional ELISA. ATC-TA has potential application for the detection of endogenous PDGF-BB in serum samples to distinguish tumor mice from healthy mice at an early stage. It also successfully detects exogenous SARS-CoV-2 spike proteins in human serum. Therefore, this high-sensitive, universality, easy-to-operate and cost-effective biosensing platform holds great clinical application potential in early clinical diagnosis.
Keywords: Allosteric aptasensor; Light-up RNA aptamer; Protein detection; Target cycling signal amplification; Transcription amplification.
© 2022 Elsevier B.V. All rights reserved.
Conflict of interest statement
The authors declare that they have no known competing financial interests or personal relationships that could have appeared to influence the work reported in this paper.
Figures


Similar articles
-
A novel electrochemiluminescence aptasensor for protein based on a sensitive N-(aminobutyl)-N-ethylisoluminol-functionalized gold nanoprobe.Analyst. 2011 Aug 21;136(16):3244-51. doi: 10.1039/c1an15298j. Epub 2011 Jun 9. Analyst. 2011. PMID: 21655607
-
Highly sensitive detection of protein with aptamer-based target-triggering two-stage amplification.Anal Chem. 2012 Feb 7;84(3):1623-9. doi: 10.1021/ac2029002. Epub 2012 Jan 24. Anal Chem. 2012. PMID: 22224936
-
Target-triggered tertiary amplifications for sensitive and label-free protein detection based on lighting-up RNA aptamer transcriptions.Anal Chim Acta. 2022 Jul 18;1217:340028. doi: 10.1016/j.aca.2022.340028. Epub 2022 Jun 1. Anal Chim Acta. 2022. PMID: 35690424
-
A target-responsive autonomous aptamer machine biosensor for enzyme-free and sensitive detection of protein biomarkers.J Mater Chem B. 2018 Jun 28;6(24):4146-4150. doi: 10.1039/c8tb00610e. Epub 2018 Jun 8. J Mater Chem B. 2018. PMID: 32255157
-
Recent advances on aptamer-based biosensors to detection of platelet-derived growth factor.Biosens Bioelectron. 2018 Aug 15;113:58-71. doi: 10.1016/j.bios.2018.04.048. Epub 2018 Apr 22. Biosens Bioelectron. 2018. PMID: 29729560 Review.
Cited by
-
Investigating the Effect of RNA Scaffolds on the Multicolor Fluorogenic Aptamer Pepper in Different Bacterial Species.ACS Synth Biol. 2024 Apr 19;13(4):1093-1099. doi: 10.1021/acssynbio.4c00009. Epub 2024 Apr 9. ACS Synth Biol. 2024. PMID: 38593047 Free PMC article.
-
Research Progress on Signal Conversion Based on Aptamer Combined CRISPR/Cas System in Biosensors.Mol Diagn Ther. 2025 Jul;29(4):499-518. doi: 10.1007/s40291-025-00785-7. Epub 2025 Jun 18. Mol Diagn Ther. 2025. PMID: 40531391 Review.
References
-
- Zhang Z., Bast R.C., Yu Y.H., Li J.N., Sokoll L.J., Rai A.J., et al. Three biomarkers identified from serum proteomic analysis for the detection of early stage ovarian cancer. Cancer Res. 2004;64:5882–5890. - PubMed
-
- Gosling J.P. A decade of development in immunoassay methodology. Clin. Chem. 1990;36:1408–1427. - PubMed
-
- Domon B., Aebersold R. Review - Mass spectrometry and protein analysis. Science. 2006;312:212–217. - PubMed
LinkOut - more resources
Full Text Sources
Research Materials
Miscellaneous
