. 2022 Aug 19:2:105.
doi: 10.1038/s43856-022-00138-z. eCollection 2022.

A user-friendly tool for cloud-based whole slide image segmentation with examples from renal histopathology

Collaborators, Affiliations

A user-friendly tool for cloud-based whole slide image segmentation with examples from renal histopathology

Brendon Lutnick et al. Commun Med (Lond). .

Abstract

Background: Image-based machine learning tools hold great promise for clinical applications in pathology research. However, the ideal end-users of these computational tools (e.g., pathologists and biological scientists) often lack the programming experience required for the setup and use of these tools which often rely on the use of command line interfaces.

Methods: We have developed Histo-Cloud, a tool for segmentation of whole slide images (WSIs) that has an easy-to-use graphical user interface. This tool runs a state-of-the-art convolutional neural network (CNN) for segmentation of WSIs in the cloud and allows the extraction of features from segmented regions for further analysis.

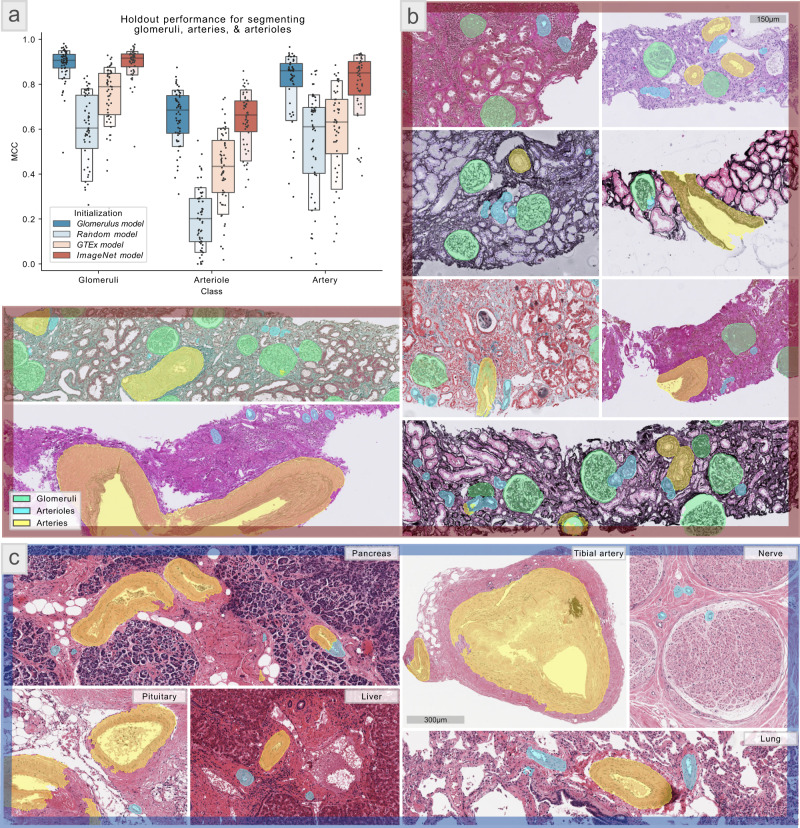
Results: By segmenting glomeruli, interstitial fibrosis and tubular atrophy, and vascular structures from renal and non-renal WSIs, we demonstrate the scalability, best practices for transfer learning, and effects of dataset variability. Finally, we demonstrate an application for animal model research, analyzing glomerular features in three murine models.

Conclusions: Histo-Cloud is open source, accessible over the internet, and adaptable for segmentation of any histological structure regardless of stain.

Keywords: Computational biology and bioinformatics; End-stage renal disease.


Conflict of interest statement

Competing interestsJ.E.Z. is a paid consultant for Leica Biosystems. The remaining authors declare no competing interests.

Figures

Fig. 1
Fig. 1. The user interface of the segmentation tool (available via the web).
a The left <Segment WSI > column shows the controls for the segmentation plugin: <IO> is required arguments and <WSI Analysis> contains optional parameters. WSI stands for whole slide image and IO stands for Input/Output. The right column shows the WSI viewer controls and annotations created by the plugin. The green annotations are computationally predicted and are easily editable by the user. Slides are analyzed by clicking the <Submit> button in the top left corner. b The options from the <Train Segmentation Network> plugin. Under the <IO> section, a user can specify a directory full of annotated WSIs to use for network training with the <Training Data Folder> option, and where to save the trained model with the <Output Model Name> option. The <Training layers> option gives users the ability to choose which annotation layers should be used for training and multi-class segmentation models can be trained. To speed up the training process, a previously trained segmentation model can be used for transfer learning by specifying the <Input Model File>. Hyperparameters for training the network is automatically set to defaults that work well but can be modified using the options in the <WSI Training Parameters> section. c shows the <Extract Features> plugin which can be used to extract image and morphology features from annotated objects. These features are written to the slide metadata and can be plotted from within the online interface via the <Metadata Plot> tab (on the right). d shows the welcome screen of the online interface athena.ccr.buffalo.edu.
Fig. 2
Fig. 2. Glomeruli segmentation results—scalability study.
a The segmentation performance of glomerulus model for glomeruli detection. Matthews correlation coefficients were calculated for three renal tissue whole slide image (WSI) datasets, as specified in subsection Glomeruli segmentation—scalability under the section Results. GlomTestSet 1 contained 100 WSIs holdout from the training set GlomTrainSet, GlomTestSet 2 had 58 WSIs, and GlomTestSet 3 had 17 WSIs. Both GlomTestSet 2 and GlomTestSet 3 were from an institution independent of the institutions from where the training dataset GlomTrainSet was formed for training the glomerulus model. Further, glomerular boundaries in GlomTestSet 2 and GlomTestSet 3 were annotated by an independent annotator who was not involved in annotating glomeruli in GlomTrainSet. Each dot represents a WSI. Box plot elements: The plot starts with the median as the centerline. Each successive level outward contains half of the remaining data. Namely, the first two sections out from the centerline contain 50% of the data. After that, the next two sections contain 25% of the data. This continues until we are at the outlier level. Each level out is shaded lighter. We used around 5–8 outliers in each tail. b shows the prediction time in minutes as a function of the WSI size in pixels for glomeruli predictions on 1528 WSIs in GlomTestSet 4. The color and size of the points represent the size of the automatically extracted tissue region of the slide (the analyzed region) in pixels. The proposed glomerular segmentation model scales roughly linearly in time for increasing WSI size. Each dot represents a WSI. c A batch of randomly selected glomeruli with the computationally segmented boundaries from the 100 holdout WSIs in GlomTestSet 1. This selection is intended to highlight the diversity of pathology and staining of the holdout dataset. The scale bar is 50 µm.
Fig. 3
Fig. 3. Vessel segmentation results—transfer learning study.
a Segmentation performance as a function of network initialization (measured as Matthews correlation coefficient [MCC]) for the VessTestSet (58 holdout WSIs). The ground-truth annotations of structures were generated for segmenting three classes: glomeruli, arterioles, and arteries. The colors represent different transfer learning sources for parameter initialization. Namely, the glomerulus model is the model originally used for glomerular segmentation results in Fig. 2, offering MCC = 0.91, 0.66, and 0.84 for segmenting glomeruli, arteriole, and arteries, respectively. The random model does not use transfer learning for parameter initialization, offering MCC = 0.55, 0.22, and 0.54 in segmenting the three respective compartments. GTEx (genotype-tissue expression) model is a model originally trained to identify the diverse tissue types from the publicly available GTEx tissue WSI dataset (15,989 WSIs with 40 different tissue types), offering MCC = 0.77, 0.44, and 0.62 for the segmenting three respective compartments after transfer learning. ImageNet model uses a model pretrained on the ImageNet dataset, offering MCC = 0.91, 0.66, and 0.86 in segmenting the three respective compartments. Each dot in the box plot represents a WSI. Box plot elements: The plot starts with the median as the centerline. Each successive level outward contains half of the remaining data. Namely, the first two sections out from the centerline contain 50% of the data. After that, the next two sections contain 25% of the data. This continues until we are at the outlier level. Each level out is shaded lighter. We used around 5–8 outliers in each tail. b shows randomly selected crops of WSIs from the holdout set (VessTestSet) with computational segmentations by the model trained based on the ImageNet model as the starting point. The scale bar is 150 µm. c shows randomly selected crops of various types of tissues from GTEx WSIs, computationally segmented using the model trained based on the ImageNet model. Despite being trained only on kidney tissues, the trained model is able to segment arteries and arterioles in diverse tissue types. We also note that the GTEx slides are autopsy tissues scanned at 20X, and the training set for this study VessTrainSet was scanned at 40X, and did not contain autopsy tissue WSIs. The scale bar is 300 µm.
Fig. 4
Fig. 4. Interstitial fibrosis and tubular atrophy (IFTA) segmentation results—multi-institute study.
a Receiver operating characteristic (ROC) plots showing the segmentation performance of five trained IFTA models on 29 holdout whole slide images (WSIs), IFTATestSet 1. Models—Institution 1, Institution 2, and Institution 3 were trained using datasets from three different institutions (with 12, 24, and 12 WSIs respectively). The Combined full model was trained by pooling these three datasets (48 WSIs). The Combined 1/3rd model used 1/3rd of the pooled training set, randomly selected (16 WSIs). This last model yielded better IFTA segmentation performance than the first three models, highlighting the importance of dataset diversity. The combined full model offered slightly better performance than the Combined 1/3rd model. b shows the performance of the five models on the independent test dataset IFTATestSet 2 with 17 WSIs. This dataset originated from an independent institution than those used in [a] and was annotated by an independent annotator. We observed the same performance trend as in [a]. c shows the pairwise Intraclass correlation coefficients (ICC) (p value < 0.05) for percent IFTA scored visually by three additional annotators and estimated based on computational segmentation using the Combined full model (computer) for the 26 WSIs in KPMPTestSet. The kidney precision medicine project (KPMP) cohort acted as another independent test set which was never seen by our trained model. d shows computational IFTA predictions using the Combined full model on the holdout WSIs IFTATestSet 1. The left shows the traditional contour predictions, the right shows the corresponding heatmap predictions developed specifically for structures with poorly defined boundaries.
Fig. 5
Fig. 5. Murine model glomerulus feature analysis—utility study.
Feature analysis from glomeruli segmented from renal tissue whole slide images (WSIs) from three murine models: a is an aging model and b, c are two type 2 diabetic nephropathy (DN) models (KKAy and Db/Db). In each panel, the left plot shows an unsupervised uniform manifold approximation and projection for dimension reduction (UMAP) representations of 315 engineered image features extracted from the murine glomeruli, where the glomeruli were segmented using the glomerulus model. Here each dot is a glomerulus and the red and blue colors differentiate the disease from the control. Definitions and quantification strategy of the 315 engineered image features are available in our prior work. The right plot shows the highest differentially expressed feature as predicted using the Seurat software. The representative glomeruli from each murine class depicting this differentially expressed feature, and the feature value, are shown on the right for each murine model. Each dot in the UMAP and violin plots in [ac] represents a WSI. d shows a K-nearest neighbors (KNN) classifier performance plotting the Cohen’s Kappa measure as a function of K neighbors for classifying the unsupervised UMAP features with respect to disease vs control status for the murine models. This analysis was done using tenfold cross-validation using a similar method as formalized in a previous work. Definitions of the 315 features are provided in Supp. Table 2. This study suggests that the seamless segmentation of glomeruli from large WSIs using our tool facilitates conducting deep glomerular feature analysis to study novel murine models.

References

    1. LeCun Y, Bottou L, Bengio Y, Haffner P. Gradient-based learning applied to document recognition. Proceedings of the IEEE. 1998;86:2278–2324. doi: 10.1109/5.726791. - DOI
    1. Abels E, et al. Computational pathology definitions, best practices, and recommendations for regulatory guidance: a white paper from the Digital Pathology Association. J. pathol. 2019;249:286–294. doi: 10.1002/path.5331. - DOI - PMC - PubMed
    1. Farahani N, Parwani AV, Pantanowitz L. Whole slide imaging in pathology: advantages, limitations, and emerging perspectives. Pathol. Lab. Med. Int. 2015;7:23–33.
    1. Santo BA, Rosenberg AZ, Sarder P. Artificial intelligence driven next-generation renal histomorphometry. Curr. Opin. Nephrol. Hypertens. 2020;29:265–272. doi: 10.1097/MNH.0000000000000598. - DOI - PMC - PubMed
    1. Ginley, B. et al. Computational segmentation and classification of diabetic glomerulosclerosis. J. Am. Soc. Nephrol. 30, 1953–1967 (2019). - PMC - PubMed