

Artificial intelligence model on chest imaging to diagnose COVID-19 and other pneumonias: A systematic review and meta-analysis
- PMID: 35996746
- PMCID: PMC9385733
- DOI: 10.1016/j.ejro.2022.100438
Artificial intelligence model on chest imaging to diagnose COVID-19 and other pneumonias: A systematic review and meta-analysis
Abstract
Objectives: When diagnosing Coronavirus disease 2019(COVID-19), radiologists cannot make an accurate judgments because the image characteristics of COVID-19 and other pneumonia are similar. As machine learning advances, artificial intelligence(AI) models show promise in diagnosing COVID-19 and other pneumonias. We performed a systematic review and meta-analysis to assess the diagnostic accuracy and methodological quality of the models.
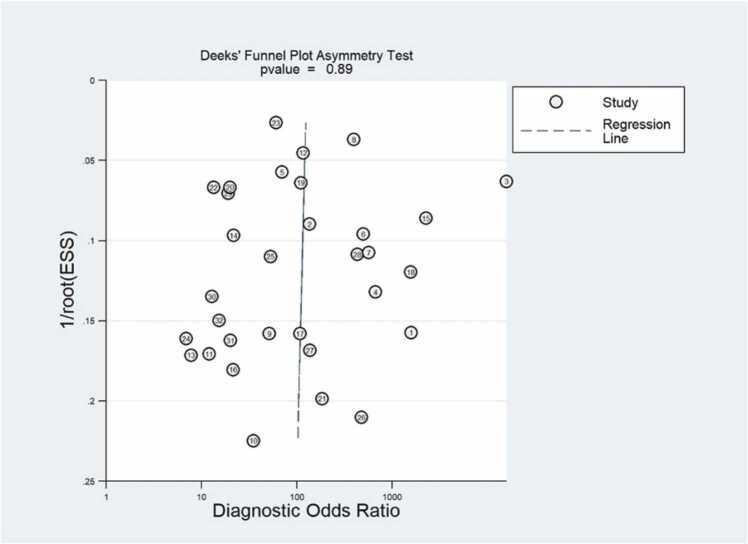
Methods: We searched PubMed, Cochrane Library, Web of Science, and Embase, preprints from medRxiv and bioRxiv to locate studies published before December 2021, with no language restrictions. And a quality assessment (QUADAS-2), Radiomics Quality Score (RQS) tools and CLAIM checklist were used to assess the quality of each study. We used random-effects models to calculate pooled sensitivity and specificity, I2 values to assess heterogeneity, and Deeks' test to assess publication bias.
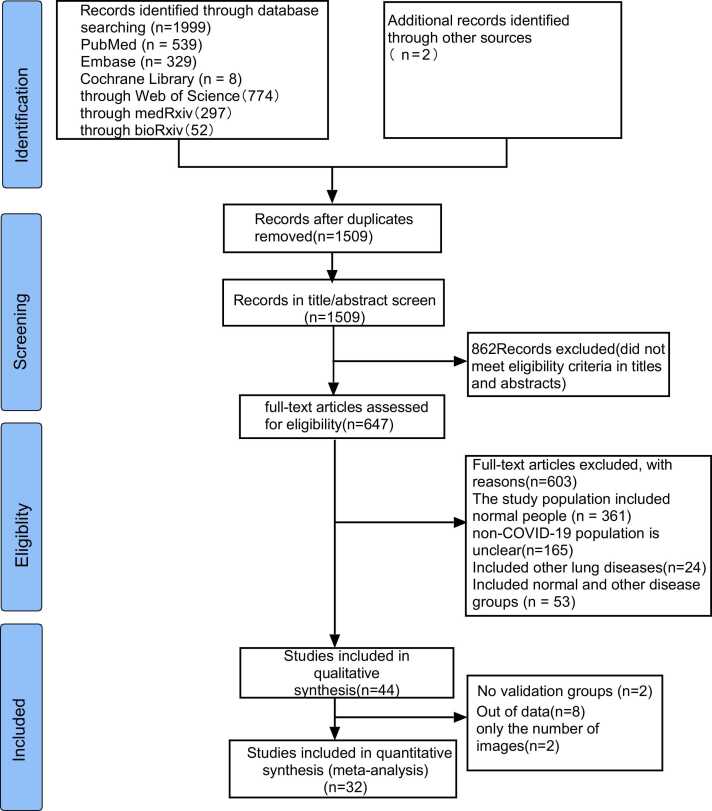
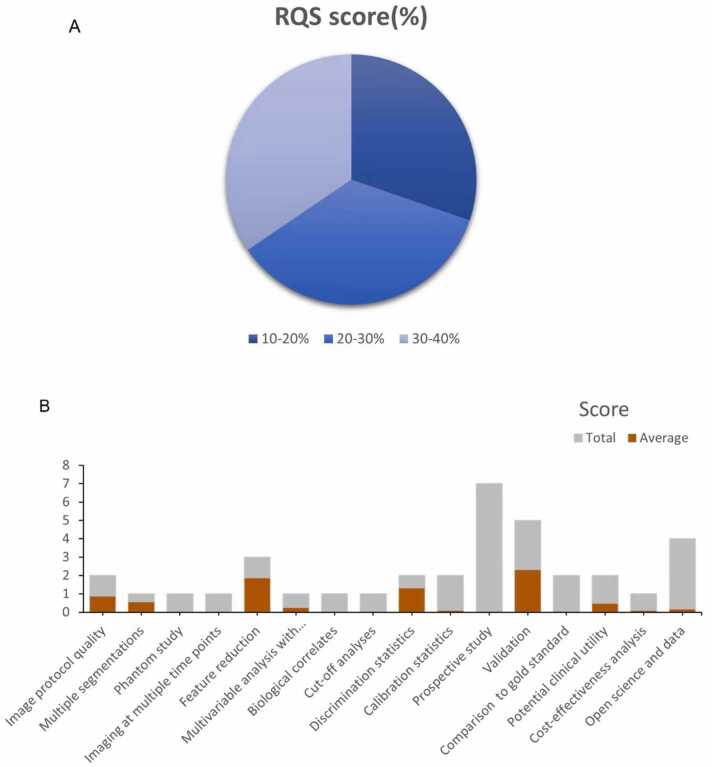
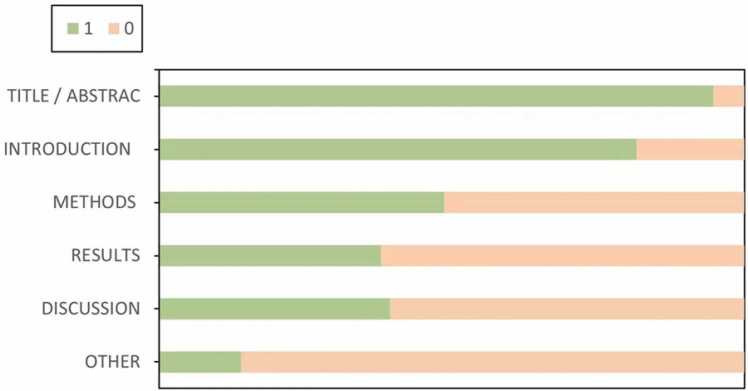
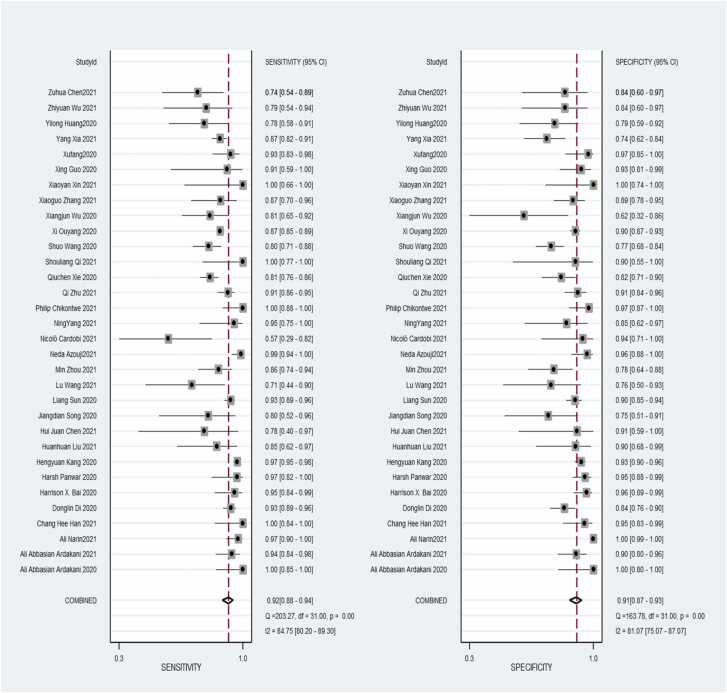
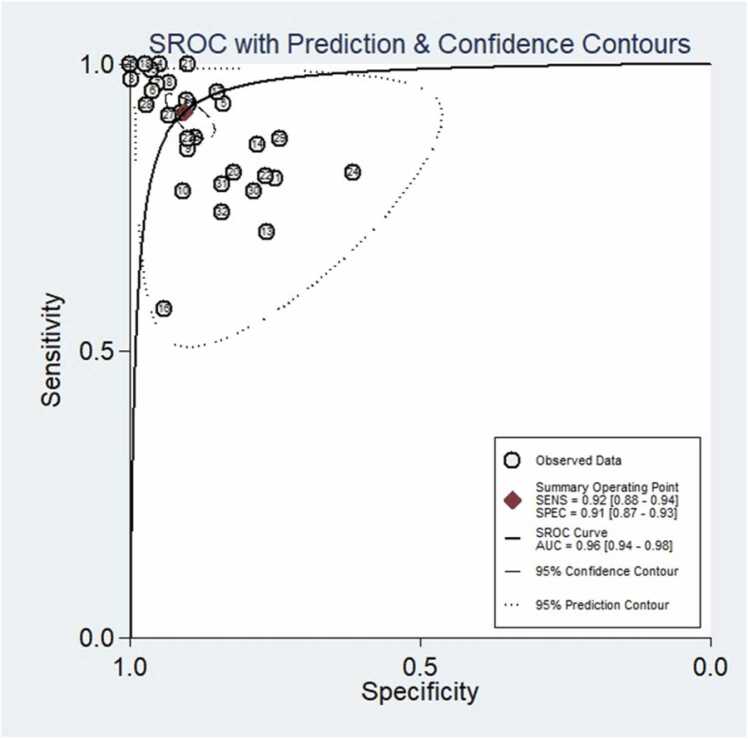
Results: We screened 32 studies from the 2001 retrieved articles for inclusion in the meta-analysis. We included 6737 participants in the test or validation group. The meta-analysis revealed that AI models based on chest imaging distinguishes COVID-19 from other pneumonias: pooled area under the curve (AUC) 0.96 (95 % CI, 0.94-0.98), sensitivity 0.92 (95 % CI, 0.88-0.94), pooled specificity 0.91 (95 % CI, 0.87-0.93). The average RQS score of 13 studies using radiomics was 7.8, accounting for 22 % of the total score. The 19 studies using deep learning methods had an average CLAIM score of 20, slightly less than half (48.24 %) the ideal score of 42.00.
Conclusions: The AI model for chest imaging could well diagnose COVID-19 and other pneumonias. However, it has not been implemented as a clinical decision-making tool. Future researchers should pay more attention to the quality of research methodology and further improve the generalizability of the developed predictive models.
Keywords: 2D, two-dimensional; 3D, three-dimensional; AI, artificial intelligence; AUC, area under the curve; Artificial Intelligence; CNN, Convolutional neural network; COVID-19; COVID-19, Coronavirus disease 2019; CRP, C-reactive protein; CT, Computed tomography; CXR, Chest X-Ray; Diagnostic Imaging; GGO, ground-glass opacities; KNN, K-nearest neighbor; LASSO, least absolute shrinkage and selection operator; MEERS-COV, Middle East respiratory syndrome coronavirus; ML, machine learning; Machine learning; PLR, negative likelihood ratio; PLR, positive likelihood ratio; Pneumonia; ROI, regions of interest; RT-PCR, Reverse transcriptase polymerase chain reaction; SARS, severe acute respiratory syndrome; SARS-CoV-2, severe acute respiratory syndrome coronavirus 2; SROC, summary receiver operating characteristic; SVM, Support vector machine.
© 2022 The Authors.
Conflict of interest statement
The authors declare that they have no known competing financial interests or personal relationships that could have appeared to influence the work reported in this paper.
Figures
Similar articles
-
Artificial intelligence in clinical care amidst COVID-19 pandemic: A systematic review.Comput Struct Biotechnol J. 2021;19:2833-2850. doi: 10.1016/j.csbj.2021.05.010. Epub 2021 May 7. Comput Struct Biotechnol J. 2021. PMID: 34025952 Free PMC article. Review.
-
Thoracic imaging tests for the diagnosis of COVID-19.Cochrane Database Syst Rev. 2020 Sep 30;9:CD013639. doi: 10.1002/14651858.CD013639.pub2. Cochrane Database Syst Rev. 2020. Update in: Cochrane Database Syst Rev. 2020 Nov 26;11:CD013639. doi: 10.1002/14651858.CD013639.pub3. PMID: 32997361 Updated.
-
Thoracic imaging tests for the diagnosis of COVID-19.Cochrane Database Syst Rev. 2020 Nov 26;11:CD013639. doi: 10.1002/14651858.CD013639.pub3. Cochrane Database Syst Rev. 2020. Update in: Cochrane Database Syst Rev. 2021 Mar 16;3:CD013639. doi: 10.1002/14651858.CD013639.pub4. PMID: 33242342 Updated.
-
The diagnostic accuracy of Artificial Intelligence-Assisted CT imaging in COVID-19 disease: A systematic review and meta-analysis.Inform Med Unlocked. 2021;24:100591. doi: 10.1016/j.imu.2021.100591. Epub 2021 May 6. Inform Med Unlocked. 2021. PMID: 33977119 Free PMC article. Review.
-
Artificial intelligence with magnetic resonance imaging for prediction of pathological complete response to neoadjuvant chemoradiotherapy in rectal cancer: A systematic review and meta-analysis.Front Oncol. 2022 Oct 12;12:1026216. doi: 10.3389/fonc.2022.1026216. eCollection 2022. Front Oncol. 2022. PMID: 36313696 Free PMC article.
Cited by
-
Evolving and Novel Applications of Artificial Intelligence in Thoracic Imaging.Diagnostics (Basel). 2024 Jul 8;14(13):1456. doi: 10.3390/diagnostics14131456. Diagnostics (Basel). 2024. PMID: 39001346 Free PMC article. Review.
-
Harnessing of Artificial Intelligence for the Diagnosis and Prevention of Hospital-Acquired Infections: A Systematic Review.Diagnostics (Basel). 2024 Feb 23;14(5):484. doi: 10.3390/diagnostics14050484. Diagnostics (Basel). 2024. PMID: 38472956 Free PMC article. Review.
-
Machine learning-based computer-aided simple triage (CAST) for COVID-19 pneumonia as compared with triage by board-certified chest radiologists.Jpn J Radiol. 2024 Mar;42(3):276-290. doi: 10.1007/s11604-023-01495-y. Epub 2023 Oct 20. Jpn J Radiol. 2024. PMID: 37861955 Free PMC article.
-
The Impact of Artificial Intelligence on Microbial Diagnosis.Microorganisms. 2024 May 23;12(6):1051. doi: 10.3390/microorganisms12061051. Microorganisms. 2024. PMID: 38930432 Free PMC article. Review.
-
Clinical applications of artificial intelligence in identification and management of bacterial infection: Systematic review and meta-analysis.Saudi J Biol Sci. 2024 Mar;31(3):103934. doi: 10.1016/j.sjbs.2024.103934. Epub 2024 Jan 14. Saudi J Biol Sci. 2024. PMID: 38304541 Free PMC article. Review.
References
-
-
World Health Organization. https://covid19.who.int/
-
Publication types
LinkOut - more resources
Full Text Sources
Research Materials
Miscellaneous
