

Population-based hospitalization burden estimates for respiratory viruses, 2015-2019
- PMID: 35996836
- PMCID: PMC9530548
- DOI: 10.1111/irv.13040
Population-based hospitalization burden estimates for respiratory viruses, 2015-2019
Abstract
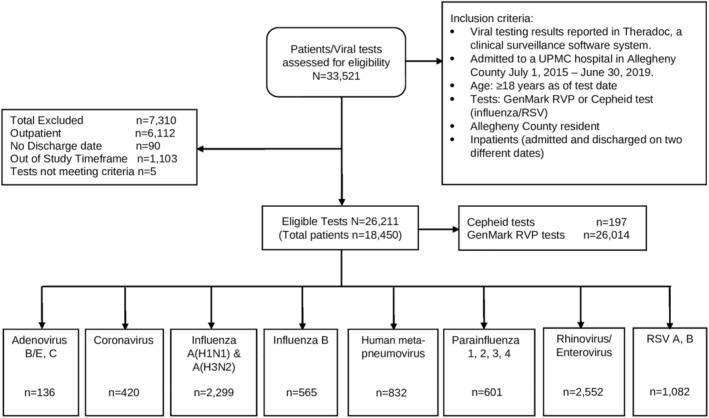
Background: Acute respiratory infections (ARIs) result in millions of illnesses and hundreds of thousands of hospitalizations annually in the United States. The responsible viruses include influenza, parainfluenza, human metapneumovirus, coronaviruses, respiratory syncytial virus (RSV), and human rhinoviruses. This study estimated the population-based hospitalization burden of those respiratory viruses (RVs) over 4 years, from July 1, 2015 to June 30, 2019, among adults ≥18 years of age for Allegheny County (Pittsburgh), Pennsylvania.
Methods: We used population-based statewide hospital discharge data, health system electronic medical record (EMR) data for RV tests, census data, and a published method to calculate burden.
Results: Among 26,211 eligible RV tests, 67.6% were negative for any virus. The viruses detected were rhinovirus/enterovirus (2552; 30.1%), influenza A (2,299; 27.1%), RSV (1082; 12.7%), human metapneumovirus (832; 9.8%), parainfluenza (601; 7.1%), influenza B (565; 6.7%), non-SARS-CoV-2 coronavirus (420; 4.9% 1.5 years of data available), and adenovirus (136; 1.6%). Most tests were among female (58%) and White (71%) patients with 60% of patients ≥65 years, 24% 50-64 years, and 16% 18-49 years. The annual burden ranged from 137-174/100,000 population for rhinovirus/enterovirus; 99-182/100,000 for influenza A; and 56-81/100,000 for RSV. Among adults <65 years, rhinovirus/enterovirus hospitalization burden was higher than influenza A; whereas the reverse was true for adults ≥65 years. RV hospitalization burden increased with increasing age.
Conclusions: These virus-specific ARI population-based hospital burden estimates showed significant non-influenza burden. These estimates can serve as the basis for several areas of research that are essential for setting funding priorities and guiding public health policy.
Keywords: burden; cost; hospitalizations; respiratory viral infections.
© 2022 The Authors. Influenza and Other Respiratory Viruses published by John Wiley & Sons Ltd.
Similar articles
-
Respiratory Virus Surveillance Among Children with Acute Respiratory Illnesses - New Vaccine Surveillance Network, United States, 2016-2021.MMWR Morb Mortal Wkly Rep. 2022 Oct 7;71(40):1253-1259. doi: 10.15585/mmwr.mm7140a1. MMWR Morb Mortal Wkly Rep. 2022. PMID: 36201373 Free PMC article.
-
Wastewater concentrations of human influenza, metapneumovirus, parainfluenza, respiratory syncytial virus, rhinovirus, and seasonal coronavirus nucleic-acids during the COVID-19 pandemic: a surveillance study.Lancet Microbe. 2023 May;4(5):e340-e348. doi: 10.1016/S2666-5247(22)00386-X. Epub 2023 Mar 22. Lancet Microbe. 2023. PMID: 36965504 Free PMC article.
-
"Differential risk of hospitalization among single virus infections causing influenza-like illnesses".Influenza Other Respir Viruses. 2019 Jan;13(1):36-43. doi: 10.1111/irv.12606. Epub 2018 Oct 16. Influenza Other Respir Viruses. 2019. PMID: 30137695 Free PMC article.
-
Global patterns in monthly activity of influenza virus, respiratory syncytial virus, parainfluenza virus, and metapneumovirus: a systematic analysis.Lancet Glob Health. 2019 Aug;7(8):e1031-e1045. doi: 10.1016/S2214-109X(19)30264-5. Lancet Glob Health. 2019. PMID: 31303294
-
Regional, age and respiratory-secretion-specific prevalence of respiratory viruses associated with asthma exacerbation: a literature review.Arch Virol. 2018 Apr;163(4):845-853. doi: 10.1007/s00705-017-3700-y. Epub 2018 Jan 11. Arch Virol. 2018. PMID: 29327237 Free PMC article. Review.
Cited by
-
Hylin-a1: A Pan-Inhibitor against Emerging and Re-Emerging Respiratory Viruses.Int J Mol Sci. 2023 Sep 9;24(18):13888. doi: 10.3390/ijms241813888. Int J Mol Sci. 2023. PMID: 37762191 Free PMC article.
-
Understanding the Global Burden of Influenza in Adults Aged 18-64 years: A Systematic Literature Review from 2012 to 2022.Adv Ther. 2023 Oct;40(10):4166-4188. doi: 10.1007/s12325-023-02610-1. Epub 2023 Jul 20. Adv Ther. 2023. PMID: 37470942 Free PMC article.
-
Prevalence of Co-Infections in Primary Care Patients with Medically Attended Acute Respiratory Infection in the 2022/2023 Season.Viruses. 2024 Aug 13;16(8):1289. doi: 10.3390/v16081289. Viruses. 2024. PMID: 39205263 Free PMC article.
-
Genomic Epidemiology of Healthcare-Associated Respiratory Virus Infections.medRxiv [Preprint]. 2025 Apr 25:2025.04.20.25325828. doi: 10.1101/2025.04.20.25325828. medRxiv. 2025. PMID: 40313286 Free PMC article. Preprint.
-
Editorial: Pathogenesis, vaccines, and antivirals against respiratory viruses.Front Cell Infect Microbiol. 2023 May 8;13:1202251. doi: 10.3389/fcimb.2023.1202251. eCollection 2023. Front Cell Infect Microbiol. 2023. PMID: 37223845 Free PMC article. No abstract available.
References
-
- Foundation KF. World Lung Foundation report highlights prevalence of acute respiratory Infections Worldwide 1/22/2022. https://www.kff.org/news-summary/world-lung-foundation-report-highlights...
-
- Prevention CfDCa. Disease burden of flu. Updated 10/25/2018 Accessed January 19, 2022. https://www.cdc.gov/flu/about/burden/index.html#:~:text=While%20the%20ef...
-
- Prevention CfDCa. Respiratory syncytial virus infection (RSV). Updated 12/18/2020. 12/10/2021. https://www.cdc.gov/rsv/research/us-surveillance.html
Publication types
MeSH terms
Grants and funding
LinkOut - more resources
Full Text Sources
Other Literature Sources
Medical
Miscellaneous
