

Comparative chromatin accessibility upon BDNF stimulation delineates neuronal regulatory elements
- PMID: 35996956
- PMCID: PMC9396287
- DOI: 10.15252/msb.202110473
Comparative chromatin accessibility upon BDNF stimulation delineates neuronal regulatory elements
Abstract
Neuronal stimulation induced by the brain-derived neurotrophic factor (BDNF) triggers gene expression, which is crucial for neuronal survival, differentiation, synaptic plasticity, memory formation, and neurocognitive health. However, its role in chromatin regulation is unclear. Here, using temporal profiling of chromatin accessibility and transcription in mouse primary cortical neurons upon either BDNF stimulation or depolarization (KCl), we identify features that define BDNF-specific chromatin-to-gene expression programs. Enhancer activation is an early event in the regulatory control of BDNF-treated neurons, where the bZIP motif-binding Fos protein pioneered chromatin opening and cooperated with co-regulatory transcription factors (Homeobox, EGRs, and CTCF) to induce transcription. Deleting cis-regulatory sequences affect BDNF-mediated Arc expression, a regulator of synaptic plasticity. BDNF-induced accessible regions are linked to preferential exon usage by neurodevelopmental disorder-related genes and the heritability of neuronal complex traits, which were validated in human iPSC-derived neurons. Thus, we provide a comprehensive view of BDNF-mediated genome regulatory features using comparative genomic approaches to dissect mammalian neuronal stimulation.
Keywords: enhancers; gene expression; neuronal stimulation; post-mitotic neurons; transcription factors.
© 2022 The Authors. Published under the terms of the CC BY 4.0 license.
Figures
- A
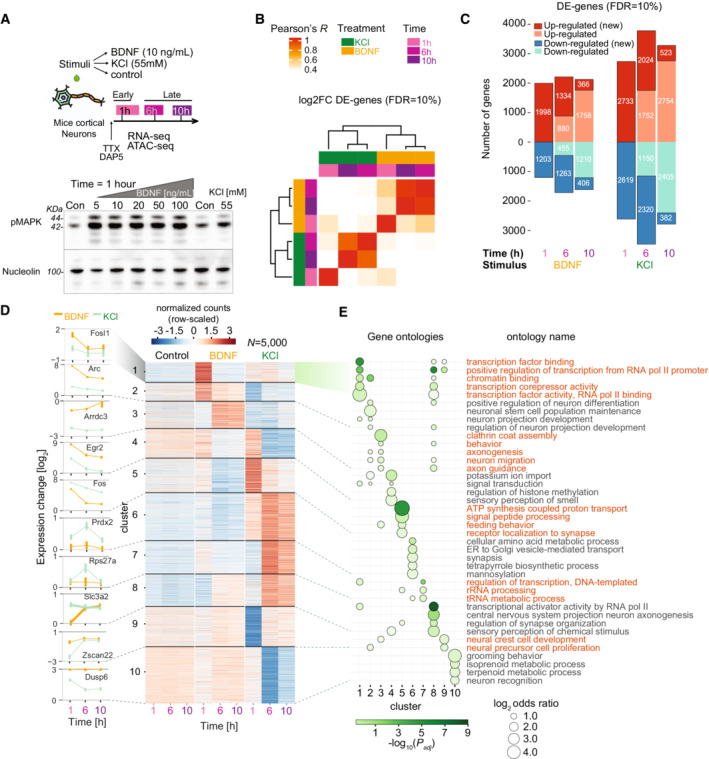
(top) Experimental design. Cultured CNs are stimulated with BDNF, KCl or no treatment (Control) and stimulated neurons are prepared for RNA‐seq and ATAC‐seq at three specific timepoints: early (1 h) and late (6 and 10 h); (bottom) Blot for pMAPK in neurons treated with KCl 55 mM and several concentrations of BDNF (Con = no stimulation). 44 and 42 kDa bands indicated with lines. Nucleolin is shown as internal control.
- B
Hierarchical clustering for all differentially expressed‐genes (DE‐genes, adjusted P‐value < 0.1, using Benjamini–Hochberg's correction) using correlation of log2‐fold changes when compared to unstimulated control samples at each timepoint.
- C
Number of DE‐genes at each timepoint and treatment combination (above and below zero indicates up‐ and down‐regulated genes, respectively). Darker shades indicate genes newly up‐/down‐regulated at a given timepoint (new).
- D
Partitioning around medoids clustering of expression dynamics using genewise‐scaled Z‐scores of top 5,000 DE‐genes from (c) with lowest adjusted P‐value (k = 10 clusters). Numbers indicate clusters. Left line plots indicate expression levels for signature genes selected for each cluster. 4,907 DE‐genes are also selected with FDR = 1% and more than 100 counts across samples.
- E
Gene ontology (GO) enrichment analysis for clusters shown in (d). Each ribbon shows clusters with their respective significant gene groups using topGO (Alexa et al, 2006). Up to five significant terms per cluster are shown (P‐values adjusted with BH). Circle sizes indicate enrichment of ontology genes in each cluster versus all other clusters. Names on the right y‐axis indicate ontology common names.
- A
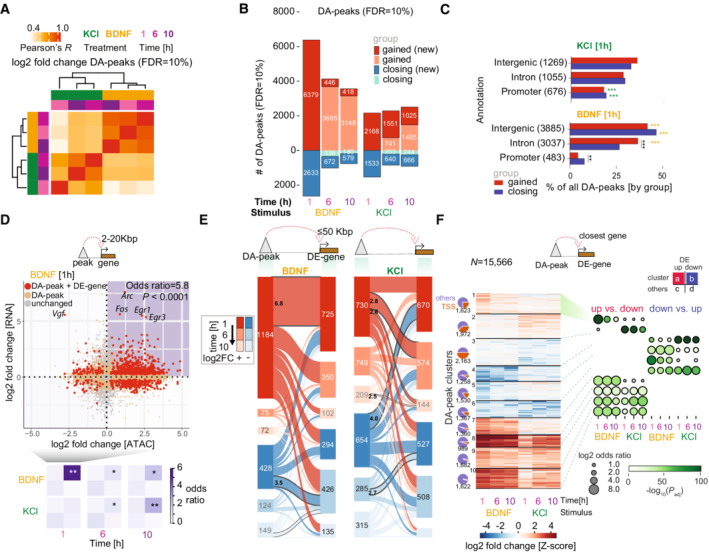
Hierarchical clustering for all differentially accessible peaks (DA‐peaks, adjusted P < 0.1, using Benjamini–Hochberg's correction) using correlation of log2‐fold changes when compared versus matched control samples.
- B
Number of DA‐peaks at each timepoint and treatment combination (above and below zero indicates gained and closing DA‐peaks, respectively). Darker shades indicate peaks newly gained/closing at a given timepoint (new).
- C
Percentage of gained and closing DA‐peaks grouped by top genomic annotations at the 1 h timepoint (by percentage). Numbers in parenthesis next to each annotation label indicate the absolute number of peaks associated with the annotation. Gray asterisks indicate within‐stimulation Fisher's exact test comparisons. Green/yellow asterisks indicate between‐stimulation comparisons, wherever one peak set is significantly enriched for one annotation (**P < 0.01; ***P < 0.001).
- D
(top) Association between DREs and gene expression at the BDNF 1 h timepoint. Each point indicates the log2‐fold change of an ATAC‐seq peak (x‐axis) and the gene expression of the closest gene (y‐axis) with distance between 2–20 Kbp. Colors indicate whether none (gray), only the peak (orange), or both peak and gene (red) show significant changes versus control neurons. (bottom) Enrichment for paired DA‐peak and DE‐gene in the four quadrants is summarized for BDNF and KCl. Asterisks indicate P‐values as corrected by a Benjamini–Hochberg procedure (*P < 0.05; **P < 0.01).
- E
Number of associations between DA‐peaks and DE‐genes for KCl (left) and BDNF (right). Sankey plot shows closest DE‐genes with distances < 50 kbp to DA‐peaks. Numbers in connecting areas between peaks and genes indicate association Z‐scores between DA‐peaks and DE‐genes (shown only if one is significant using Fisher's exact test (adjusted P < 0.1) and Z‐scores greater than 2.5), using a permutation approach for DA‐peaks and their connected DE‐genes while maintaining timewise changes (see Materials and Methods).
- F
(left) Partitioning around medoids clustering of accessibility dynamics using scaled Z‐scores for log2 fold changes of all DA‐peaks in (b) (k = 10 clusters). Venn diagrams indicate the proportion of peaks in each cluster associated with TSS or any other regulatory region (right) Enrichment of up‐regulated (DE‐up) versus down‐regulated (DE‐down) DE‐genes (up vs. down), and enrichment of DE‐down versus DE‐up genes (down vs. up) in closest genes within a cluster when compared with the same category in other clusters. Enrichments are calculated using Fisher's exact test, with adjusted P‐value correction via Benjamini–Hochberg.
- A
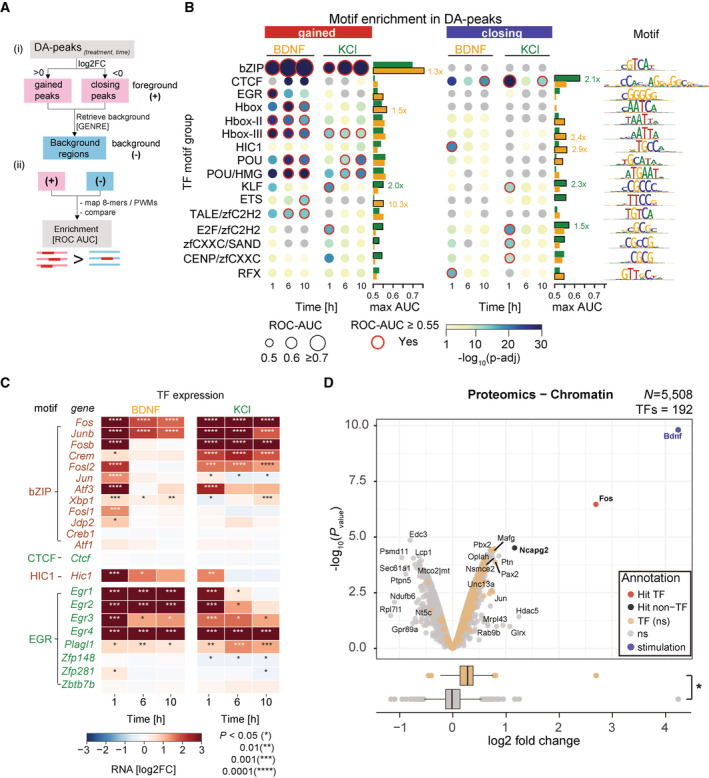
(i) DA‐peaks obtained at each timepoint are analyzed with GENRE (Genomically Equivalent Negative REgions) software to generate regions used as negative controls in enrichment tests (Mariani et al, 2017). (ii) A library of 8‐mers and position weight matrices (both motifs) are used to classify positive sequences (DA‐peaks) versus negative control regions as a receiver operating characteristic area under the curve value (ROC‐AUC).
- B
Enrichment of regulatory motifs in gained (left) and closing (right) DA peaks. Circle size indicates ROC‐AUC for recovery of positive versus negative regions. Circle color indicates P‐value significance (one‐sided Wilcoxon rank sums test). Red lines indicate adjusted P < 0.1 after Benjamini–Hochberg's correction. ROC‐AUC values lower than 0.5 are shown as gray circles. Barplots indicate maximum value observed for each TF group across all timepoints for brain‐derived neurotrophic factor (BDNF) (orange bar) and KCl (green bar). In relevant cases for main text fold changes are labeled.
- C
RNA expression changes for TFs related to 8‐mer groups bZIP, CTCF, HIC1, and EGR. Significant changes relative to control samples are shown with asterisks (Wilcoxon rank sums test, two‐sided).
- D
Proteomics of the chromatin‐bound fraction from mESC‐derived neurons 1 h after stimulation show significant enrichment of TFs upon stimulation with BDNF compared to KCl (boxplot, lower panel, Wilcoxon two‐tailed rank sum test, *P < 0.0001; central band indicates the median, boxes depict third and first quartiles and whiskers show the 1.5× IQR above and below the box). Out of 5,508 detected proteins, Fos shows a significant abundance increase after BDNF stimulation compared to KCl (¦log2 fold change¦ ≥ 1, adjusted P‐value < 0.05). High levels of BDNF (blue dot) are associated with experimental stimulation.
- A
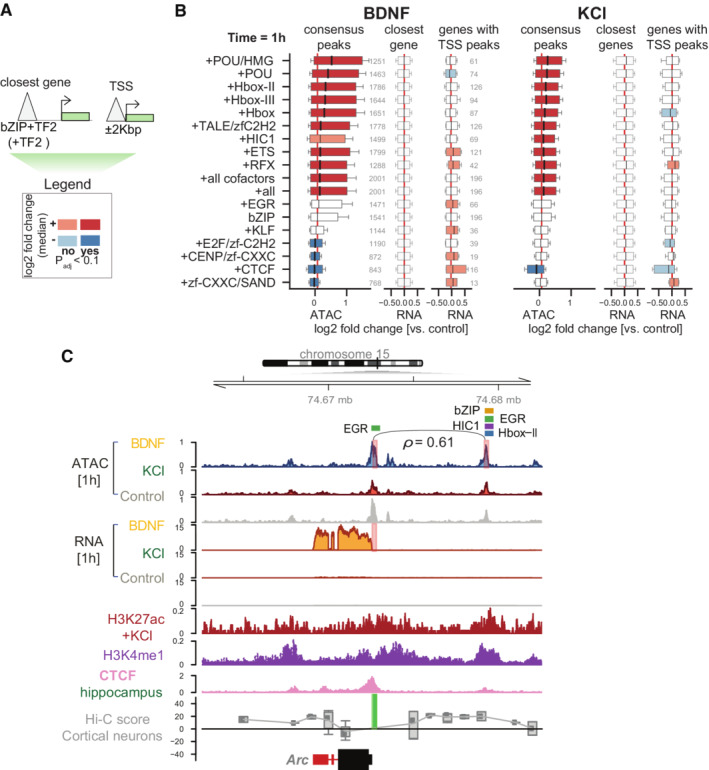
Scheme indicating annotation of ATAC‐seq peaks based on the presence of a bZIP motif (bZIP) and another TF (TF2). Peaks are linked to genes based on closest genomic distance (“closest gene”) or only if present in gene TSS (“TSS”). A log2‐fold change median indicates the difference in accessibility or expression log2‐fold changes between all peaks with bZIP+TF2 motifs versus only bZIP peaks, and equivalently for the expression values of genes connecting to those peaks.
- B
Genome‐wide changes at bZIP+TF2 and bZIP were measured as log2‐fold change distributions for accessibility (“consensus peaks”), genome‐wide closest genes (“closest gene”), and proximal target gene RNA levels (“genes with TSS peaks”) when bZIP motifs are co‐present with other TFs (TF2) in ATAC‐seq peaks versus bZIP alone. Significance is assessed using the one‐sided Wilcoxon rank sums test between peaks with k‐mers co‐present versus peaks with only bZIP. Absolute changes lower than 0.1 and not significant are shown as white boxplot bars.
- C
Chromosome 15 genome tracks neighboring Arc, displaying ATAC‐seq read counts per million (CPM); RNA‐seq CPM; H3K27ac normalized signal upon potassium chloride (KCl) stimulation, H3K4me1 (Malik et al, 2014); CTCF (Sams et al, 2016); and Cortical neurons Hi‐C data (Bonev et al, 2017). Red bars in ATAC‐seq tracks indicate gained DA‐peaks in BDNF, and red bars in RNA‐seq tracks indicate Arc differential expression in BDNF and KCl 1 h. Green blocks in Hi‐C tracks indicate anchor points for the calculation of contact scores, using shaman (Cohen et al, 2017). Line and Spearman's rho value indicate counts rank‐based correlation between highlighted peaks across all samples (Appendix Fig S4C). TF module names indicate the presence of 8‐mers in those peaks.
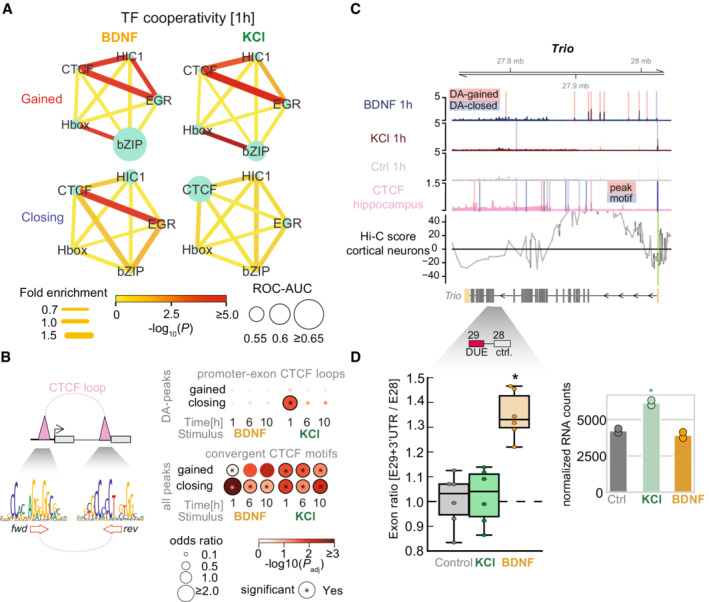
- A
Enrichment association networks between HIC1/bZIP/EGR/CTCF and Hbox based on results from (Fig 4A). Circle sizes indicate ROC‐AUC using motifs for each TF alone in those peaks. Edges weights and colors indicate fold enrichment for co‐occupied peaks versus single peaks, and significance of association. Calculations were done with SuperExactTest (Wang et al, 2015).
- B
(top‐left) Scheme depicting CTCF‐loop connecting promoters and exons. (bottom‐left) CTCF‐loops are enriched for convergent CTCF motifs. (top‐right) Enrichment of promoter‐exon CTCF loops in gained and closing DA‐peaks (loop annotations from Ruiz‐Velasco et al (2017)). (bottom‐right) Enrichment of convergent CTCF motifs with a distance of less than 50 Kbp in gained DA‐peaks and closing DA‐peaks over unchanged peaks as background.
- C
Genome tracks harboring the Trio gene. ATAC‐seq tracks indicate DA‐peaks (red highlight = gained DA‐peak; blue highlight = closing DA‐peak); CTCF tracks indicate the presence of motifs (pink highlight = ChIP‐seq peak; blue highlight = motif based on CTCF Position Weight Matrix). Below gene models, reference DUE exon position is highlighted (red); control exon (highlighted in gray) is used for comparison.
- D
(left) Exon ratio between E29 + 3′UTR and E28 fold changes 1 h after treatment with BDNF (orange), KCl (green), and control (gray). Central band indicates median. Boxes indicate interquartile range (IQR, or Q3‐Q1). Central band indicates median. High and low whiskers indicate first datum higher than Q3 + 1.5*IQR, or lower than Q1–1.5*IQR, respectively. Asterisk indicates significant changes versus control (t‐test, two‐sided; *P < 0.1). (N = 2, independent biological replicates). (right) Normalized gene counts for gene expression values versus control (*adjusted P‐value < 0.1 versus control).
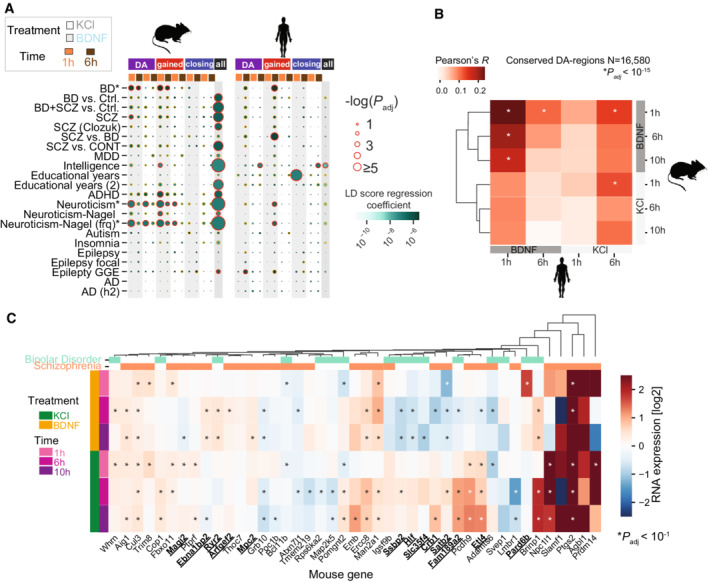
- A
Associations between chromatin accessibility DA‐peaks and genome‐wide association studies (GWAS) summary statistics. All DA‐peaks (DA), gained DA‐peaks (gained), closing DA‐peaks (closing), and consensus peaks (all) are fitted to summary statistics data of multiple GWAS studies (y‐axis). Circle color indicates linkage disequilibrium score regression coefficient (effect size), and circle size indicates association significance. Shadings indicate treatments. Timepoints are shown (orange = 1 h, brown = 6 h). Red lines indicate LD score regression coefficient adjusted P < 0.1 after BH correction. Orange lines indicate P < 0.1. (BD, Bipolar Disorder; SZ, Schizophrenia; BD + SZ, BP and SZ samples combined; MDD, Major Depressive Disorder; ADHD, Attention deficit hyperactivity disorder; AD, Alzheimer's Disease). Details for GWAS studies and preparation steps in Dataset EV4.
- B
Correlations between differentially accessible elements conserved mouse and human regions across conditions (N = 16,580). Asterisks indicate significance of Pearson's R correlation after correction with BH‐procedure.
- C
Mouse expression of GWAS Schizophrenia and Bipolar Disorder human genes with DA‐regions conserved and differentially accessible in the mouse genome. Genes with significant up‐ or down‐regulation for one treatment (BDNF or KCl) versus control, and not the other are in bold and underlined (Wald test, two‐sided).
References
-
- Aikawa Y, Morimoto K, Yamamoto T, Chaki H, Hashiramoto A, Narita H, Hirono S, Shiozawa S (2008) Treatment of arthritis with a selective inhibitor of c‐Fos/activator protein‐1. Nat Biotechnol 26: 817–823 - PubMed
-
- Alexa A, Rahnenfuhrer J, Lengauer T (2006) Improved scoring of functional groups from gene expression data by decorrelating GO graph structure. Bioinformatics 22: 1600–1607 - PubMed
Publication types
MeSH terms
Substances
Associated data
- Actions
Grants and funding
LinkOut - more resources
Full Text Sources
Molecular Biology Databases
Research Materials
