. 2022 Aug 23:11:giac080.
doi: 10.1093/gigascience/giac080.

Association mapping across a multitude of traits collected in diverse environments in maize

Affiliations

Association mapping across a multitude of traits collected in diverse environments in maize

Ravi V Mural et al. Gigascience. .

Abstract

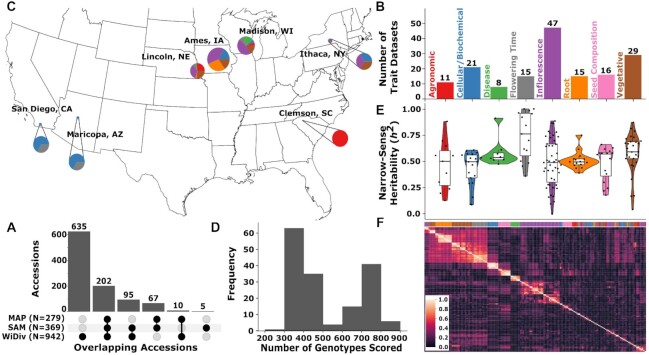
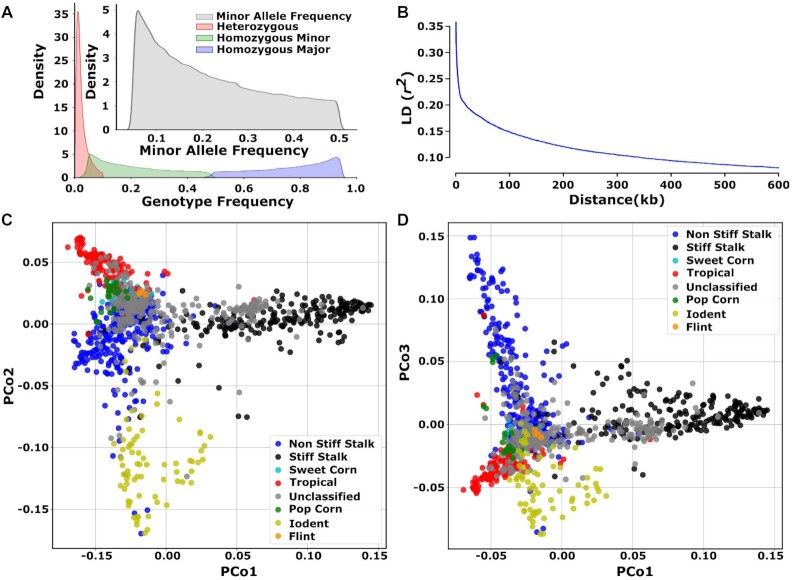
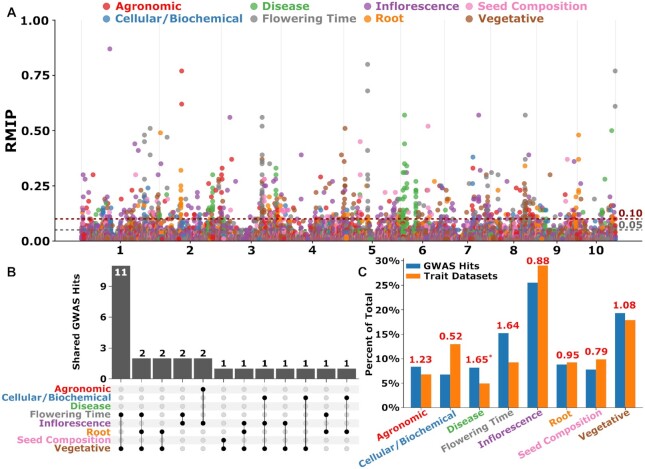
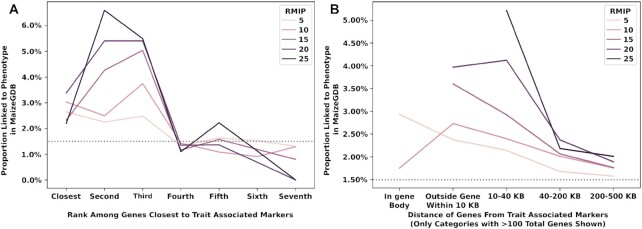
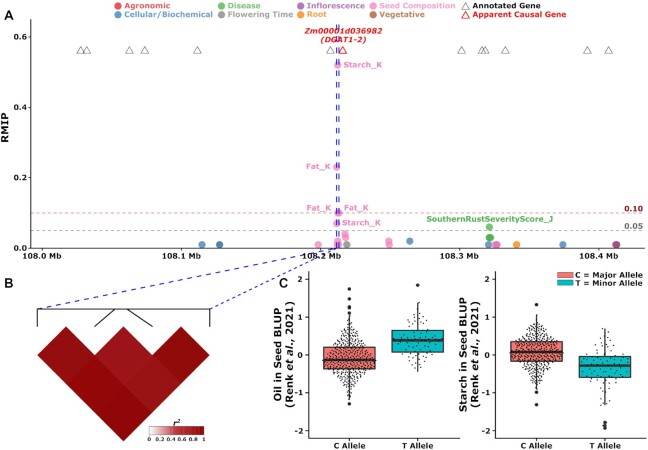
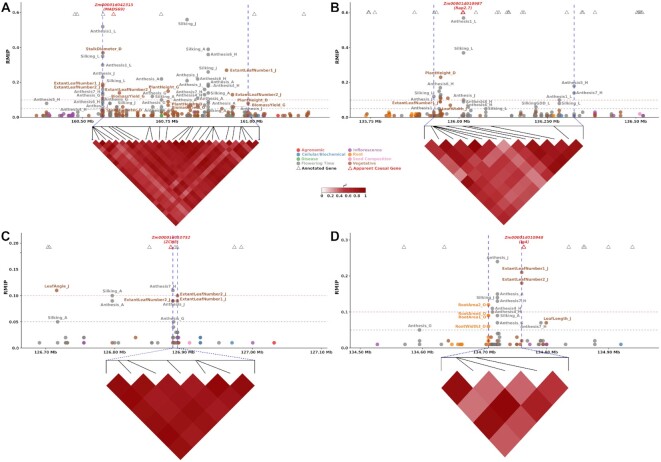
Classical genetic studies have identified many cases of pleiotropy where mutations in individual genes alter many different phenotypes. Quantitative genetic studies of natural genetic variants frequently examine one or a few traits, limiting their potential to identify pleiotropic effects of natural genetic variants. Widely adopted community association panels have been employed by plant genetics communities to study the genetic basis of naturally occurring phenotypic variation in a wide range of traits. High-density genetic marker data-18M markers-from 2 partially overlapping maize association panels comprising 1,014 unique genotypes grown in field trials across at least 7 US states and scored for 162 distinct trait data sets enabled the identification of of 2,154 suggestive marker-trait associations and 697 confident associations in the maize genome using a resampling-based genome-wide association strategy. The precision of individual marker-trait associations was estimated to be 3 genes based on a reference set of genes with known phenotypes. Examples were observed of both genetic loci associated with variation in diverse traits (e.g., above-ground and below-ground traits), as well as individual loci associated with the same or similar traits across diverse environments. Many significant signals are located near genes whose functions were previously entirely unknown or estimated purely via functional data on homologs. This study demonstrates the potential of mining community association panel data using new higher-density genetic marker sets combined with resampling-based genome-wide association tests to develop testable hypotheses about gene functions, identify potential pleiotropic effects of natural genetic variants, and study genotype-by-environment interaction.

Keywords: community association populations; maize; pleiotropy; quantitative genetics.


Conflict of interest statement

J.C.S. has equity interests in Data2Bio, LLC; Dryland Genetics LLC; and EnGeniousAg LLC. He is a member of the scientific advisory board of GeneSeek and currently serves as a guest editor for The Plant Cell. The other authors declare no conflicts of interest.

Figures

Figure 1:
Figure 1:
Characteristics of Maize Association Panel trait data sets. (A) Number of accessions that are represented in any of the 3 diversity panels. (B) Representation of 8 broad phenotypic categories among the 162 traits collected here. Category assignments for individual traits are provided in Supplementary Table S3. (C) Geographic distribution of trials where trait data sets were collected. Size of circles indicates number of traits collected at a specific geographic location. Colors of circles indicate types of trait data sets collected at that location. Labels for which colors correspond to which types of traits are given in panel B. (D) Distribution of the number of genotypes scored for a given trait. (E) Distributions of narrow-sense heritability values, across the same 8 broad phenotypic categories shown in panel B. Colors corresponding to the color key for phenotype classes are provided in panel B. (F) Correlations among the 162 trait data sets analyzed in this study. Trait data sets are clustered based upon absolute Spearman correlation value. Phenotype classes are indicated with color bar on top the x-axis with colors corresponding to the color key for phenotype classes provided in panel B.
Figure 2:
Figure 2:
Characteristics of Maize Association Panel Marker data sets. (A) Genotype frequency and minor allele frequency of the marker data set. (B) The genome-wide LD decay with maximum distance of 600 kilobases between 2 SNPs. (C) Genetic relationship among the accessions used in this study and visualized using multidimensional scaling/principal coordinate analysis of the distance matrix. The x- and y-axes represent first and second principal component coordinates. Each point is color coded by the heterotic group each accession belongs to. (D) Genetic relationship among the accessions used in this study and visualized using multidimensional scaling/principal coordinate analysis of the distance matrix. The x- and y-axes represent first and third principal component coordinates. Each point is color coded by the heterotic group each accession belongs to.
Figure 3:
Figure 3:
GWAS summary: multitrait peaks detected across phenotypic categories. (A) Combined Manhattan plot for GWAS using all 1,014 individuals screened using 18M markers. Dashed gray and red lines indicate the cutoff of 5% and 10% for statistical significance calculated based on RMIP value. Each chromosome is shown in the x-axis. The y-axis is the RMIP values ranging from 0 to 1. (B) An upset plot showing number of shared GWAS hits between various phenotypic categories. (C) Percent representation of GWAS hits for the number of trait data sets analyzed. Number on top of each pair of bars in each phenotypic category corresponds to the ratio of GWAS hits/number of trait data sets analyzed in each category. Note: The ratio was higher for the disease traits, but the traits in this category are essentially the same trait analyzed at different time points in a time-series manner; thus, most of the hits overlap among the traits, leading to an inflated ratio.
Figure 4:
Figure 4:
Probability of genes at different distances from peak SNP from GWAS is linked to phenotypes. (A) Gene positions of unique trait associations. First 7 genes closest to the GWAS peaks were selected and shown on the x-axis. (B) Gene order of unique trait associations. The distance of the genes from the trait-associated markers is shown on the x-axis.
Figure 5:
Figure 5:
Combined GWAS identifies peak associated with seed starch and fat. (A) View of resampling marker inclusion probability values for markers in a window from 108,211,603 to 108,213,234 on chromosome 6 spanning 200 kilobases upstream and downstream of the pleiotropic peak identified for seed starch and oil content. Only markers with resampling marker inclusion probability values ≥0.01 are shown. (B) The LD relationships between the significant SNPs within the peak. (C) Distributions of observed oil and starch content values reported in [32] for lines carrying either allele of the peak SNP located at position 108,212,338 bp.
Figure 6:
Figure 6:
GWAS peaks associated with multiple traits. (A) Local Manhattan plot with ±200 kilobases of pleiotropic peak on chromosome 3 from 160,559,294 to 160,989,691 bp. This peak is associated with MADS69 (Zm00001d042315). The phenotypes associated with this peak belongs to Flowering Time and Vegetative categories. The phenotypes associated with this peak are Anthesis1_L, Anthesis4_H, Anthesis6_H, Anthesis7_H, Anthesis_A, Anthesis_G, Anthesis_J, BiomassYield_G, ExtantLeafNumber1_J, ExtantLeafNumber2_J, PlantHeight_D, PlantHeight_G, Silking_A, Silking_J, Silking_L, and StalkDiameter_D. The vertical dashed lines show the peak boundary. (B) Local Manhattan plot with ±200 kilobases of pleiotropic peak on chromosome 8 from 135,928,821 to 136,325,345 bp. This peak is associated with Rap2.7 (Zm00001d010987). The phenotypes associated with this peak belong to Flowering Time and Vegetative categories. The phenotypes associated with this peak are Anthesis1_L, Anthesis5_H, Anthesis6_H, Anthesis7_H, Anthesis_A, Anthesis_G, Anthesis_J, ExtantLeafNumber1_J, LeafWidth_J, PlantHeight_D, SilkingGDD_L, and Silking_L. The vertical dashed lines show the peak boundary. (C) Local Manhattan plot with ±200 kilobases of pleiotropic peak on chromosome 8 from 126,884,534 to 126,891,234 bp. This peak is associated with ZCN8 (Zm00001d010752). The phenotypes associated with this peak belong to Flowering Time and Vegetative categories. The phenotypes associated with this peak are Anthesis7_H, Anthesis_G, Anthesis_J, ExtantLeafNumber1_J, and ExtantLeafNumber2_J. The vertical dashed lines show the peak boundary. (D) Local Manhattan plot with ±200 kilobases of pleiotropic peak on chromosome 8 from 134,706,389 to 134,759,977 bp. This peak is associated with lg4 (Zm00001d010948). The phenotypes associated with this peak belong to Flowering Time, Root, and Vegetative categories. The phenotypes associated with this peak are Anthesis4_H, Anthesis7_H, Anthesis_A, Anthesis_G, Anthesis_J, ExtantLeafNumber1_J, ExtantLeafNumber2_J, RootArea1_O, RootArea2_O, RootArea4_O, RootWidth3_O, Silking_A, and Silking_J. The vertical dashed lines show the peak boundary.

References

    1. Liu K, Goodman M, Muse S, et al. Genetic structure and diversity among maize inbred lines as inferred from DNA microsatellites. Genetics. 2003;165(4):2117–28. - PMC - PubMed
    1. Flint-Garcia SA, Thuillet AC, Yu J, et al. Maize association population: a high-resolution platform for quantitative trait locus dissection. Plant J. 2005;44(6):1054–64. - PubMed
    1. Leiboff S, Li X, Hu HC, et al. Genetic control of morphometric diversity in the maize shoot apical meristem. Nature Communications. 2015;6(1):1–10. - PMC - PubMed
    1. Hansey CN, Johnson JM, Sekhon RS, et al. Genetic diversity of a maize association population with restricted phenology. Crop Sci. 2011;51(2):704–15.
    1. Yang X, Gao S, Xu S, et al. Characterization of a global germplasm collection and its potential utilization for analysis of complex quantitative traits in maize. Mol Breeding. 2011;28(4):511–26.

Publication types

Substances