. 2022 Oct 1;323(4):L473-L483.
doi: 10.1152/ajplung.00137.2022. Epub 2022 Aug 23.

Differential airway remodeling changes were observed in patients with asthma COPD overlap compared to patients with asthma and COPD alone

Affiliations

Differential airway remodeling changes were observed in patients with asthma COPD overlap compared to patients with asthma and COPD alone

Surajit Dey et al. Am J Physiol Lung Cell Mol Physiol. .

Abstract

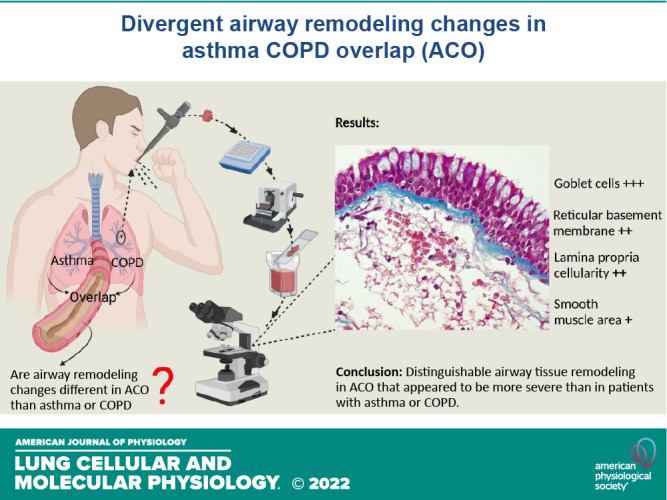
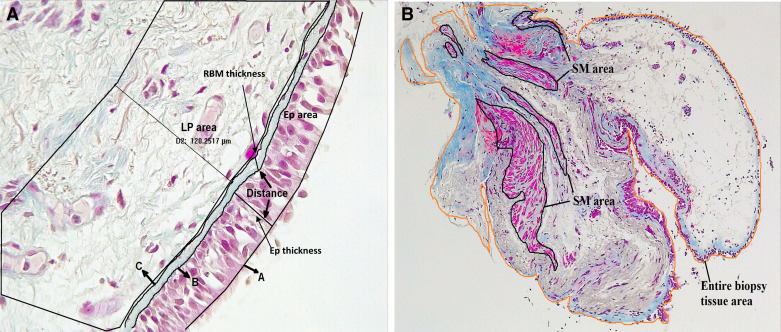
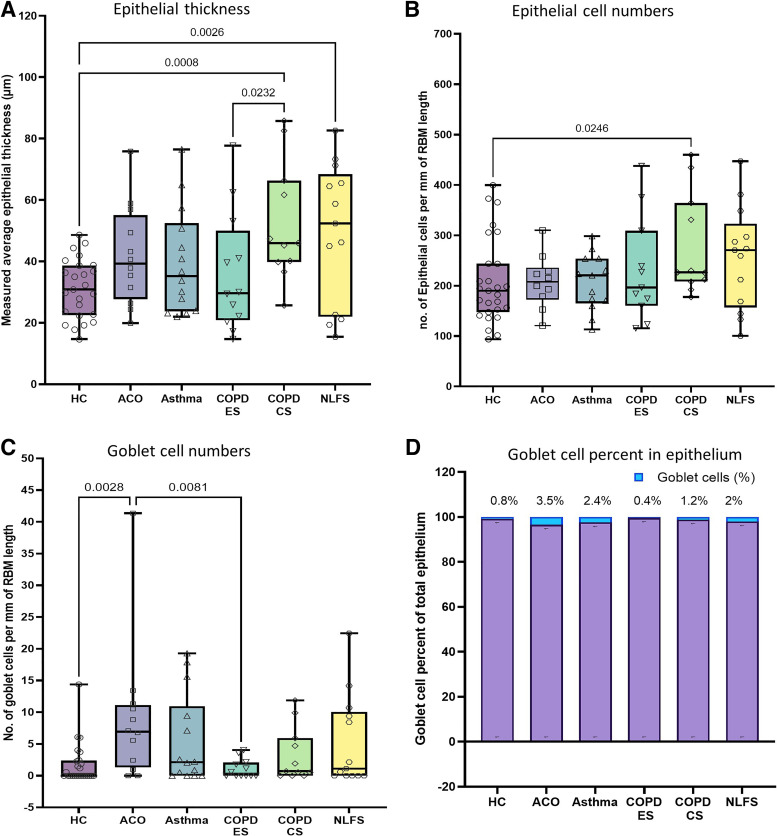
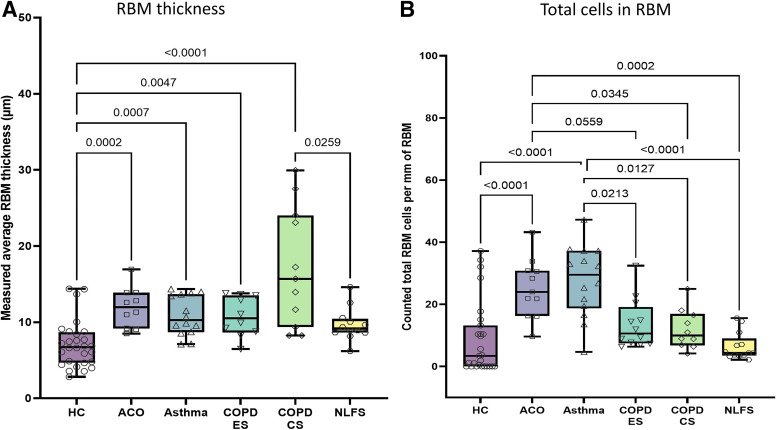
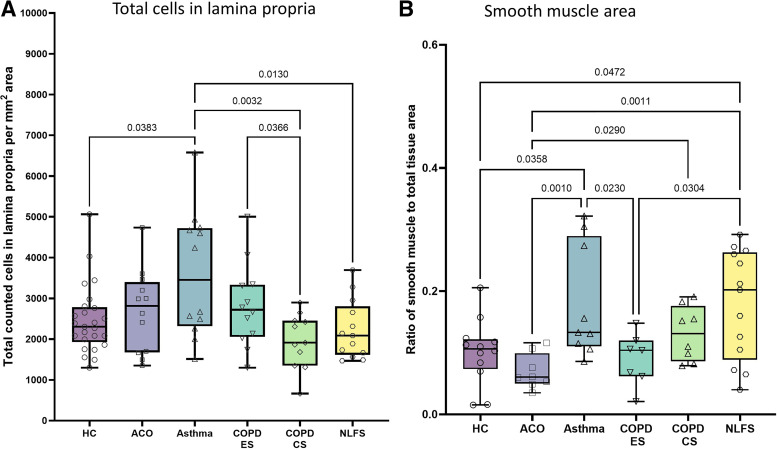
Management of patients with asthma COPD overlap (ACO) is clinically challenging due to insufficient evidence of pathological changes in these patients. In this cross-sectional study, we evaluated airway remodeling in endobronchial biopsies from a total of 90 subjects, which included 12 ACO, 14 patients with asthma, 12 COPD exsmokers (ES), 11 current smokers (CS), 28 healthy controls (HC), and 13 normal lung function smokers (NLFS). Tissue was stained with Masson's trichrome. Epithelium, goblet cells, reticular basement membrane (RBM), cellularity, lamina propria (LP), and smooth muscle (SM) changes were measured using Image-Pro Plus v7 software. Differential airway remodeling pattern was seen in patients with ACO. A limited change was noted in the ACO epithelium compared with other pathological groups. RBM was substantially thicker in patients with ACO than in HC (P < 0.0002) and tended to be thicker than in patients with asthma and NLFS. The total RBM cells were higher in ACO than in the HC (P < 0.0001), COPD-CS (P = 0.0559), -ES (P = 0.0345), and NLFS (P < 0.0002), but did not differ from patients with asthma. Goblet cells were higher in the ACO than in the HC (P = 0.0028) and COPD-ES (P = 0.0081). The total LP cells in ACO appeared to be higher than in HC, COPD-CS, and NLFS but appeared to be lower than in patients with asthma. Finally, SM area was significantly lower in the ACO than in patients with asthma (P = 0.001), COPD-CS (=0.0290), and NLFS (P = 0.0011). This first comprehensive study suggests that patients with ACO had distinguishable tissue remodeling that appeared to be more severe than patients with asthma and COPD. This study will help in informed decision-making for better patient management in clinical practice.

Keywords: COPD; airway remodeling; asthma; asthma COPD overlap; smoking.


Conflict of interest statement

S. S. Sohal reports personal fees from Chiesi outside the submitted work. None of the other authors has any conflicts of interest, financial or otherwise, to disclose.

Figures

None
Graphical abstract
Figure 1.
Figure 1.
A: representative image (×40 magnification) of large airway describing the epithelial (EP) area, lamina propria (LP) area (120-µm deep), and distance between two trace lines. In case of epithelial and reticular basement membrane (RBM) thickness, three trace lines: one at apical (A) and another at the basal surfaces (B) of epithelium, and another trace line at outer limit of lamina reticula (C) were drawn using automated software Image-Pro Plus. The average distance (in µm) between two lines was measured. B: representative image (×10 magnification) of large airway tissue describing the smooth muscle (SM) areas and entire biopsy tissue area.
Figure 2.
Figure 2.
Top, left to right: Masson trichrome-stained sections of large airway tissue from healthy control (A), asthma-COPD overlap (B), and asthma (C). Bottom, left to right: COPD current smokers (COPD-CS) (D), COPD exsmokers (COPD-ES) (E), and normal lung function smokers (NLFS) (F). Images are representative of tissues obtained from healthy control, NLFS, and pathological groups in ×40 magnification. Nuclei and muscle: magenta; RBM and collagen: blue; RBC: orange. Note thickened RBM, increased goblet cells, hypocellularity in asthma-COPD overlap airways. COPD, chronic obstructive pulmonary disease; Ep, epithelium; G, goblet cells; RBM, reticular basement membrane; MV, microvessels. *RBM cell. Scale bar, 50 µm.
Figure 3.
Figure 3.
Box plots showing the ANOVA results for epithelial thickness (A), epithelial cells/mm reticular basement membrane (RBM) (B), and goblet cells per mm of RBM (C) in healthy control (HC), patients with asthma COPD overlap (ACO), asthma, COPD exsmokers (COPD-ES), COPD current smokers (COPD-CS), and normal lung function smokers (NLFS). The box-and-whisker plots showing the minimum and the maximum value, the lower and the upper quartile and the horizontal line as median. P < 0.05 is significantly different. Insignificant P values are not shown in the plot. Column plot (D) showing percent contribution of goblet cells in the epithelial cell population. COPD, chronic obstructive pulmonary disease.
Figure 4.
Figure 4.
Box plots showing the ANOVA results for reticular basement membrane (RBM) thickness (A) and RBM cells per mm of RBM (B) in healthy control (HC), patients with asthma COPD overlap (ACO), asthma, COPD exsmokers (COPD-ES), COPD current smokers (COPD-CS), and normal lung function smokers (NLFS). The box-and-whisker plots showing the minimum and the maximum value, the lower and the upper quartile and the horizontal line as median. P < 0.05 is significantly different. Insignificant P values are not shown in the plot. COPD, chronic obstructive pulmonary disease.
Figure 5.
Figure 5.
Box plots showing the ANOVA results for lamina propria (LP) total cells/mm2 (A) and smooth muscle area (B) in healthy control (HC), patients with asthma COPD overlap (ACO), asthma, COPD exsmokers (COPD-ES), COPD current smokers (COPD-CS), and normal lung function smokers (NLFS). The box-and-whisker plots showing the minimum and the maximum value, the lower and the upper quartile and the horizontal line as median. P < 0.05 is significantly different. Insignificant P values are not shown in the plot. COPD, chronic obstructive pulmonary disease.
Figure 6.
Figure 6.
Box plots showing the Mann–Whitney test results for epithelial thickness (A), epithelial cells/mm reticular basement membrane (RBM) (B), goblet cells/mm of RBM (C), RBM thickness (D), RBM cells/mm RBM (E), lamina propria cells/mm2 (F), and smooth muscle area (G) in patients with asthma COPD overlap (ACO) and asthma with ICS and no-ICS. The box-and-whisker plots showing the minimum and the maximum value, the lower and the upper quartile and the horizontal line as median. P < 0.05 is significantly different between ICS and no-ICS groups. COPD, chronic obstructive pulmonary disease. ICS, inhaled corticosteroids.

References

    1. Global Initiative for Asthma. Global Strategy for asthma management and prevention [Online]. www.ginasthma.org [2021 Jan 05].
    1. Global Initiative For Chronic Obstructive Lung Disease. Global Strategy for the Diagnosis, Management, and Prevention of Chronic Obstructive Pulmonary Disease [Online]. https://goldcopd.org/ [2021 Jan 05].
    1. Bergeron C, Tulic MK, Hamid Q. Airway remodelling in asthma: from benchside to clinical practice. Can Respir J 17: e85–e93, 2010. - PMC - PubMed
    1. Jeffery PK. Remodeling and inflammation of bronchi in asthma and chronic obstructive pulmonary disease. Proc Am Thorac Soc 1: 176–183, 2004. doi: 10.1513/pats.200402-009MS. - DOI - PubMed
    1. Eapen M, Myers S, Walters E, Sohal S. Airway inflammation in chronic obstructive pulmonary disease (COPD): a true paradox. Expert Rev Respir Med 11: 827–839, 2017. doi: 10.1080/17476348.2017.1360769. - DOI - PubMed

Publication types