. 2022 Oct 3;219(10):e20220759.
doi: 10.1084/jem.20220759. Epub 2022 Aug 23.

Monocyte-derived macrophages aggravate pulmonary vasculitis via cGAS/STING/IFN-mediated nucleic acid sensing

Affiliations

Monocyte-derived macrophages aggravate pulmonary vasculitis via cGAS/STING/IFN-mediated nucleic acid sensing

Nina Kessler et al. J Exp Med. .

Erratum in

  • Correction: Monocyte-derived macrophages aggravate pulmonary vasculitis via cGAS/STING/IFN-mediated nucleic acid sensing.
    Kessler N, Viehmann SF, Krollmann C, Mai K, Kirschner KM, Luksch H, Kotagiri P, Böhner AMC, Huugen D, de Oliveira Mann CC, Otten S, Weiss SAI, Zillinger T, Dobrikova K, Jenne DE, Behrendt R, Ablasser A, Bartok E, Hartmann G, Hopfner KP, Lyons PA, Boor P, Rösen-Wolff A, Teichmann LL, Heeringa P, Kurts C, Garbi N. Kessler N, et al. J Exp Med. 2022 Dec 5;219(12):e2022075911022022c. doi: 10.1084/jem.2022075911022022c. Epub 2022 Nov 11. J Exp Med. 2022. PMID: 36367753 Free PMC article. No abstract available.

Abstract

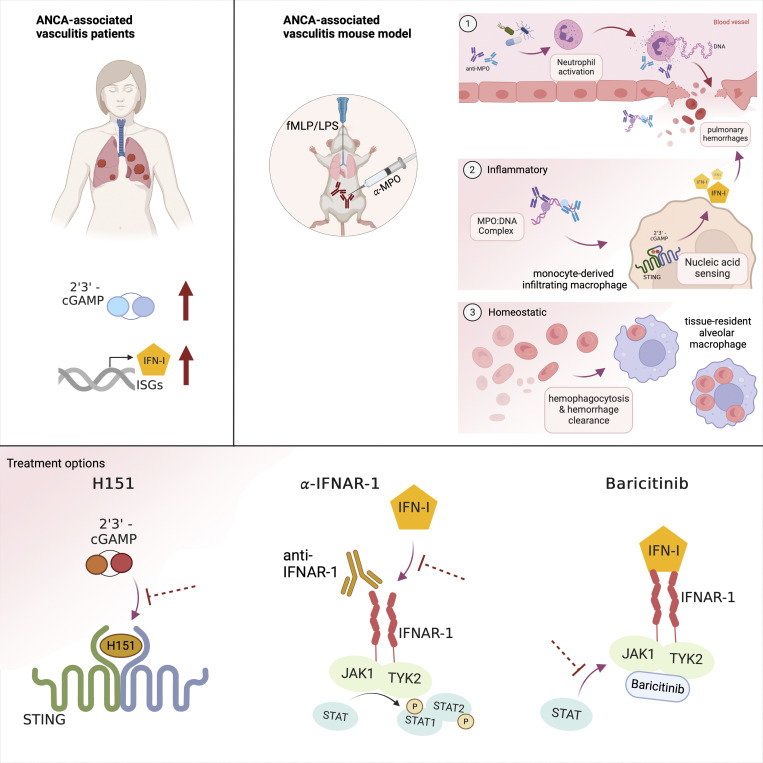
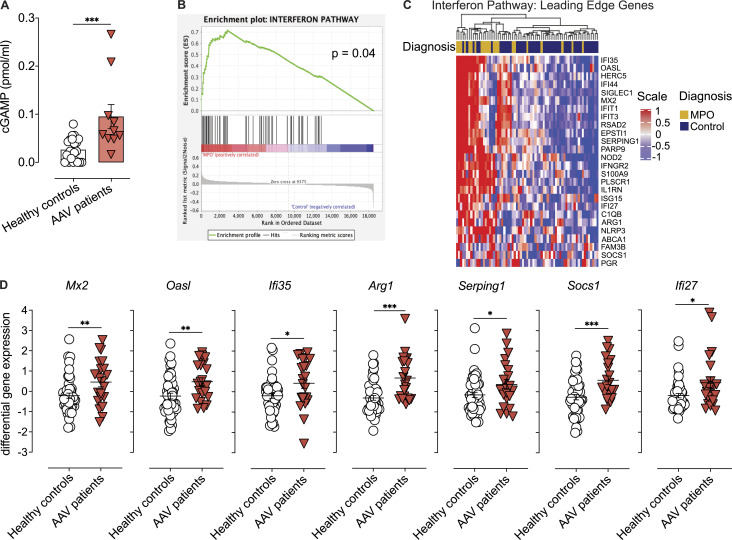
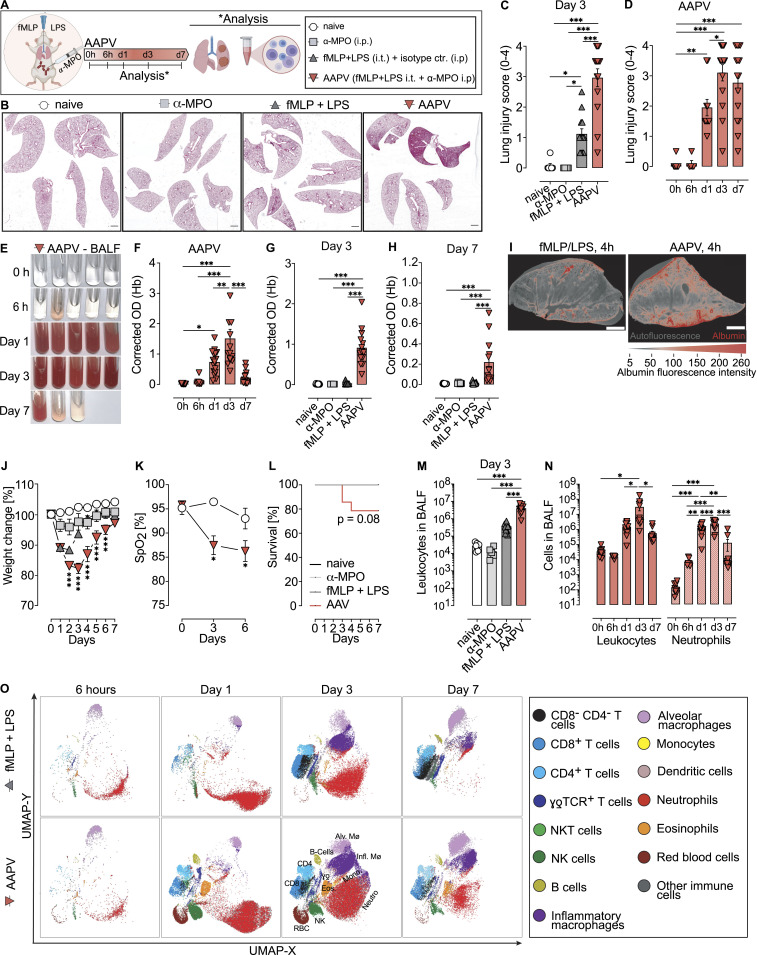
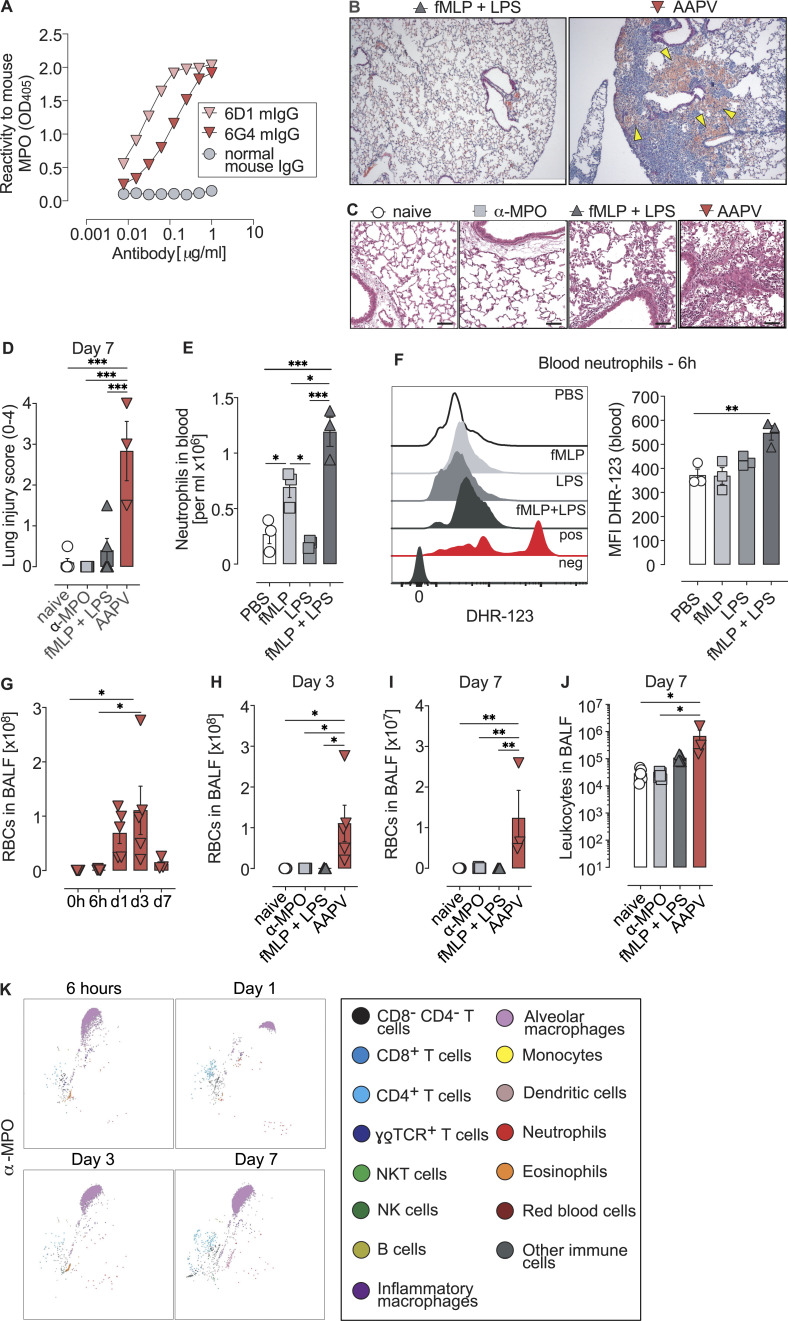
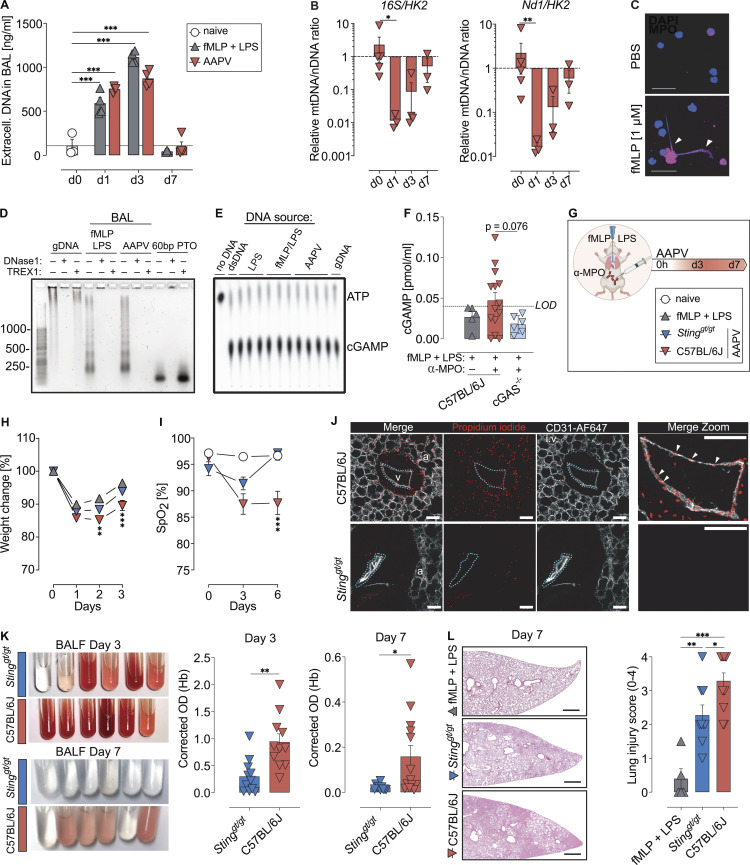
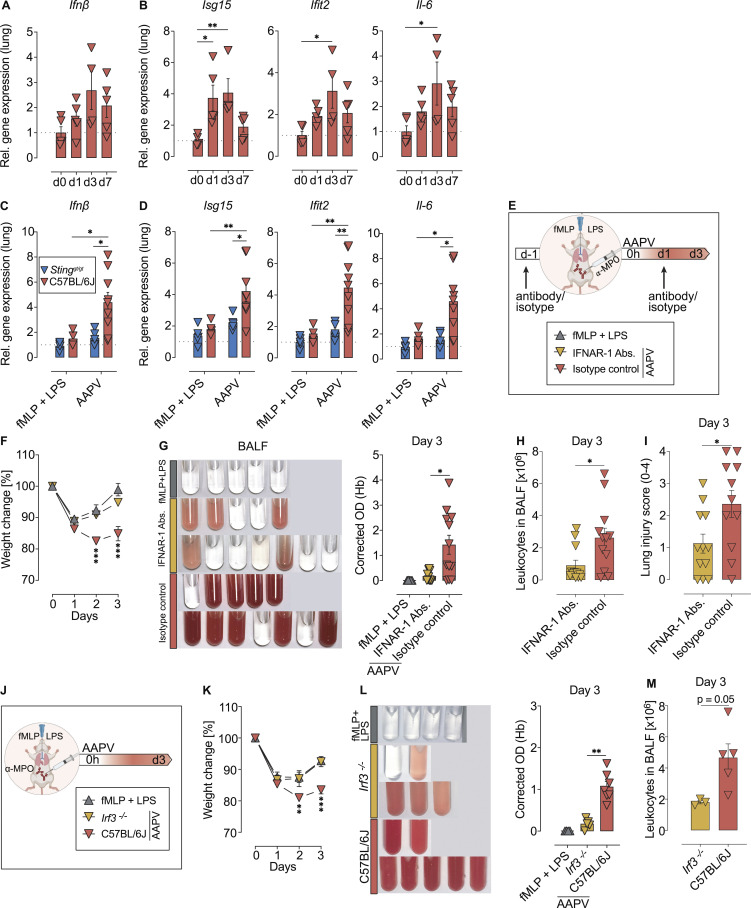
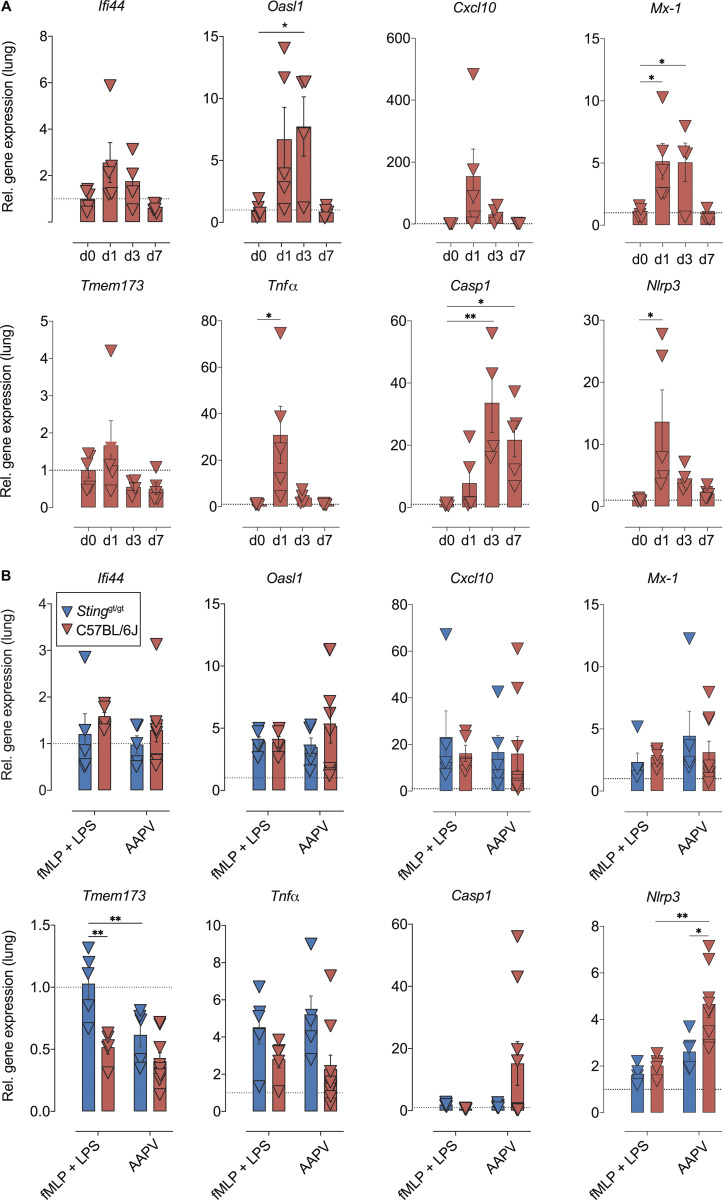
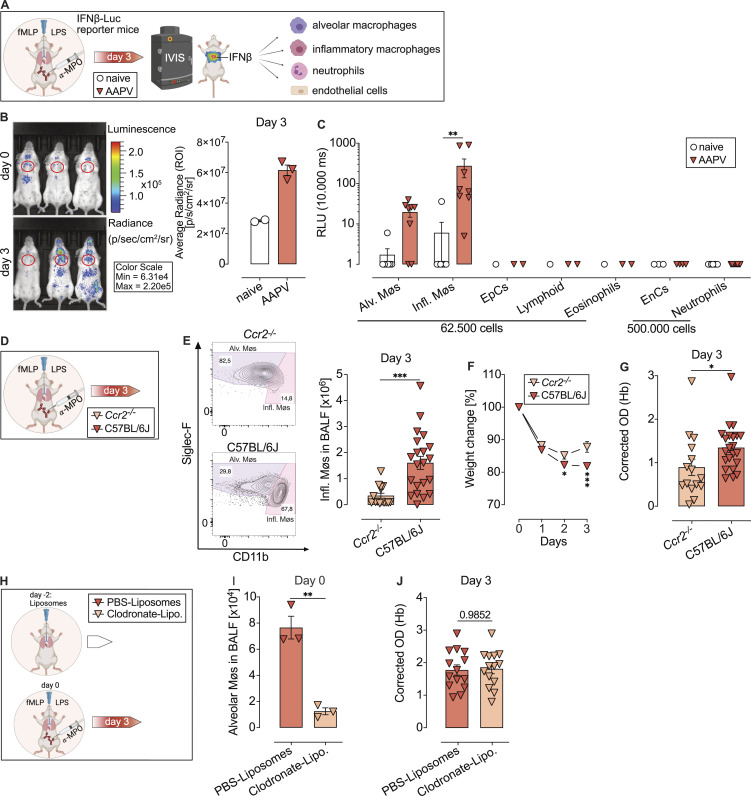
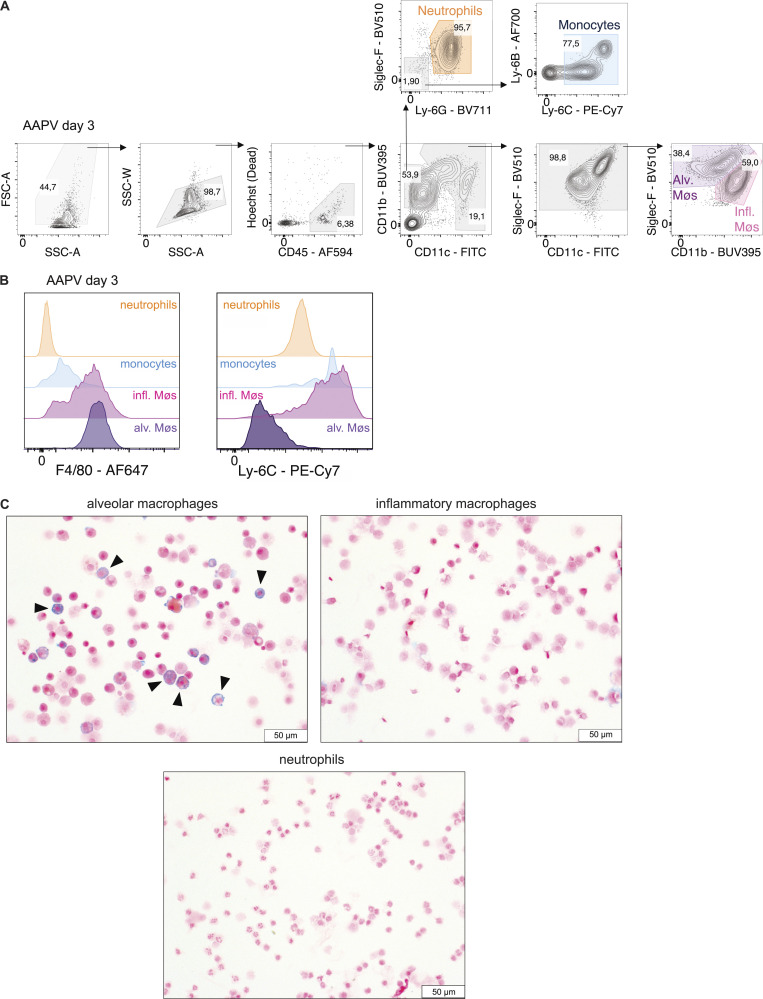
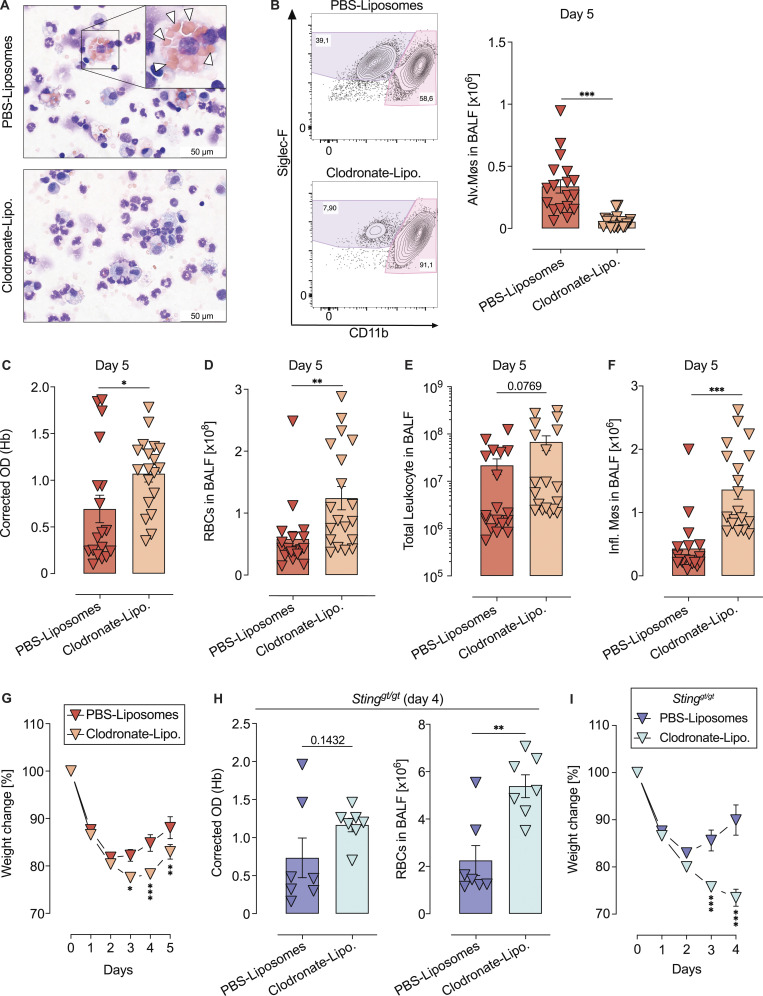
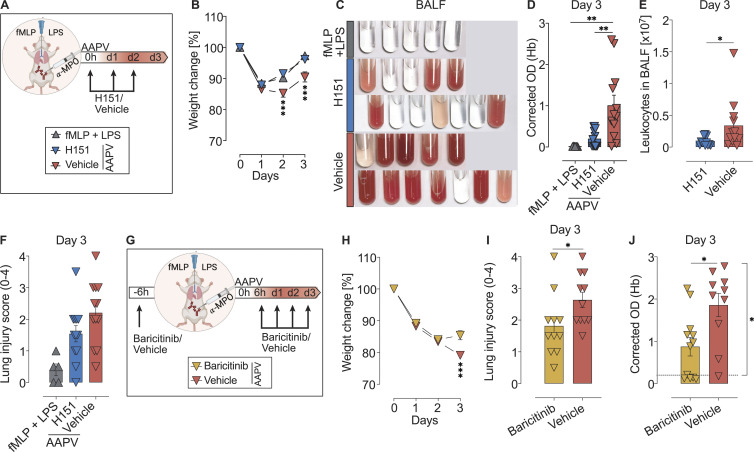
Autoimmune vasculitis is a group of life-threatening diseases, whose underlying pathogenic mechanisms are incompletely understood, hampering development of targeted therapies. Here, we demonstrate that patients suffering from anti-neutrophil cytoplasmic antibodies (ANCA)-associated vasculitis (AAV) showed increased levels of cGAMP and enhanced IFN-I signature. To identify disease mechanisms and potential therapeutic targets, we developed a mouse model for pulmonary AAV that mimics severe disease in patients. Immunogenic DNA accumulated during disease onset, triggering cGAS/STING/IRF3-dependent IFN-I release that promoted endothelial damage, pulmonary hemorrhages, and lung dysfunction. Macrophage subsets played dichotomic roles in disease. While recruited monocyte-derived macrophages were major disease drivers by producing most IFN-β, resident alveolar macrophages contributed to tissue homeostasis by clearing red blood cells and limiting infiltration of IFN-β-producing macrophages. Moreover, pharmacological inhibition of STING, IFNAR-I, or its downstream JAK/STAT signaling reduced disease severity and accelerated recovery. Our study unveils the importance of STING/IFN-I axis in promoting pulmonary AAV progression and identifies cellular and molecular targets to ameliorate disease outcomes.


Conflict of interest statement

Disclosures: S.F. Viehmann started a job at AstraZeneca GmbH in the respiratory and immunology department after writing the original draft. At this time, research contributions submitted for publication were completed. R. Behrendt reported grants from Hoffmann-La Roche, ISD Immunotech, and IFM Therapeutics outside the submitted work. A. Ablasser is a co-founder of IFM-Due. P.A. Lyons reported grants from Medical Research Council during the conduct of the study; and holds founding equity in and consult for PredictImmune Ltd. No other disclosures were reported.

Figures

None
Graphical abstract
Figure 1.
Figure 1.
Patients with ANCA-associated vasculitis show increased cGAS activation and IFN-I signature. (A) cGAMP concentration in PBMCs isolated from healthy donors or patients with active anti-MPO-associated vasculitis (patient cohort I; Table S1). Each dot is an individual donor (n = 22 for healthy, n = 10 for MPO-vasculitis donors). Columns represent mean ± SEM. (B) GSEA in patients undergoing active anti-MPO-associated vasculitis (n = 21, patient cohort II; Table S2). (C) Heatmap of IFN-I pathway leading-edge gene expression levels in patients with active anti-MPO-associated vasculitis (MPO, n = 21) or in remission (Control, n = 47; patient cohort II). (D) Expression levels for selected ISGs from analysis in C. Asterisks indicate the significance level of unpaired t test (A and D) and familywise-error rate (B) *, P < 0.05; **, P < 0.01; ***, P < 0.001.
Figure 2.
Figure 2.
Anti-MPO antibodies and low-dose bacterial ligands induce severe pulmonary vasculitis in a novel mouse model of pulmonary vasculitis. (A) Schematic of AAPV induction. Anti-MPO, monoclonal antibodies 6D1 and 6G4. (B) H&E staining of lung cryosections 3d after disease induction from the indicated mouse groups. Scale bar = 500 µm. (C and D) Lung injury score (0–4) quantified from H&E lung cryosections. (E–H) Representative photographs (E) and quantification (F–H) of pulmonary hemorrhages in BALF. Treatments and time points as indicated. (I) Light-sheet fluorescence microscope images from clarified left lungs isolated from mice treated as indicated and injected with Texas red–labeled albumin. Shown is a representative of two mice. Scale bar = 1 mm. (J–L) Kinetics of weight change (J), SpO2 (%) in peripheral blood (K), and survival (L) of mice as indicated in A. (M–O) Flow cytometric quantification (M and N) and UMAP dimensionality reduction plots (O) of immune cells in BALF. Cell identity gates are shown in Fig. S2. Each symbol represents an individual mouse. Shown is mean ± SEM. Unless otherwise stated, shown are pooled data from three experiments (C, D, F, G, H, J, M and N, n = 11–17 mice/group) or two experiments (K, n = 10 mice/group); α-MPO group shows a total of five (C, G, H, J, L, and M) mice. Asterisks indicate the significance level of one-way ANOVA with Tukey’s multiple comparisons test (C, D, F–H, M, and N) or two-way ANOVA with Dunnett’s’ multiple comparisons test (J and K) and curve comparison with log-rank (Mantel–Cox) test (L). *, P < 0.05; **, P < 0.01; ***, P < 0.001. OD, OD400–OD600.
Figure S1.
Figure S1.
Anti-MPO antibodies and low dose bacterial ligands synergize to induce severe pulmonary vasculitis in a novel mouse model of pulmonary vasculitis. (A) ELISA for recombinant MPO with the mAb clones 6D1 and 6G4 indicating specificity for mouse MPO. (B and C) H&E stainings of lung cryosections of mice treated as in Fig. 2 A. Yellow arrowheads indicate areas with hemorrhages. Scale bar = 500 µm (B), 100 µm (C). (D) Lung injury score 7 d after treatment of mice as in Fig. 2 A. (E) Quantitative flow cytometry analysis of circulating neutrophils in blood of wild-type mice 6 h after indicated treatments. (F) Representative flow cytometric histograms (left) and quantification of ROS production (DHR123 mean flourescence intensity [MFI]) by blood neutrophils from mice treated as in E. pos, positive control (PMA); neg, fluorescence minus one for DHR123 in untreated neutrophils. (G–J) RBC (G–I) and leukocyte (J) counts in BALF of the indicated mice. (K) UMAP dimensionality reduction of immune cells in BALF of mice treated only with anti-MPO antibodies using identity gates in Fig. S2. Results for individual mice are shown as dots. Data is representative of at least two independent experiments (mean ± SEM). Asterisks indicate the significance level of one-way ANOVA with Tukey’s multiple comparisons test (D–G, I, and J). *, P < 0.05; **, P < 0.01; ***, P < 0.001.
Figure S2.
Figure S2.
Cell identity gates used in this study. Hierarchy of flow cytometry dot plots and gates of lung singe-cell suspensions from wild-type mice 3 d after AAPV induction used to identify different cell populations. Leukocytes: single Hoechst33258 CD45+ events. Red blood cells: single Hoechst33258 CD45 Ter119+ events. Eosinophils: CD11b+ CD11c Siglec-F+ Ly-6G leukocytes. Neutrophils: CD11b+ CD11c Siglec-F−/+ Ly-6G+ leukocytes. Monocytes: CD11b+ CD11c Siglec-F Ly-6G NK1.1 Ly-6B+ leukocytes. Alveolar macrophages (Alv. Møs): CD11c+ Siglec-Fhi CD11b−/int leukocytes. Inflammatory (Infl.) Møs: CD11c+ Siglec-Fint CD11bint/hi leukocytes. cDC1: Siglec-F CD11c+ MHC-II+ CD103+ CD11b leukocytes. cDC2/mo-DCs: Siglec-F CD11c+ MHC-II+ CD103 CD11b+ leukocytes. B cells: CD11c CD11b CD3ε CD19+ leukocytes. CD4 α/β T cells: CD11c CD11b CD3ε+ CD19 TCRβ+ NK1.1 CD8 CD4+ leukocytes. CD8 α/β T cells: CD11c CD11b CD3ε+ CD19 TCRβ+ NK1.1 CD8+ CD4 leukocytes. DN α/β T cells: CD11c CD11b CD3ε+ CD19 TCRβ+ NK1.1 CD8 CD4 leukocytes. ɣδ T cells: CD11c CD11b CD3ε + CD19 TCRβ ɣδ TCR+. Natural killer (NK) cells: CD11c CD11b−/+ CD3ε+ CD19 TCRβ+ NK1.1+ leukocytes. NKT cells: CD11c CD11b CD3ε+ CD19 TCRβ+ NK1.1+ leukocytes.
Figure 3.
Figure 3.
STING promotes progression of AAPV. (A) Cell-free DNA in the BALF of mice treated as indicated. Each dot represents an individual mouse. Data is representative of two experiments and 3–4 mice/group. (B) Cell-free mtDNA (16S or Nd1) to nuclear (n) DNA (HK29) ratio obtained by qRT-PCR in BALF of AAPV mice at the indicated time points after disease induction. Data is representative of two independent experiments (n = 3–5 mice/group). (C) Confocal microscopy images of neutrophils treated as indicated and stained with anti-MPO mAbs. Scale bar, 50 µm. Arrowheads indicate extracellular MPO-decorated DNA. (D) Gel electrophoresis of gDNA, DNA isolated from BALF of mice 3 d after treatment as indicated, or 60mer TREX1-protected phosphorylated DNA treated or not with DNases ex vivo as indicated. Data is representative of two experiments with pooled DNA isolated from three mice per group. (E) cGAS activation assay using recombinant cGAS, ATP, and either dsDNA (lane 2), gDNA (lane 13), or DNA isolated from the BALF of mice treated 3 d earlier with LPS (lanes 3–5), fMLP/LPS (lanes 6–8) or fMLP/LPS + anti-MPO (lanes 9–12). Each lane represents an independent DNA sample. (F) cGAMP quantification in the BALF of mice treated as indicated 3 d earlier. Shown are pooled data from two independent experiments (n = 5-14 mice/group), each dot representing a single mouse. LOD, limit of detection. (G) Schematic of experimental design in wild-type or Stinggt/gt mice. (H and I) Kinetics of weight change (H) and SpO2 (%) in peripheral blood (I) of mice treated as in G. Shown are pooled data from two independent experiments (n = 10 [H] or 5 [I] mice/group). (J) Confocal microscopy images of unfixed vibratome lung slices showing alveoli (a) and a medium-sized pulmonary blood vessel (v) stained in vivo with anti-CD31 and ex vivo with propidium iodide. Scale bar = 100 µm. (K) Representative photographs and quantification of pulmonary hemorrhages in BALF. Treatments and time points as in G. Shown are pooled data from three independent experiments (n = 11–13 mice/group). (L) H&E staining of lung sections and lung injury score (0–4) for mice treated as indicated. Each dot is an individual mouse from two pooled independent experiments (n = 5–9 mice/group). Scale bar, 500 µm. Bars and line graphs represent mean ± SEM. Asterisks indicate the significance level of unpaired t test (F and K), one-way ANOVA with Kurskal–Wallis multiple comparisons test (B) or Tukey’s multiple comparisons test (L) and two-way ANOVA with Šídák's multiple comparisons test (A, H, and I). *P < 0.05; **, P < 0.01.***, P < 0.001.
Figure 4.
Figure 4.
IFNAR-1 and IRF3 promote severe anti-MPO-associated pulmonary vasculitis. (A–D) Relative expression of Ifnβ gene (A and C) and indicated ISGs (B and D) at different time points after AAPV induction in wild-type mice (A and B) or on day 3 in the indicated mice (C and D). Each dot is an individual mouse. Data are representative of two independent experiments (n = 4–9 mice/group). (E) Schematic representation of experiment with IFNAR-1 blocking antibodies. (F–I) Weight change (F), hemorrhages in BALF (G), leukocyte counts (H), and lung injury score (I) in wild-type mice treated as indicated. Each dot is an individual mouse. Shown are pooled results from two independent experiments (n = 5–12 mice/group). (J) Schematic representation of experiments with Irf3−/− mice. (K–M) Weight change (K), hemorrhages in BALF (L), and leukocyte counts (M) in wild-type and Irf3−/− mice treated as indicated. Each dot is an individual mouse. Shown are pooled results from two independent experiments (n = 3–7 mice/group) or a representative of two independent experiments (M, n = 3–5 mice/group). Bars and line graphs represent mean ± SEM. Asterisks indicate the significance level of unpaired t test (H, I, and M), one-way ANOVA with Dunnett’s multiple comparisons test (A and B) or Tukey’s multiple comparisons test (G and L) and two-way ANOVA with Šídák's multiple comparisons test (C, D, F, and K). *, P < 0.05; **, P < 0.01; ***, P < 0.001.
Figure S3.
Figure S3.
IFN-I signature in the lung of mice with autoimmune AAPV. (A) Relative gene expression in the lungs of C57BL/6J at the indicated time points after AAPV induction. (B) Relative gene expression in the lungs of the indicated mice 3 d after treatment as indicated. Each dot is a single mouse (n = 5–8 mice/group). Bars represent mean ± SEM. Asterisks indicate the significance level of one-way ANOVA with Dunnett’s multiple comparisons test (A) or two-way ANOVA with Šídák's multiple comparisons test (B) *, P < 0.05; **, P < 0.01.
Figure 5.
Figure 5.
Infiltrating macrophages produce IFN-I and enhance severity of AAPV. (A) Schematic representation to measure Ifnβ promoter activity in reporter mice by in vivo and ex vivo bioluminescence imaging. (B) Representative photographs of Ifnβ-Luc reporter mice treated as indicated, and bioluminescence quantification of the region of interest (ROI, red gate). Quantification is pooled of two independent experiments (n = 2–3 mice/group). (C) Ex vivo bioluminescence quantification of FACS-sorted cell populations (gates in Fig. S2 and Fig. S4 A). Each dot represents cells from an individual mouse. Shown are data pooled from three independent experiments for alv. Møs, infl. Møs, EnC, neutrophils, and one experiment for the rest. Alv, alveolar; infl, infiltrating; Møs, macrophages; EpCs, epithelial cells; EnCs, endothelial cells. (D) Schematic representation of AAPV induction in mice. (E) Flow cytometric plot showing percentages of alv. and infl. Møs gated as in Fig. S2, and respective quantification. Shown are pooled data from two independent experiments (n = 15–22 mice/group). (F and G) Weight change (F) and hemorrhages in BALF (G) in indicated mice undergoing AAPV. Shown are pooled data from two independent experiments (n = 15–22 mice/group). (H) Schematics of treatment with liposomes before onset of AAPV. Lipo, liposomes. (I) Quantification of alv. Møs on the day of AAPV induction. Each dot represents an individual mouse from a representative of two independent experiments with n = 3 mice/group. (J) Quantification of hemorrhages in BALF at the peak of AAPV severity (day 3). Each dot represents an individual mouse from two pooled independent experiments with n = 14 mice/group. Bar and line graphs show mean ± SEM. Asterisks indicate the significance level of unpaired t test (E, G, and I), one-way ANOVA with Tukey’s multiple comparisons test (J) and two-way ANOVA with Šídák's multiple comparisons test (C and F) *, P < 0.05; **, P < 0.01; ***, P < 0.001.
Figure S4.
Figure S4.
Characteristics of tissue-resident alveolar macrophages and infiltrating inflammatory macrophages in the lung of mice with autoimmune vasculitis. (A and B) Flow cytometric gating strategy, F4/80 and Ly-6C expression of the indicated macrophage and myeloid cell populations. (C) Iron staining or FACS-sorted alveolar macrophages (alv. Møs), infiltrating macrophages (infl. Møs), and neutrophils as in A. Arrowheads mark examples of alv. Møs with iron staining. Scale bar: 50 µm.
Figure 6.
Figure 6.
Alveolar macrophages promote homeostasis by clearing extravascular RBC. (A) Giemsa staining of BALF cytospins from mice treated with PBS or clodronate liposomes. White arrowheads indicate engulfed RBCs. (B–G) Quantification of alveolar macrophages (alv. Møs; B), hemorrhages in BALF (C and D), leukocytes (E), infiltrating Møs (F), and weight change (G) in BL6 mice during the recovery phase (5 d after AAPV induction) and treated with liposomes before disease induction as in Fig. 5 H. (H and I) Hemorrhages in BALF (H) and weight change (I) in Stinggt/gt mice undergoing AAPV and treated with liposomes as in B–G. Each symbol represents an individual mouse. Shown are pooled data from three (B–G with n = 18–19 mice/group) and two (H and I with n = 7 mice/group) independent experiments. Bar and line graphs show mean ± SEM. Asterisks indicate the significance level of unpaired t test (B–F and H), and two-way ANOVA with Šídák's multiple comparisons test (G and I). *, P < 0.05; **, P < 0.01; ***, P < 0.001.
Figure 7.
Figure 7.
Pharmacological inhibition of STING or JAK/STAT pathways ameliorates AAPV in mice. (A) Schematic representation of experiment with H151 STING inhibitor. (B–F) Weight change kinetics (B), hemorrhages in BALF (C and D), leukocyte infiltration (E), and lung injury score (F) in mice treated as in A. (G) Schematic representation of experiment with JAK1/2 inhibitor baricitinib. (H–J) Weight change (H), lung injury score (I), and hemorrhages in the BALF (J) of wild-type mice treated as in A. Each dot represents an individual mouse (D–F, I, and J). Shown are pooled data from two independent experiments with 5–12 mice/group (B–F), or 10–12 mice/group (H–J). Bar and line graphs show mean ± SEM. Asterisks indicate the significance level of unpaired t test (E, I, and J), one-way ANOVA Tukey’s multiple comparisons test (D and F), and two-way ANOVA with Šídák's multiple comparisons test (B and H). *, P < 0.05; **, P < 0.01.***, P < 0.001.

Similar articles

Cited by

References

    1. Ablasser, A., Goldeck M., Cavlar T., Deimling T., Witte G., Röhl I., Hopfner K.-P., Ludwig J., and Hornung V.. 2013a. CGAS produces a 2′-5′-linked cyclic dinucleotide second messenger that activates STING. Nature. 498:380–384. 10.1038/nature12306 - DOI - PMC - PubMed
    1. Ablasser, A., Schmid-Burgk J.L., Hemmerling I., Horvath G.L., Schmidt T., Latz E., and Hornung V.. 2013b. Cell intrinsic immunity spreads to bystander cells via the intercellular transfer of CGAMP. Nature. 503:530–534. 10.1038/nature12640 - DOI - PMC - PubMed
    1. Apel, F., Andreeva L., Knackstedt L.S., Streeck R., Frese C.K., Goosmann C., Hopfner K.-P., and Zychlinsky A.. 2021. The cytosolic DNA sensor CGAS recognizes neutrophil extracellular traps. Sci. Signal. 14:eaax7942. 10.1126/scisignal.aax7942 - DOI - PubMed
    1. Bain, C.C., and MacDonald A.S.. 2022. The impact of the lung environment on macrophage development, activation and function: Diversity in the face of adversity. Mucosal Immunol. 15:223–234. 10.1038/s41385-021-00480-w - DOI - PMC - PubMed
    1. Bain, C.C., Scott C.L., Uronen-Hansson H., Gudjonsson S., Jansson O., Grip O., Guilliams M., Malissen B., Agace W.W., and Mowat A.M.. 2013September. Resident and pro-inflammatory macrophages in the colon represent alternative context-dependent fates of the same Ly6Chi monocyte precursors. Mucosal Immunol. 6:498–510. 10.1038/mi.2012.89 - DOI - PMC - PubMed

Publication types