. 2023 Jan 13;32(3):431-449.
doi: 10.1093/hmg/ddac211.

Expression and subcellular localization of USH1C/harmonin in human retina provides insights into pathomechanisms and therapy

Affiliations

Expression and subcellular localization of USH1C/harmonin in human retina provides insights into pathomechanisms and therapy

Kerstin Nagel-Wolfrum et al. Hum Mol Genet. .

Abstract

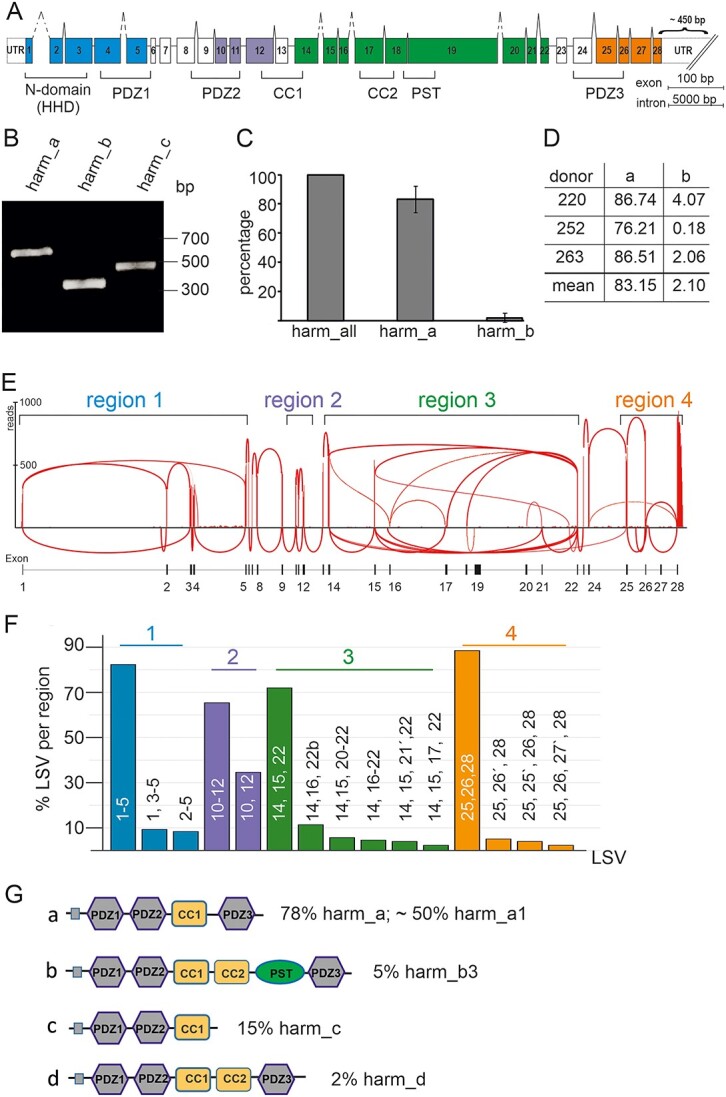
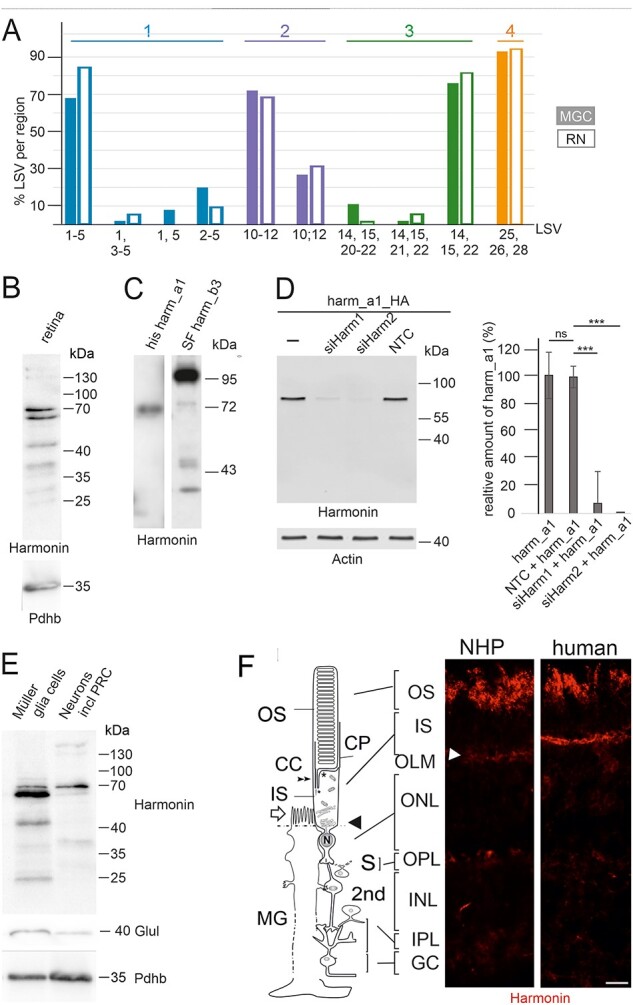
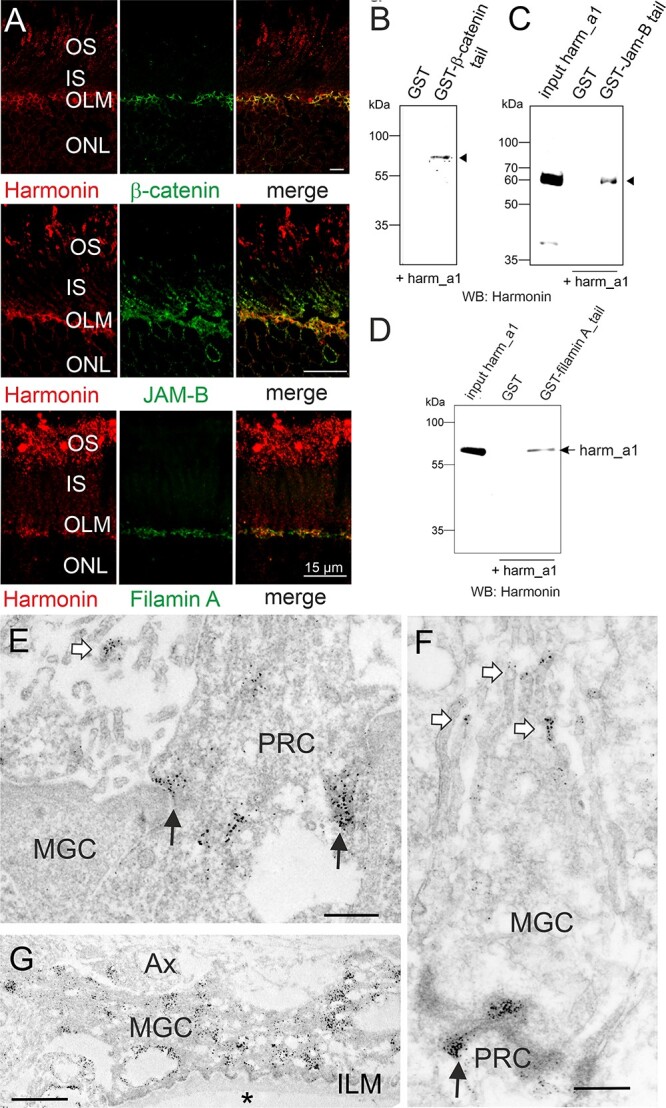
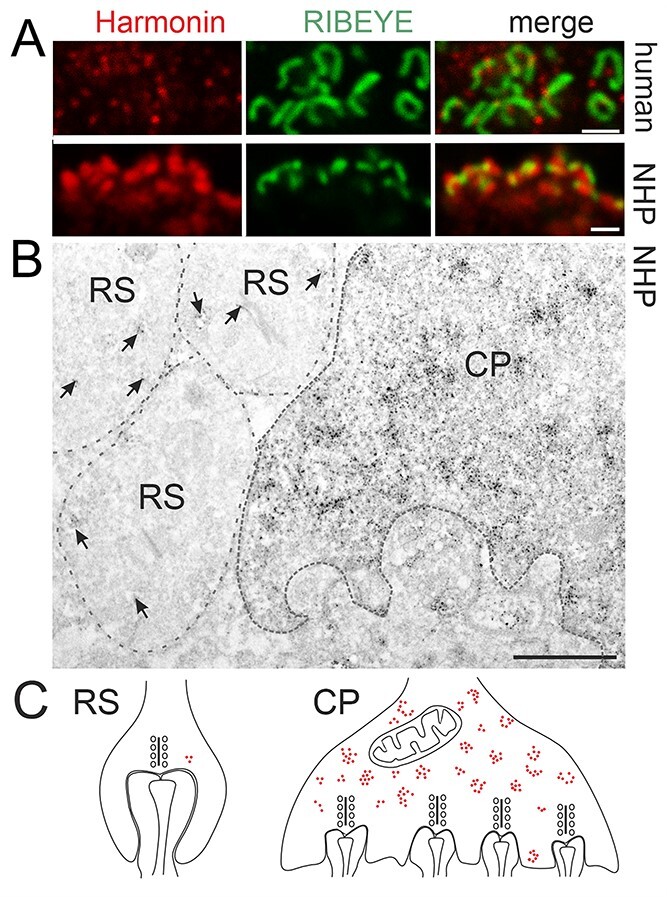
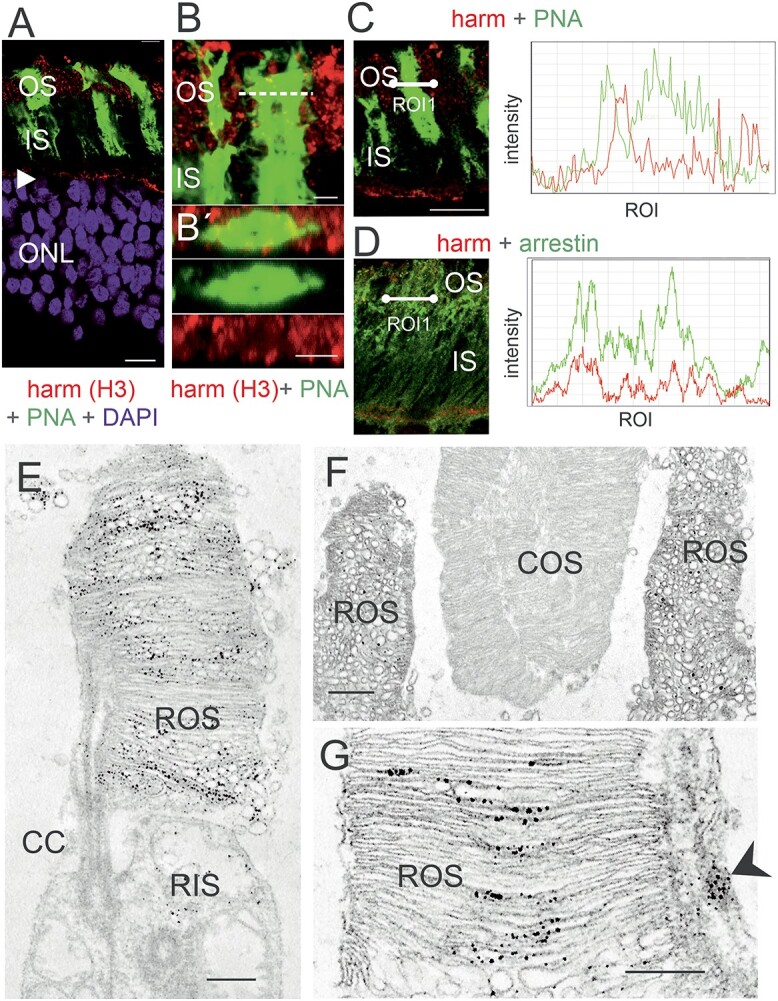
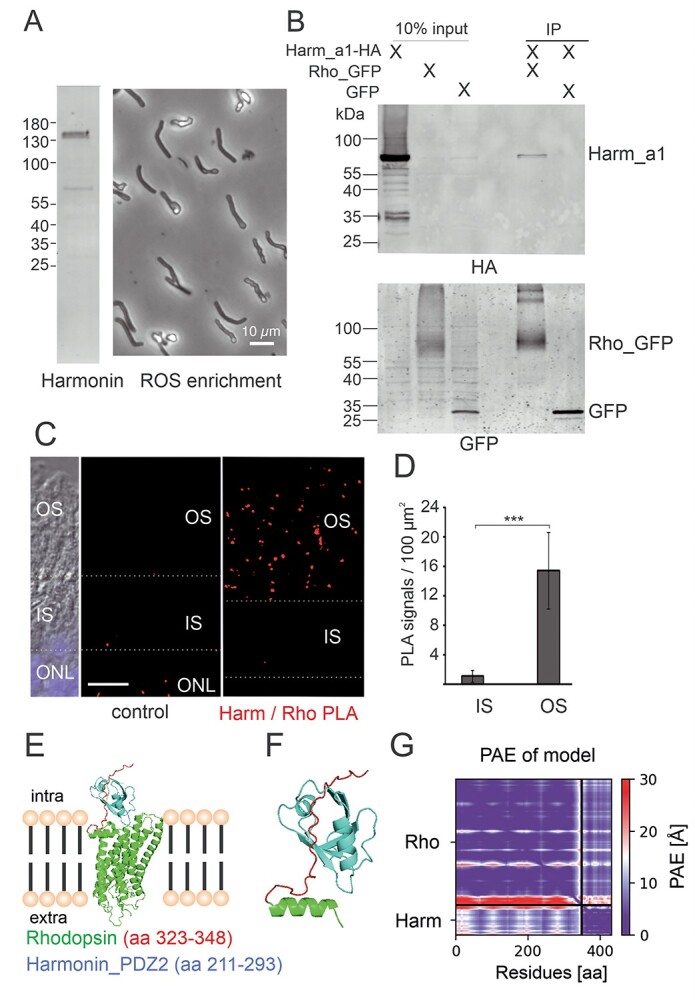
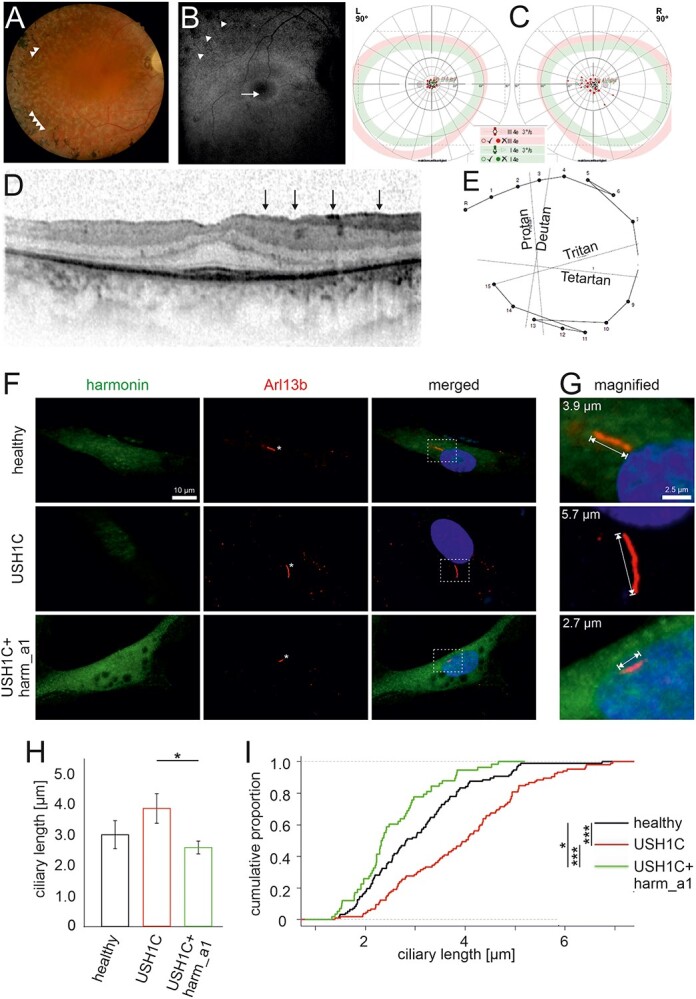
Usher syndrome (USH) is the most common form of hereditary deaf-blindness in humans. USH is a complex genetic disorder, assigned to three clinical subtypes differing in onset, course and severity, with USH1 being the most severe. Rodent USH1 models do not reflect the ocular phenotype observed in human patients to date; hence, little is known about the pathophysiology of USH1 in the human eye. One of the USH1 genes, USH1C, exhibits extensive alternative splicing and encodes numerous harmonin protein isoforms that function as scaffolds for organizing the USH interactome. RNA-seq analysis of human retinae uncovered harmonin_a1 as the most abundant transcript of USH1C. Bulk RNA-seq analysis and immunoblotting showed abundant expression of harmonin in Müller glia cells (MGCs) and retinal neurons. Furthermore, harmonin was localized in the terminal endfeet and apical microvilli of MGCs, presynaptic region (pedicle) of cones and outer segments (OS) of rods as well as at adhesive junctions between MGCs and photoreceptor cells (PRCs) in the outer limiting membrane (OLM). Our data provide evidence for the interaction of harmonin with OLM molecules in PRCs and MGCs and rhodopsin in PRCs. Subcellular expression and colocalization of harmonin correlate with the clinical phenotype observed in USH1C patients. We also demonstrate that primary cilia defects in USH1C patient-derived fibroblasts could be reverted by the delivery of harmonin_a1 transcript isoform. Our studies thus provide novel insights into PRC cell biology, USH1C pathophysiology and development of gene therapy treatment(s).


Figures

Figure 1
Figure 1
Expression of USH1C/harmonin a, b and c transcripts in the human retina. (A) Exon and intron structure of human USH1C. Exons are shown in boxes and denoted by the numbers 1–28. The different domains of the harmonin protein, namely N-terminal or HHD, PDZ (PSD-95, DLG, ZO-1) domains, PST (proline–serine–threonine rich) domain, CC (coiled-coil) domains, are marked by brackets below the gene structure. Colors indicate regions of LSV analyses. (BD) RT-PCR analyses of USH1C/harmonin transcripts using isoform-specific primers in adult human retina. (B) RT-PCR analysis of USH1C/harmonin transcripts using isoform-specific primers in human retina. Transcripts of USH1C/harmonin isoforms a, b and c were detected. Equal amounts of amplified cDNA were loaded. (C) Quantitative RT-PCR of USH1C/harmonin isoforms. Primers detect either all USH1C/harmonin transcripts (a, b and c) or are specific for USH1C/harmonin_a or USH1C/harmonin_b transcripts, respectively. USH1C/harmonin_a isoforms are most prominent, whereas USH1C/harmonin_b isoforms are rarely expressed. (D) Percentages of transcripts in three different donors are shown. USH1C/harmonin_a-transcripts were most abundant (83.15%), USH1C/harmonin_b-transcripts were barely detected (2.1%). (E) Representative Sashimi plot of RNA-seq analysis of human retina. Splicing events were grouped into four regions (region 1–4). (F) Quantification of LSVs. LSVs of the same region are depicted by the same color. (G) Predicted domain structures of the USH1C/harmonin transcripts. Percentage of transcripts is based on the copy number of LSVs in regions 1–4. USH1C/harmonin class a is the most abundant class, with USH1C/harmonin_a1 being the most expressed isoform.
Figure 2
Figure 2
USH1C/harmonin expression in retinal cells. (A) Bulk RNA-seq of human RNs and MGCs. In RNs (filled bars) and MGCs (empty bars), USH1C/harmonin transcripts are detectable. (B) Western blot analysis of harmonin protein expression in human retina with affinity-purified polyclonal antibodies against harmonin (H3) showed two major bands at 64 and 70 kDa, which comigrate with harmonin_a1 in C. Lower bands may represent harmonin_c isoforms. (C) His-tagged harmonin a1 and SF-tagged harmonin b3 were transiently expressed in HEK293T cells. Pan antiharmonin H3 detected bands that co-migrate at the molecular weights of recombinant harmonin_a1 and harmonin_b3. Lower bands represent degraded products of harmonin_a and/or b. (D) Western blot analysis to validate the specificity of the harmonin antibody. A strong harmonin band is detected in HEK293T cells transfected with HA-tagged harmonin (Harm_a1_HA) or co-transfected with Harm_a1_HA and control siRNA (NTC). Harmonin is not detected in cells co-transfected with HA-tagged harmonin_a1 (Harm_a1_HA) and siHarm, indicating the specificity of the harmonin antibody. ***P-value < 0.001. (E) Antiharmonin (H3) western blot of MGCs and neurons including photoreceptors cells (RNs) isolated from human retina. Overall harmonin is higher expressed in MGCs, but a more prominent band is found at 70 kDa in RNs. Western blot verification with antiglutamate synthetase (Glul), a common marker for MGCs, indicated <10% contamination of the RN fraction with MGCs when quantified. Western blot for pyruvate dehydrogenase E1-β (Pdhb) served as the loading control, indicating that 1.5-fold more protein was loaded of the RN fraction when quantified. (F) Localization of harmonin in retina sections. Indirect immunofluorescence labeling of harmonin in a longitudinal section through the retina, the OS, the IS and the nuclei in the ONL and MGC of a NHP and human retina, respectively. In addition to the prominent labeling of the OLM (arrowhead), patchy harmonin staining was present in the layer of the photoreceptor OS. Faint staining was present in the IS, the OPL, the IPL and GCL. Scale bars: 10 μm.
Figure 3
Figure 3
Subcellular harmonin localization at the outer limiting membrane of the human retina. (A) Indirect immunofluorescence double staining of harmonin and the adhesion junction molecule β-catenin, the tight junction molecule JAM-B, or the actin-binding protein filamin A. Merged images demonstrate an overlap of harmonin staining with β-catenin, JAM-B and filamin A staining at the outer limiting membrane (OLM). (BD) GST-pulldown demonstrates the interaction of harmonin_a1 (harm_a1) with the C- terminal tails of β-catenin, JAM-B, and filamin A, respectively. (EG) Immunoelectron microscopy analysis of harmonin labelling in a longitudinal section through the OLM of a human retina. Harmonin labelling concentrated in the electron dense adhesion junctions between Müller glia cells (MGCs) and photoreceptor cells (PRC) in the OLM (black arrows), microvilli of MGCs (white arrows) and MGC endfeet at the inner limiting membrane (ILM) which contacts the vitreous (asterisk). OS, outer segment; IS, inner segment; ONL, outer limiting membrane; AX, axon; Scale bars: Harmonin/β-catenin: 5 μm; Harmonin/JAM-B, Harmonin/Filamin_A: 15 μm; D, E: 0.5 μm; F: 1 μm.
Figure 4
Figure 4
Harmonin localization at primate photoreceptor synapses. (A) Double immunofluorescence labeling of harmonin (red) and pre-synaptic protein RIBEYE (green) in human (upper panel) and NHP (lower panel) OPL synapses. Merged images revealed co-localization of harmonin and RIBEYE (yellow). (B) Immunoelectron microscopy analysis of harmonin in NHP photoreceptor synapses. Dense harmonin labeling was present in CP, but only weak harmonin labeling (arrows) was observed in rod spherule (RS). (C) Schematic representation of presynaptic harmonin labeling in RS and CP. Scale bars: A, B: 1 μm; E: 12 μm.
Figure 5
Figure 5
Harmonin in the OS of human PRCs. (A) Merged image of harmonin immunofluorescence (red) and fluorescent peanut agglutinin (PNA, green), a specific marker for the extracellular matrix sheath of cone photoreceptors in a longitudinal section through the photoreceptor layer, the OS, the IS and the nuclei in the ONL of a human retina. In addition to the prominent labeling of the OLM (arrowhead) patchy harmonin staining was present in the layer of the photoreceptor OS. (B, B´) Magnification of the OS region demonstrates no co-localization of harmonin and PNA. (B´) Confocal x,y scan image of harmonin and PNA labeling in the photoreceptor layer of a human retina. y, z scan at the dotted line in B at higher magnification. (C, D) Double labeling of harmonin (red) with PNA (green) (C) and rod-specific arrestin (green) (D) in the photoreceptor layer of human retina. Corresponding fluorescence intensity profiles of regions of interest (white lines) at the right panel demonstrated no co-localization of harmonin and PNA, but co-localization of harmonin and arrestin indicating the localization of harmonin in human rod OS but not cone OS. DAPI (blue): nuclear DNA. (EG) Immunoelectron microscopy labeling of harmonin in a longitudinal section through human retinae. (E) In human rod PRCs, harmonin was labeled in ROS and was barely detected in rod inner segments. (F) Harmonin was labeled in ROS, but not in COS. (G) Harmonin is detected in ROS and calyceal processes (arrowhead). CC: connecting cilium. Scale bars: A: 10 μm, B: 2.5 μm, B’C, D: 5 μm, E, G: 0.5 μm, F: 1 μm
Figure 6
Figure 6
Harmonin is expressed in ROS and interacts with rhodopsin. (A) Harmonin is expressed in porcine photoreceptor OS. Left panel: western blot analysis of the isolated porcine ROS enriched fraction from density gradients revealed harmonin expression. Right panel: phase contrast picture of material used for the western blot. (B) GFP-Trap® demonstrates interaction between harmonin a1 (Harm_a1) and opsin-GFP (Rho_GFP) in transfected HEK293T cells. Harmonin_a1 was precipitated by immobilized opsin-GFP and not by GFP alone (replicates, n = 3). (C) PLA of harmonin (Harm) and rhodopsin in longitudinal cryosections through a human retina. PLA signals (red dots) indicate the interaction of harmonin (Harm) and rhodopsin in OS of human PRCs in situ. For a quantitative analysis, the IS/OS borders were defined based on differential interference contrast (DIC) microscopy image. Nuclear DAPI staining (blue) was used to define the ONL. ImageJ was adopted to define the different retina layers: OS and IS of PRCs, and ONL (white dashed lines). As the control, PLA was performed antiopsin antibodies and oligonucleotide-labeled antibodies, where almost no PLA signals were found. (D) Quantification of PLA signals in the OS and IS of PRCs. PLA signals were counted automatically in the different compartments and signals in controls were subtracted in three different samples. The number of PLA signals in OS were also significantly higher when compared with signals in IS. Scale bar: 10 μm. (EG) Structure of the human rhodopsin-harmonin_a1_PDZ2 protein complex predicted by AlphaFold2. (E) Structure of full-length rhodopsin (Rho) (green) and harmonin (Harm)_PDZ2 (aa 211–293, blue). AlphaFold2 predicts binding of Harm_PDZ2 to intracellular C-terminus of Rho (aa323-348), enlarged in (F). (G) PAE for the modeled structure is very low for the predicted complex Harm_PDZ2-Rho (lower left and upper right rectangle), indicating high confidence of the protein complex. The heat map illustrates amino acid distances in Å (further explanation, see Supplementary Material, Figure S3).
Figure 7
Figure 7
Retinal phenotype of an USH1C patient and ciliary phenotype of USH1C patient-derived cells. (AE) Clinical findings of the retinal phenotype of a 35-year-old male with confirmed mutations in USH1C (c.91C > T;p.(R31*), c.238dupC;p.(Arg80Profs*69)). (A) Fundus photography showed bone spiculas in the mid-peripheral and peripheral retina (arrowheads), attenuated retinal vessels, waxy pallor optic disc and white spots of retinal pigment epithelium atrophy. (B) Fundus autofluorescence imaging displayed a hyperfluorescence ring around the fovea (arrow) and a disrupted hypofluorescence in the mid- and far periphery of the retina (arrowheads) corresponding to the outer retinal atrophy. (C) Kinetic visual field (90°): Concentric constriction for III4e and I4e markers with a central preserved area. (D) OCT showed epiretinal gliosis (marked as black vertical arrows), as well as gradual IS/OS loss up to the fovea. Only the foveal region displays a normal retinal structure with preserved photoreceptors and a central macula thickness of 269 μm. (E) Lanthony color test showed normal color perception. (FI) Primary ciliary phenotype of USH1C patient-derived cells and rescue by harmonin_a1. (F, G) Immunofluorescence of harmonin (green) and ciliary marker Arl13b (red) in fibroblasts from a healthy donor (healthy), the clinically examined USH1CR80Pfs*69/R31*-patient (USH1C) and USH1C-fibroblasts transfected with harmonin_a1 (USH1C + harm_a1). (F) In healthy donor cells and harmonin_a1-transfected USH1CR80Pfs*69/R31* cells, harmonin is detectable. In untransfected USH1CR80Pfs*69/R31* cells, harmonin staining is barely visible. (G–I) Ciliary length measurements revealed longer cilia in USH1C patient-derived cells compared with control (healthy) and harmonin_a1-transfected USH1C cells. (H) Quantitative analysis of primary ciliary length reveals a significant decrease in the ciliary length in USH1C + harm_a1 fibroblasts towards the ciliary length of healthy donors. (I) Cumulative analysis of ciliary length and number of ciliated cells in fibroblasts of healthy donors (healthy), USH1CR80Pfs*69/R31* (USH1C) and USH1CR80Pfs*69/R31* fibroblasts transfected with harmonin a1 (USH1C + harm_a1) using R. Two-tailed Student’s t-test, *P ≤ 0.05, **P ≤ 0.01. Cells analyzed: healthy: n = 96; USH1C: n = 105; USH1C + harm_a1: 58, in three independent experiments. Scale bar: F: 10 μm, G: 2.5 μm.

Similar articles

Cited by

References

    1. Kimberling, W.J., Hildebrand, M.S., Shearer, A.E., Jensen, M.L., Halder, J.A., Trzupek, K., Cohn, E.S., Weleber, R.G., Stone, E.M. and Smith, R.J. (2010) Frequency of Usher syndrome in two pediatric populations: implications for genetic screening of deaf and hard of hearing children. Genet. Med., 12, 512–516. - PMC - PubMed
    1. Friedman, T.B., Schultz, J.M., Ahmed, Z.M., Tsilou, E.T. and Brewer, C.C. (2011) Usher syndrome: hearing loss with vision loss. Adv. Otorhinolaryngol., 70, 56–65. - PubMed
    1. Samanta, A., Stingl, K., Kohl, S., Ries, J., Linnert, J. and Nagel-Wolfrum, K. (2019) Ataluren for the treatment of usher syndrome 2A caused by nonsense mutations. Int. J. Mol. Sci., 20, 6274. - PMC - PubMed
    1. May-Simera, H., Nagel-Wolfrum, K. and Wolfrum, U. (2017) Cilia – the sensory antennae in the eye. Prog. Retin. Eye Res., 60, 144–180. - PubMed
    1. Bujakowska, K.M., Liu, Q. and Pierce, E.A. (2017) Photoreceptor cilia and retinal ciliopathies. Cold Spring Harb. Perspect. Biol., 9. 10.1101/cshperspect.a028274. - DOI - PMC - PubMed

Publication types

MeSH terms

Supplementary concepts