. 2022 Sep 22;7(18):e161885.
doi: 10.1172/jci.insight.161885.

Temporal development of T cell receptor repertoires during childhood in health and disease

Affiliations

Temporal development of T cell receptor repertoires during childhood in health and disease

Angela M Mitchell et al. JCI Insight. .

Abstract

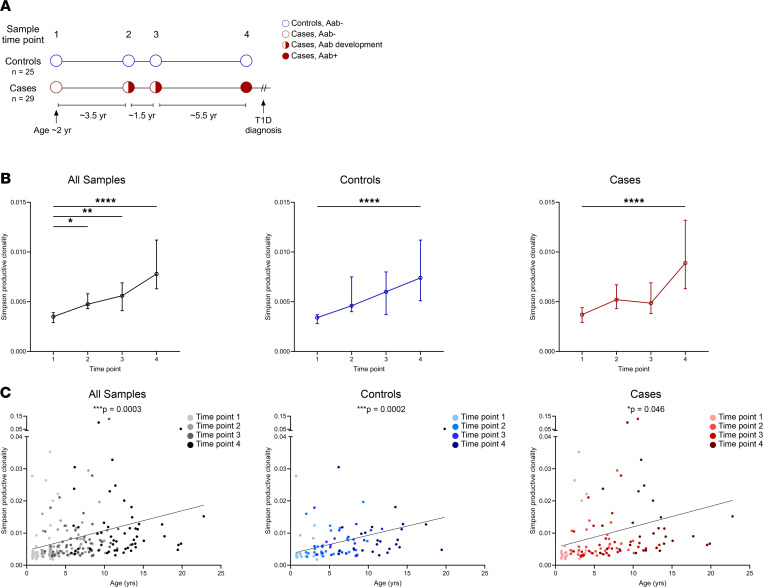
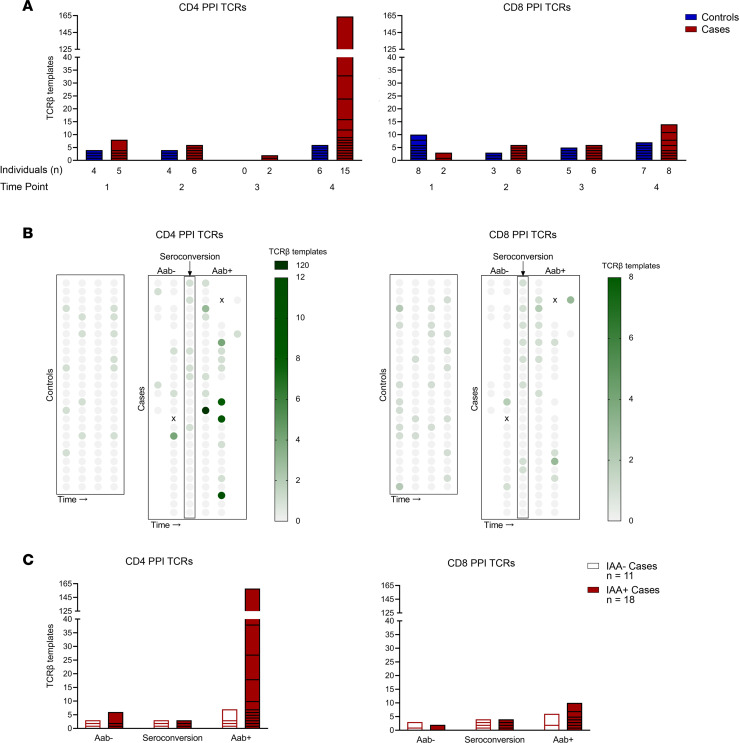
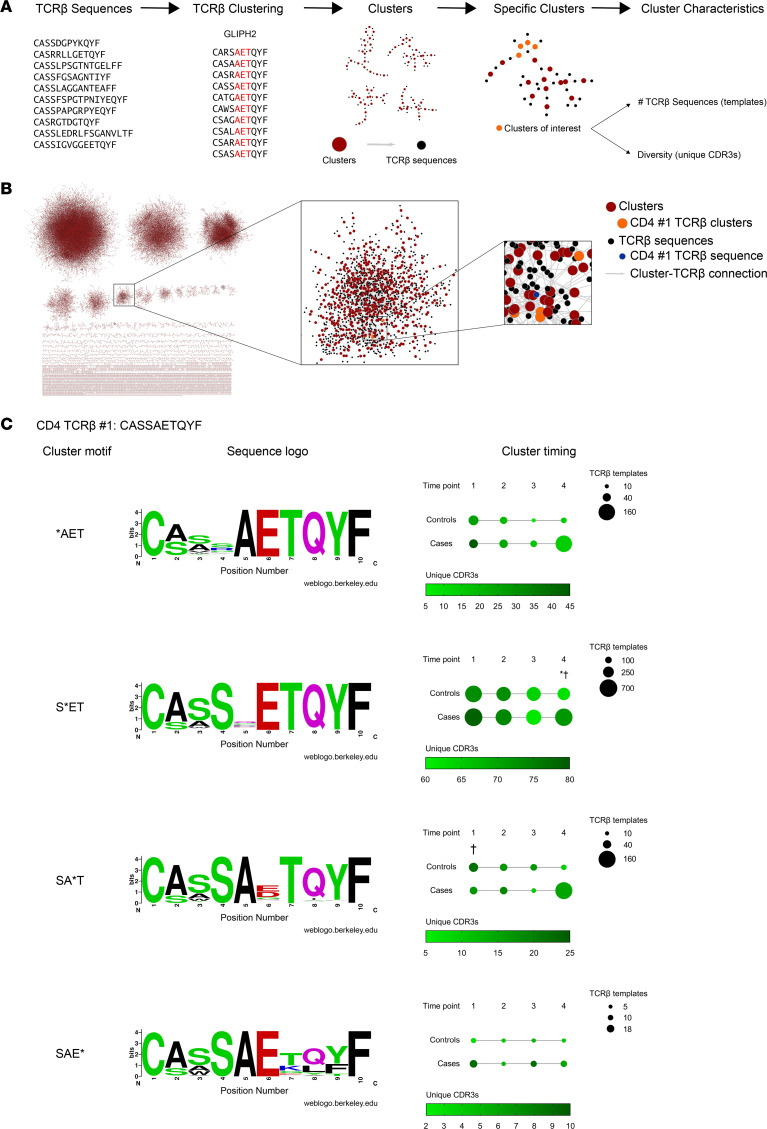
T cell receptor (TCR) sequences are exceptionally diverse and can now be comprehensively measured with next-generation sequencing technologies. However, a thorough investigation of longitudinal TCR repertoires throughout childhood in health and during development of a common childhood disease, type 1 diabetes (T1D), has not been undertaken. Here, we deep sequenced the TCR-β chain repertoires from longitudinal peripheral blood DNA samples at 4 time points beginning early in life (median age of 1.4 years) from children who progressed to T1D (n = 29) and age/sex-matched islet autoantibody-negative controls (n = 25). From 53 million TCR-β sequences, we show that the repertoire is extraordinarily diverse early in life and narrows with age independently of disease. We demonstrate the ability to identify specific TCR sequences, including those known to recognize influenza A and, separately, those specific for insulin and its precursor, preproinsulin. Insulin-reactive TCR-β sequences were more common and frequent in number as the disease progressed in those who developed T1D compared with genetically at risk nondiabetic children, and this was not the case for influenza-reactive sequences. As an independent validation, we sequenced and analyzed TCR-β repertoires from a cohort of new-onset T1D patients (n = 143), identifying the same preproinsulin-reactive TCRs. These results demonstrate an enrichment of preproinsulin-reactive TCR sequences during the progression to T1D, highlighting the importance of using disease-relevant TCR sequences as powerful biomarkers in autoimmune disorders.

Keywords: Adaptive immunity; Autoimmunity; Diabetes; Immunology; T cell receptor.


Conflict of interest statement

Conflict of interest: The authors have declared that no conflict of interest exists.

Figures

Figure 1
Figure 1. The TCR-β chain repertoire is diverse early in life and contracts with age.
(A) Study design showing the time points and mean ages at which TCR-β chain sequencing was performed for nondiabetic controls (blue, n = 25) and cases (red, n = 29) who went on to develop type 1 diabetes, with islet autoantibody-negative visits as open circles, seroconversion as half-filled circles, and autoantibody-positive visits as filled-in circles. (B) Plots showing Simpson productive clonality at each time point for all samples (black, left), controls (blue, middle), and cases (red, right). Depicted are medians with 95% CI. (C) Scatterplots of Simpson productive clonality relative to age (years) for all samples (black, left), controls (blue, middle), and cases (red, right), with darker colors indicating later time points. P values were calculated using mixed-effects models to account for multiple measurements and comparisons for clonality at time point 1 versus all other time points; linear regression was used to compare clonality versus age. *P < 0.05, **P < 0.01, ****P < 0.0001.
Figure 2
Figure 2. TCR-β V gene usage remains consistent throughout childhood.
(A) Heatmaps of TCR-β V gene usage at the 4 time points in controls (top) and cases (bottom), with darker green indicating a higher frequency of a given gene. (B) Plots of principal component analyses depicting Vβ gene usage by individual at the 4 time points for controls (blue, n = 29), cases (dark red n = 18), and a subset of cases (light red, n = 11). Ellipses denote the same subset of cases throughout the 4 time points. Below each PCA plot is a heatmap quantifying the principal components (Vβ genes) contributing to the variance of each plot, with darker green indicating a higher proportion of the variance. (C) Box-and-whisker plots displaying Vβ gene usage accounting for the highest proportion of variance by cases (dark red, n = 18) and the subset of cases (light red, n = 11). The black center line denotes the median value (50th percentile), while the black box contains the 25th to 75th percentiles of the data set. The black whiskers mark the 10th and 90th percentiles. (D) Pie graphs showing the percentage of cases (dark red, top, n = 18) and the subset of cases (light red, bottom, n = 11) who developed each of the 4 islet autoantibodies tested: glutamic acid decarboxylase autoantibodies (GADA), tyrosine phosphatase–related islet antigen-2 autoantibodies (IA-2A), insulin autoantibodies (IAA), and zinc transporter 8 autoantibodies (ZnT8). Percentages of individuals in each group who were negative for each autoantibody are indicated in white. Time points in cases: 1, early in life; 2, before islet autoantibody positivity; 3, after islet autoantibody positivity; and 4, visit prior to clinical T1D diagnosis. Controls were age matched to cases at each time point. P values were calculated using Mann-Whitney U tests for Vβ gene usage in cases compared with the subset of cases at each time point. *P < 0.05, **P < 0.01, ***P < 0.001, ****P < 0.0001.
Figure 3
Figure 3. Presence of influenza-reactive TCR-β chain sequences correlates with increasing age.
All TCR-β chain templates across individuals and time points were searched for the presence of 6 known influenza-responsive TCR-β chains (identical V, J, and CDR3 amino acid sequences), with 3 sequences identified in our data set. (A) Bar graphs showing influenza TCR-β chain template numbers in controls (blue) and cases (red) at the 4 time points. Time points in cases: 1, early in life; 2, before islet autoantibody positivity; 3, after islet autoantibody positivity; and 4, visit prior to clinical T1D diagnosis. Controls were age matched to cases at each time point. (B) Scatterplots of influenza TCR-β chain template numbers relative to age (years) for all samples (black, left), controls (blue, middle), and cases (red, right). P values were calculated using linear regression for template number versus age.
Figure 4
Figure 4. Preproinsulin-reactive TCR-β chain sequences are enriched during progression to type 1 diabetes.
All TCR-β chain templates across individuals and time points were searched for the presence of 44 known preproinsulin-responsive (PPI-responsive) TCR-β chains (identical V, J, and CDR3) with 15 sequences identified in our data set. (A) Bar graphs showing template numbers of CD4 (left) and CD8 (right) PPI TCR-βs in controls (blue) and cases (red) by time point. Time points in cases: 1, early in life; 2, before islet autoantibody positivity; 3, after islet autoantibody positivity; and 4, visit prior to clinical T1D diagnosis. Controls were age matched to cases at each time point. (B) Multivariable plots displaying CD4 (left) and CD8 (right) PPI TCR-β template numbers in controls and cases, with visits aligned by islet autoantibody seroconversion in cases. Darker green indicates a higher template number. (C) Stacked bar graphs depicting CD4 (left) and CD8 (right) PPI TCR-β templates in cases who developed insulin autoantibodies (IAA+, red) and those who remained insulin autoantibody negative (IAA, white), aligned by timing of seroconversion to any of the 4 islet autoantibodies.
Figure 5
Figure 5. Clusters of TCR-β chain sequences, predicted to recognize similar antigens to preproinsulin, expand during diabetes development.
(A) Schematic depicting the clustering of TCR-β sequences and subsequent characterization of identified clusters containing preproinsulin-reactive TCR-β chains. (B) A representation of TCR-β chain sequence clustering from a single individual at 1 time point generated using the GLIPH2 program; depicted are 68,639 total clusters from case #16 at time point 3. TCR-β chain sequences (black) are grouped into clusters (red) based upon predictions to bind similar peptides. CD4 TCR #1 (blue) that recognizes insulin B chain amino acids 9–23 were found in 4 TCR clusters (orange) at this time point. (C) Sequence logos for the 4 clusters that contain the PPI-reactive CD4 TCR #1 showing the frequency of amino acids at each position within the CDR3β sequences (left). Larger letters indicate a higher prevalence of an amino acid at a particular position. Multivariable plots in panels depict the 4 cluster motifs at each time point in controls and cases (right). Dot size indicates the number of TCR-β chain templates composing the cluster, while a darker green color depicts a higher number of unique CDR3β sequences in the cluster (a measure of TCR diversity). Time points in cases: 1, early in life; 2, before islet autoantibody positivity; 3, after islet autoantibody positivity; and 4, visit prior to clinical T1D diagnosis. Controls were age matched at each time point. P values were calculated using mixed-effects models to account for multiple measurements and comparisons between controls and cases at each time point for either template number (*) or CDR3β diversity (†). *P < 0.05, †P < 0.05. Supplemental Table 2 provides full statistics for temporal changes within a cohort and for comparisons between cases and controls.

References

    1. Huppa JB, Davis MM. The interdisciplinary science of T-cell recognition. Adv Immunol. 2013;119:1–50. - PubMed
    1. Rossjohn J, et al. T cell antigen receptor recognition of antigen-presenting molecules. Annu Rev Immunol. 2015;33:169–200. doi: 10.1146/annurev-immunol-032414-112334. - DOI - PubMed
    1. Freeman JD, et al. Profiling the T-cell receptor beta-chain repertoire by massively parallel sequencing. Genome Res. 2009;19(10):1817–1824. doi: 10.1101/gr.092924.109. - DOI - PMC - PubMed
    1. Robins HS, et al. Comprehensive assessment of T-cell receptor beta-chain diversity in alphabeta T cells. Blood. 2009;114(19):4099–4107. doi: 10.1182/blood-2009-04-217604. - DOI - PMC - PubMed
    1. Robins HS, et al. Overlap and effective size of the human CD8+ T cell receptor repertoire. Sci Transl Med. 2010;2(47):47ra64. - PMC - PubMed

Publication types

MeSH terms

Substances