. 2022 Sep 22;7(18):e155296.
doi: 10.1172/jci.insight.155296.

ADAM17-mediated EGFR ligand shedding directs macrophage-promoted cancer cell invasion

Affiliations

ADAM17-mediated EGFR ligand shedding directs macrophage-promoted cancer cell invasion

Sebastian P Gnosa et al. JCI Insight. .

Abstract

Macrophages in the tumor microenvironment have a substantial impact on tumor progression. Depending on the signaling environment in the tumor, macrophages can either support or constrain tumor progression. It is therefore of therapeutic interest to identify the tumor-derived factors that control macrophage education. With this aim, we correlated the expression of A Disintegrin and Metalloproteinase (ADAM) proteases, which are key mediators of cell-cell signaling, to the expression of protumorigenic macrophage markers in human cancer cohorts. We identified ADAM17, a sheddase upregulated in many cancer types, as a protein of interest. Depletion of ADAM17 in cancer cell lines reduced the expression of several protumorigenic markers in neighboring macrophages in vitro as well as in mouse models. Moreover, ADAM17-/- educated macrophages demonstrated a reduced ability to induce cancer cell invasion. Using mass spectrometry-based proteomics and ELISA, we identified heparin-binding EGF (HB-EGF) and amphiregulin, shed by ADAM17 in the cancer cells, as the implicated molecular mediators of macrophage education. Additionally, RNA-Seq and ELISA experiments revealed that ADAM17-dependent HB-EGF ligand release induced the expression and secretion of CXCL chemokines in macrophages, which in turn stimulated cancer cell invasion. In conclusion, we provide evidence that ADAM17 mediates a paracrine EGFR-ligand-chemokine feedback loop, whereby cancer cells hijack macrophages to promote tumor progression.

Keywords: Cancer; Macrophages; Oncology; Proteases.


Conflict of interest statement

Conflict of interest: The authors have declared that no conflict of interest exists.

Figures

Figure 1
Figure 1. ADAM17 expression correlates to protumorigenic macrophage markers CD163 and CD206 in human cancer.
(A) Correlations between mRNA expression of ADAM17 and expression of CD163 (top) and CD206 (bottom) in pancreas, colon, prostate, and breast cancer obtained from TCGA database and analyzed by the GEPIA tool. TPM, transcripts per million. (B) Representative IHC images of low and strong ADAM17 staining in a triple-negative breast cancer cohort (n = 159). (C) Percentage of low and strong ADAM17 (A17) staining within the cohort. (D) Percentage of strong CD163+ cases with low or strong ADAM17 staining. (E) Percentage of CD68-positive cells in cases with low or strong ADAM17 staining. Mean and standard deviation indicated. Pearson’s correlation for A and χ2 test for CE were applied to test for significance; *P ≤ 0.05.
Figure 2
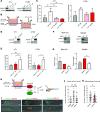
Figure 2. ADAM17 is required for protumorigenic macrophage education.
(A) Western blot of ADAM17 protein expression in WT and Adam17–/– (A17–/–) 4T1 and E0771 cell lines (representative of 3 repeats). β-Actin was used as control. (B) Left: Average tumor volume (mm3) ± standard deviation; Right: Survival curves of WT or Adam17–/– 4T1 (clone 2, n = 6 mice per group, top) and E0771 (clone 1, n = 22 mice per group, bottom) cells injected into the mammary fat pad of BALB/c or C57BL/6JRj mice, respectively. (C) Representative IHC stainings for CD163 in WT or Adam17–/– 4T1 and E0771 tumors. Scale bar: 200 μm. (D) Quantified CD163-positive cells/field from 3 fields/tumor in WT and ADAM17–/– 4T1 (n = 4 and 7, respectively) and E0771 (n = 10 and 4, respectively) tumors. (E) Experimental setup for qRT-PCR of bone marrow–derived macrophages (BMDM) upon coculture with cancer cells (used in F and G). (F) Relative CD163 (n = 4) and CD206 (n = 3) mRNA expression in macrophages cocultured with WT or 2 clones of Adam17–/– 4T1 cells, determined by qRT-PCR. β2 microglobulin (B2M) was used as control. (G) Relative CD163 (n = 3) and CD206 (n = 3) mRNA expression in macrophages cocultured with WT or 2 clones of Adam17–/– E0771 cells, determined by qRT-PCR. B2M was used as control. Mean and standard deviation indicated. Two-sided, unpaired Student’s t test (B, D, F, and G) and log-rank (B) tests were applied to test for significance; *P ≤ 0.05, **P ≤ 0.01, ***P ≤ 0.001.
Figure 3
Figure 3. Cancer cells educate macrophages toward an invasion-promoting phenotype via ADAM17-dependent soluble factors.
(A) Western blot of ADAM17 WT and Adam17–/– (A17–/–) clones 1 and 2 4T1 and CT26 cell lines (representative of 3 repeats). β-Actin served as control. (B) Experimental setup for C, E, and G. (C) Average invaded cells/field of WT 4T1 and CT26 cells alone or with BMDMs educated with WT or Adam17–/– cells (n = 3). (D) ADAM17 Western blot of Adam17–/– 4T1 and CT26 cell lines expressing empty vector (negative control, NC) or mouse ADAM17 (mADAM17) (representative of 3 repeats). β-Actin served as control. (E) Invaded cells/field of WT 4T1 or CT26 cell lines alone or with BMDMs educated with Adam17–/– NC or mADAM17 cancer cells (n = 3). (F) ADAM17 Western blot of MDA-231 and SW480 cells transfected with NC or ADAM17 (A17) siRNA (representative of 3 repeats). β-Actin served as control. (G) Invaded cells/field of WT cell lines with THP-1-derived macrophages (THP-1MΦ) educated by NC or ADAM17 siRNA–transfected MDA-231 and SW480 cells (n = 3). (H) Experimental setup for the zebrafish embryo dissemination assay in IK. (I) Example of tail foci in embryonic zebrafish injected with SW480 cells alone or with THP-1MΦ educated with NC or A17 siRNA–transfected SW80 cells. Arrows: green: cancer cells, red: macrophages, yellow: both cancer cells and macrophages. Scale bar: 200 μm (top), 100 μm (bottom). Quantification of cancer cell (J) and macrophage (K) foci in tail regions 24 hours after injection with SW480 cells alone (n = 19) or with THP-1MΦ educated with NC siRNA–transfected SW80 cells (n = 53) or A17 siRNA–transfected SW80 cells (n = 57). Mean and standard deviation indicated. Data in C, E, and J were analyzed by 1-way ANOVA with Dunnett’s multiple comparison test, and data in G were analyzed by Kruskal-Wallis with Dunn’s multiple comparison test. Data in K were analyzed using unpaired 2-sided Student’s t test. *P ≤ 0.05, **P ≤ 0.01, ***P ≤ 0.001.
Figure 4
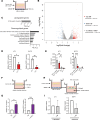
Figure 4. Soluble EGFR ligands are decreased in Adam17–/– cocultures.
(A) Experimental setup for secretome analyses by TMT-MS/MS and ELISA of BMDMs cocultured with cancer cells (used in BD). (B) Volcano plot of proteins identified in secretomes of WT or Adam17–/– (A17–/–) 4T1 cancer cell-BMDM cocultures by TMT-MS/MS. Significantly altered proteins are shown in red. SPP-1, secreted phosphoprotein-1. (C) Relative HB-EGF secretion in WT, Adam17–/–, and Adam17–/– expressing empty vector (NC) or ADAM17 4T1 cells, determined by parallel reaction monitoring–targeted (PRM-targeted) MS. (D) Secretion of HB-EGF, AREG, and TGF-α in WT or Adam17–/– 4T1 (top) and E0771 (bottom) cancer cell-BMDM cocultures, determined by ELISA (n = 3). (E) Experimental setup for HB-EGF and AREG ELISA of BMDM-cancer cell coculture media. (F) HB-EGF and AREG ELISA of WT or Adam17–/– 4T1 and E0771 cell lines and BMDM media, 16 hours after coculture (n = 3). (G) Experimental setup for Western blot of BMDMs upon cancer cell coculture. (H) Western blot of phosphorylated EGFR (p-EGFR) (Tyr1068) and total EGFR in BMDMs cocultured with either WT or Adam17–/– 4T1 cells, quantified as p-EGFR/total EGFR (n = 3). Mean and standard deviation indicated. Data in C were analyzed using Welch ANOVA with correction for multiple comparisons by controlling FDR using Benjamini-Hochberg method, data in D were analyzed using 2-way ANOVA with Holm-Šidák correction for multiple analysis, data in F were analyzed by 1-way ANOVA with Dunnett’s multiple comparison test, and data in H were analyzed using 2-sided, unpaired Student’s t test, *P ≤ 0.05, ***P ≤ 0.001.
Figure 5
Figure 5. ADAM17-mediated EGFR ligand shedding promotes macrophage-induced cancer cell invasion.
(A) Experimental setup for qRT-PCR of BMDMs treated with solvent (NC); recombinant CSF-1 (rCSF-1), HB-EGF (rHB-EGF), or amphiregulin (rAREG); or the combination of rCSF-1 and rHB-EGF or rAREG. (B) Relative CD163 and CD206 expression in BMDMs treated with NC, rCSF-1, rHB-EGF, rAREG, or the combination of rCSF-1 and rHB-EGF or rAREG (n = 3). (C) Experimental setup for Boyden chamber invasion assays of WT cancer cells together with BMDMs treated with rCSF-1, rCSF-1+rHB-EGF, or rCSF-1+rAREG. (D) Relative invasion of E0771 cells together with BMDMs treated with rCSF-1, rCSF-1+rHB-EGF, or rCSF-1+rAREG (n = 4). (E) Experimental setup for Boyden chamber invasion assays of WT cancer cells with BMDMs. BMDMs were cocultured with WT cancer cells transfected with nontargeting control (NC), HB-EGF, or AREG siRNA. (F) Relative number of invaded cells/field of WT 4T1 (top) and E0771 (bottom) cells alone or with BMDMs educated with NC, HB-EGF, or AREG siRNA–treated 4T1 or E0771 cells (n = 4). (G) Experimental setup for Boyden chamber invasion assays of WT cancer cells with BMDMs. BMDMs were cocultured with Adam17–/– (A17–/–) cancer cells with or without rHB-EGF or rAREG. (H) Relative invasion of 4T1 and E0771 cells with BMDMs educated by coculture with Adam17–/– cells in NC-, rHB-EGF–, or rAREG-containing medium (n = 3). Mean and standard deviation indicated. Data in B, F, D, and H were analyzed by Kruskal-Wallis with Dunn’s multiple comparison test, *P ≤ 0.05, **P ≤ 0.01.
Figure 6
Figure 6. Chemokine secretion from macrophages is responsible for enhanced cell invasion.
(A) Experimental setup for RNA-Seq of BMDMs upon coculture with cancer cells (B and C). (B) Volcano plot of mRNA transcripts detected by RNA-Seq in BMDMs educated by WT or Adam17–/– (A17–/–) 4T1 cells. Upregulated genes are indicated in red and downregulated genes in blue. DEGs, differentially expressed genes. (C) KEGG pathways of significantly upregulated and downregulated genes detected by RNA-Seq, using the g:Profiler tool. (D) Relative CXCL1 secretion in WT or Adam17–/– 4T1 and E0771 cells cocultured with BMDMs and analyzed by ELISA (n = 3). (E) CXCL1 secretion in WT and Adam17–/– 4T1 and E0771 cells cocultured with BMDMs or alone, determined by ELISA (n = 3). (F) Experimental setup of Boyden chamber invasion assays, using solvent (NC) or rCXCL1 as chemoattractant. (G) Average number of invaded cells/field of 4T1 and E0771 cell lines (n = 3). (H) Experimental setup of Boyden chamber invasion assays. (I) Relative invasion of 4T1 and E0771 cells cocultured with polarized macrophages and subjected to the CXCR2 inhibitor SB225002 (n = 3). Mean and standard deviation indicated. Data in E were analyzed by 1-way ANOVA with Dunnett’s multiple comparison test, and data in D, G, and I were analyzed using 2-sided, unpaired Student’s t test; *P ≤ 0.05, **P ≤ 0.01, ***P ≤ 0.001.
Figure 7
Figure 7. HB-EGF–induced chemokine secretion is responsible for enhanced cell invasion.
(A) Experimental setup of BMDMs treated with NC, rHB-EGF, rAREG, rTNF-α, or rTNF-α together with rHB-EGF or rAREG. (B) Relative CXCL1 secretion by BMDMs upon treatment, determined by ELISA (n = 3). (C) Relative TNF-α secretion in WT and Adam17–/– 4T1 cells cocultured with BMDM, determined by targeted MS (n = 3). (D) Correlations between the expression of HB-EGF or AREG and CXCL1 in breast, colorectal, and prostate cancer, obtained from TCGA database and analyzed using the GEPIA tool. (E) KEGG pathways of the top 200 significant genes correlating to HB-EGF or AREG expression in breast cancer from TCGA database and analyzed by the GEPIA tool. Mean and standard deviation indicated. Data in B were analyzed by 1-way ANOVA with Dunnett’s multiple comparison test; data in C were analyzed using 2-sided, unpaired Student’s t test; and data in D were analyzed using Pearson’s correlation; *P ≤ 0.05, **P ≤ 0.01, ***P ≤ 0.001.

References

    1. Pollard JW. Tumour-educated macrophages promote tumour progression and metastasis. Nat Rev Cancer. 2004;4(1):71–78. doi: 10.1038/nrc1256. - DOI - PubMed
    1. Zhang QW, et al. Prognostic significance of tumor-associated macrophages in solid tumor: a meta-analysis of the literature. PLoS One. 2012;7(12):e50946. doi: 10.1371/journal.pone.0050946. - DOI - PMC - PubMed
    1. Krzyszczyk P, et al. The role of macrophages in acute and chronic wound healing and interventions to promote pro-wound healing phenotypes. Front Physiol. 2018;9:419. doi: 10.3389/fphys.2018.00419. - DOI - PMC - PubMed
    1. Mantovani A, et al. The chemokine system in diverse forms of macrophage activation and polarization. Trends Immunol. 2004;25(12):677–686. doi: 10.1016/j.it.2004.09.015. - DOI - PubMed
    1. Martinez FO, Gordon S. The M1 and M2 paradigm of macrophage activation: time for reassessment. F1000Prime Rep. 2014;6:13. - PMC - PubMed