

Pointwise Visual Field Estimation From Optical Coherence Tomography in Glaucoma Using Deep Learning
- PMID: 35998059
- PMCID: PMC9424967
- DOI: 10.1167/tvst.11.8.22
Pointwise Visual Field Estimation From Optical Coherence Tomography in Glaucoma Using Deep Learning
Abstract
Purpose: Standard automated perimetry is the gold standard to monitor visual field (VF) loss in glaucoma management, but it is prone to intrasubject variability. We trained and validated a customized deep learning (DL) regression model with Xception backbone that estimates pointwise and overall VF sensitivity from unsegmented optical coherence tomography (OCT) scans.
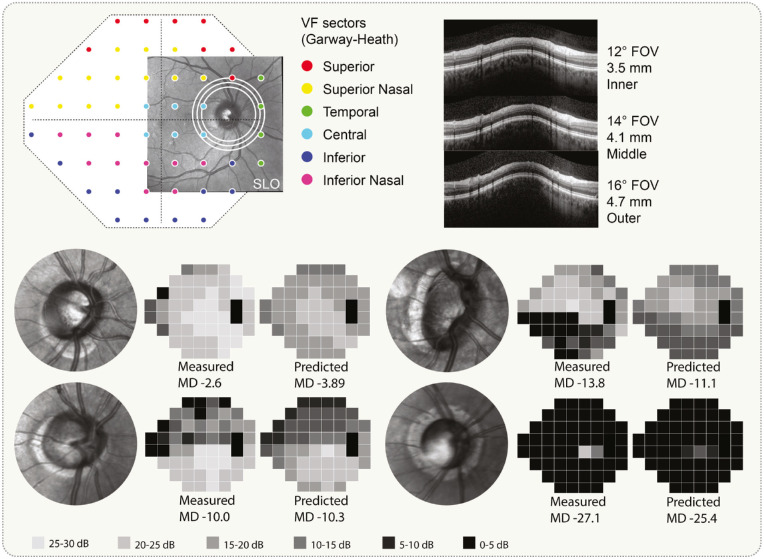
Methods: DL regression models have been trained with four imaging modalities (circumpapillary OCT at 3.5 mm, 4.1 mm, and 4.7 mm diameter) and scanning laser ophthalmoscopy en face images to estimate mean deviation (MD) and 52 threshold values. This retrospective study used data from patients who underwent a complete glaucoma examination, including a reliable Humphrey Field Analyzer (HFA) 24-2 SITA Standard (SS) VF exam and a SPECTRALIS OCT.
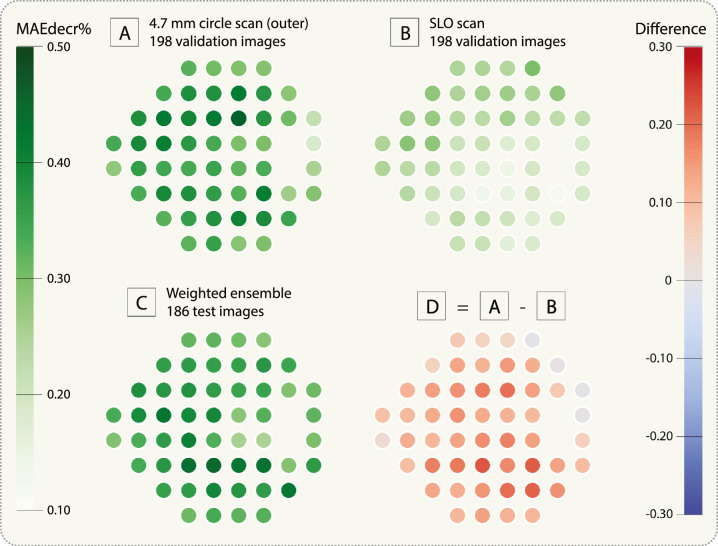
Results: For MD estimation, weighted prediction averaging of all four individuals yielded a mean absolute error (MAE) of 2.89 dB (2.50-3.30) on 186 test images, reducing the baseline by 54% (MAEdecr%). For 52 VF threshold values' estimation, the weighted ensemble model resulted in an MAE of 4.82 dB (4.45-5.22), representing an MAEdecr% of 38% from baseline when predicting the pointwise mean value. DL managed to explain 75% and 58% of the variance (R2) in MD and pointwise sensitivity estimation, respectively.
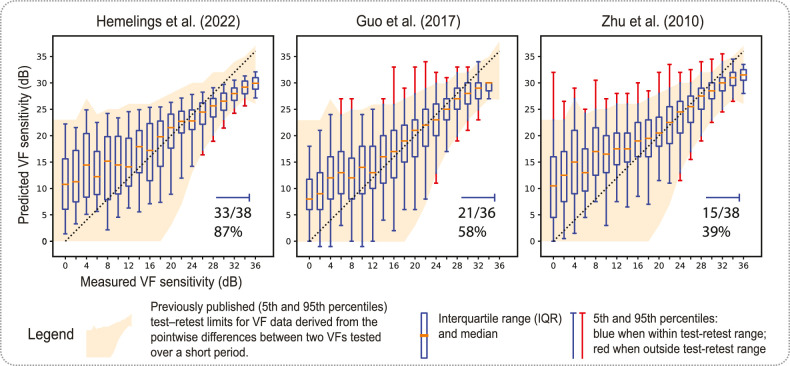
Conclusions: Deep learning can estimate global and pointwise VF sensitivities that fall almost entirely within the 90% test-retest confidence intervals of the 24-2 SS test.
Translational relevance: Fast and consistent VF prediction from unsegmented OCT scans could become a solution for visual function estimation in patients unable to perform reliable VF exams.
Conflict of interest statement
Disclosure:
Figures
Similar articles
-
Predicting Visual Fields From Optical Coherence Tomography via an Ensemble of Deep Representation Learners.Am J Ophthalmol. 2022 Jun;238:52-65. doi: 10.1016/j.ajo.2021.12.020. Epub 2022 Jan 5. Am J Ophthalmol. 2022. PMID: 34998718
-
Deep Learning Estimation of 10-2 Visual Field Map Based on Macular Optical Coherence Tomography Angiography Measurements.Am J Ophthalmol. 2024 Jan;257:187-200. doi: 10.1016/j.ajo.2023.09.014. Epub 2023 Sep 19. Am J Ophthalmol. 2024. PMID: 37734638 Free PMC article.
-
Deep Learning Approaches Predict Glaucomatous Visual Field Damage from OCT Optic Nerve Head En Face Images and Retinal Nerve Fiber Layer Thickness Maps.Ophthalmology. 2020 Mar;127(3):346-356. doi: 10.1016/j.ophtha.2019.09.036. Epub 2019 Sep 30. Ophthalmology. 2020. PMID: 31718841 Free PMC article.
-
Predicting 10-2 Visual Field From Optical Coherence Tomography in Glaucoma Using Deep Learning Corrected With 24-2/30-2 Visual Field.Transl Vis Sci Technol. 2021 Nov 1;10(13):28. doi: 10.1167/tvst.10.13.28. Transl Vis Sci Technol. 2021. PMID: 34812893 Free PMC article.
-
Deep learning approaches to predict 10-2 visual field from wide-field swept-source optical coherence tomography en face images in glaucoma.Sci Rep. 2022 Dec 5;12(1):21041. doi: 10.1038/s41598-022-25660-x. Sci Rep. 2022. PMID: 36471039 Free PMC article.
Cited by
-
Automated learning of glaucomatous visual fields from OCT images using a comprehensive, segmentation-free 3D convolutional neural network model.Sci Rep. 2025 Apr 18;15(1):13395. doi: 10.1038/s41598-025-98511-0. Sci Rep. 2025. PMID: 40251319 Free PMC article.
-
Interpretable longitudinal glaucoma visual field estimation deep learning system from fundus images and clinical narratives.NPJ Digit Med. 2025 Jul 1;8(1):389. doi: 10.1038/s41746-025-01750-8. NPJ Digit Med. 2025. PMID: 40595009 Free PMC article.
-
Big data in visual field testing for glaucoma.Taiwan J Ophthalmol. 2024 Sep 13;14(3):289-298. doi: 10.4103/tjo.TJO-D-24-00059. eCollection 2024 Jul-Sep. Taiwan J Ophthalmol. 2024. PMID: 39430358 Free PMC article. Review.
-
Explainable Deep Learning for Glaucomatous Visual Field Prediction: Artifact Correction Enhances Transformer Models.Transl Vis Sci Technol. 2025 Jan 2;14(1):22. doi: 10.1167/tvst.14.1.22. Transl Vis Sci Technol. 2025. PMID: 39847375 Free PMC article.
-
Big data for imaging assessment in glaucoma.Taiwan J Ophthalmol. 2024 Sep 13;14(3):299-318. doi: 10.4103/tjo.TJO-D-24-00079. eCollection 2024 Jul-Sep. Taiwan J Ophthalmol. 2024. PMID: 39430345 Free PMC article. Review.
References
-
- Prum BE, Rosenberg LF, Gedde SJ, et al. .. Primary Open-Angle Glaucoma Preferred Practice Pattern Guidelines. Ophthalmology. 2016; 123(1): P41–P111. - PubMed
-
- European Glaucoma Society. European Glaucoma Society Terminology and Guidelines for Glaucoma, 4th Edition—Part 1. Br J Ophthalmol. 2017; 101(4): 54.
-
- Artes PH, Iwase A, Ohno Y, Kitazawa Y, Chauhan BC.. Properties of perimetric threshold estimates from full threshold, SITA standard, and SITA fast strategies. Invest Ophthalmol Vis Sci. 2002; 43(8): 2654–2659. - PubMed
-
- Banegas SA, Antón A, Morilla A, et al. .. Evaluation of the retinal nerve fiber layer thickness, the mean deviation, and the visual field index in progressive glaucoma. J Glaucoma. 2016; 25(3): e229–235. - PubMed
Publication types
MeSH terms
LinkOut - more resources
Full Text Sources
Medical
Research Materials
Miscellaneous
