. 2023 Mar 31;119(2):520-535.
doi: 10.1093/cvr/cvac139.

The pulmonary vasculature in lethal COVID-19 and idiopathic pulmonary fibrosis at single-cell resolution

Affiliations

The pulmonary vasculature in lethal COVID-19 and idiopathic pulmonary fibrosis at single-cell resolution

Laura P M H de Rooij et al. Cardiovasc Res. .

Abstract

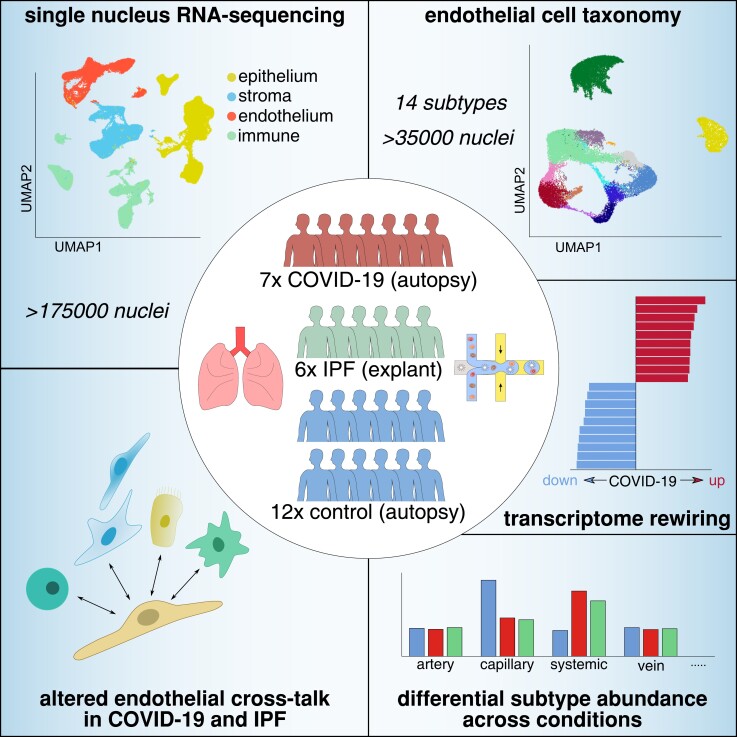
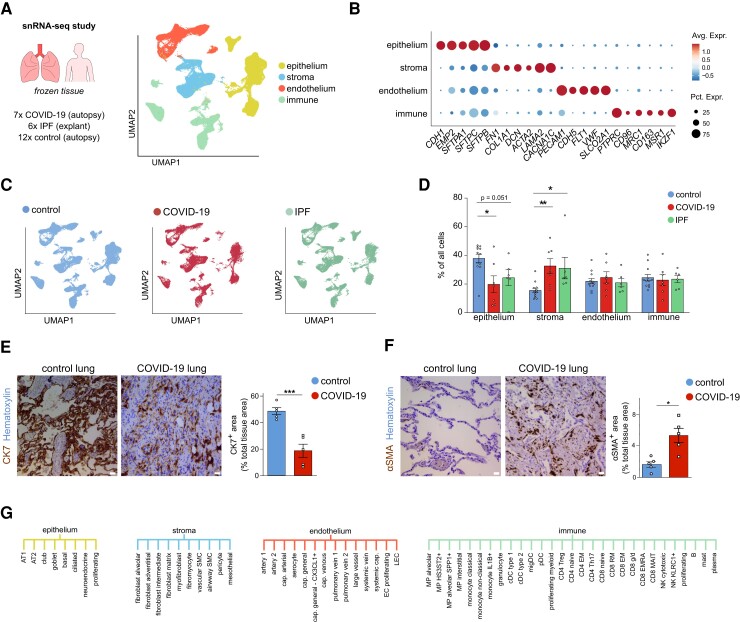
Aims: Severe acute respiratory syndrome coronavirus-2 infection causes COVID-19, which in severe cases evokes life-threatening acute respiratory distress syndrome (ARDS). Transcriptome signatures and the functional relevance of non-vascular cell types (e.g. immune and epithelial cells) in COVID-19 are becoming increasingly evident. However, despite its known contribution to vascular inflammation, recruitment/invasion of immune cells, vascular leakage, and perturbed haemostasis in the lungs of severe COVID-19 patients, an in-depth interrogation of the endothelial cell (EC) compartment in lethal COVID-19 is lacking. Moreover, progressive fibrotic lung disease represents one of the complications of COVID-19 pneumonia and ARDS. Analogous features between idiopathic pulmonary fibrosis (IPF) and COVID-19 suggest partial similarities in their pathophysiology, yet, a head-to-head comparison of pulmonary cell transcriptomes between both conditions has not been implemented to date.

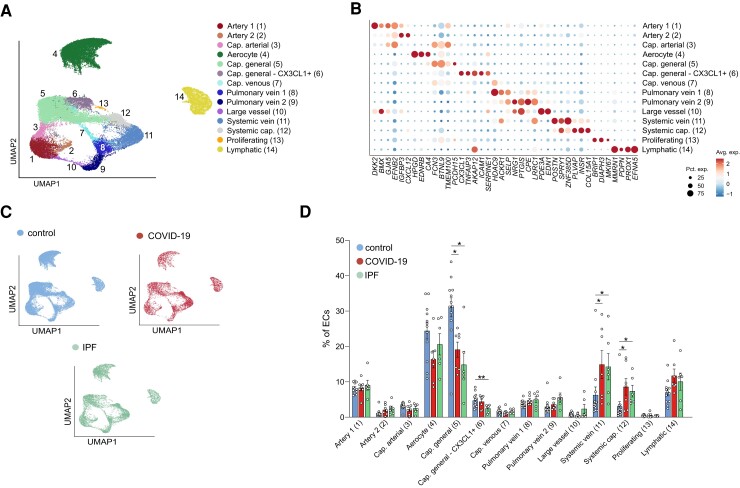
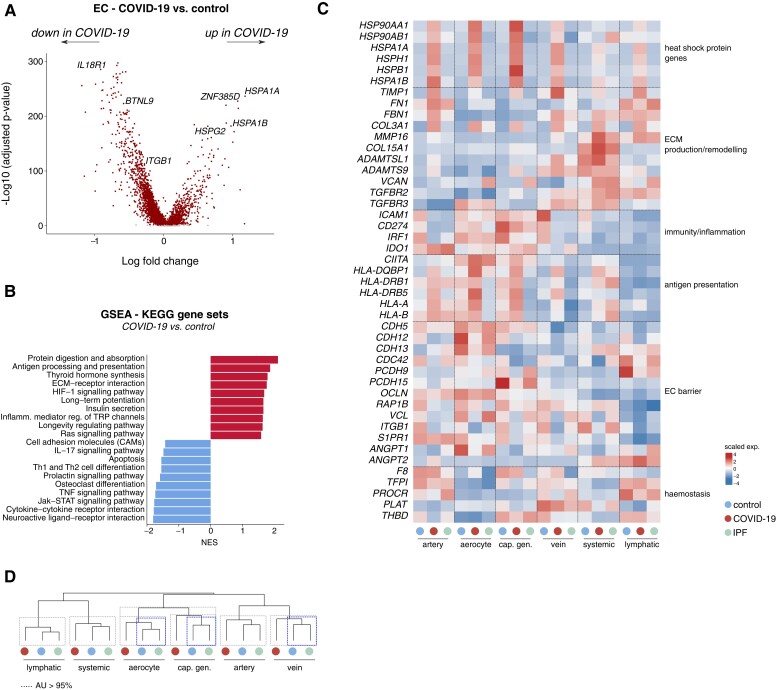
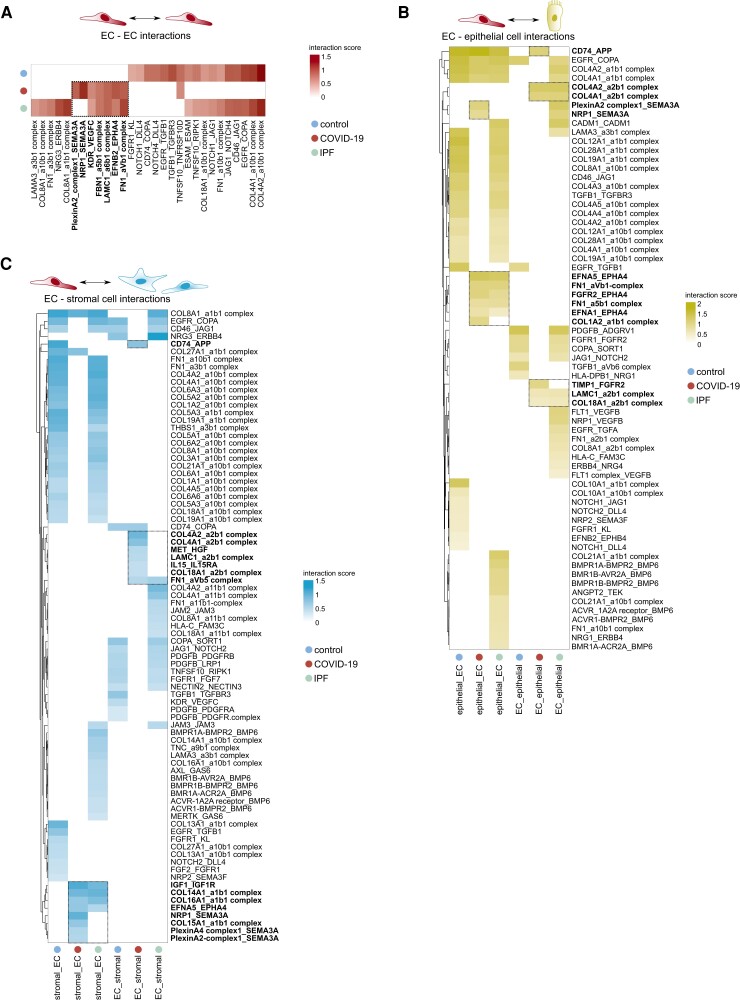
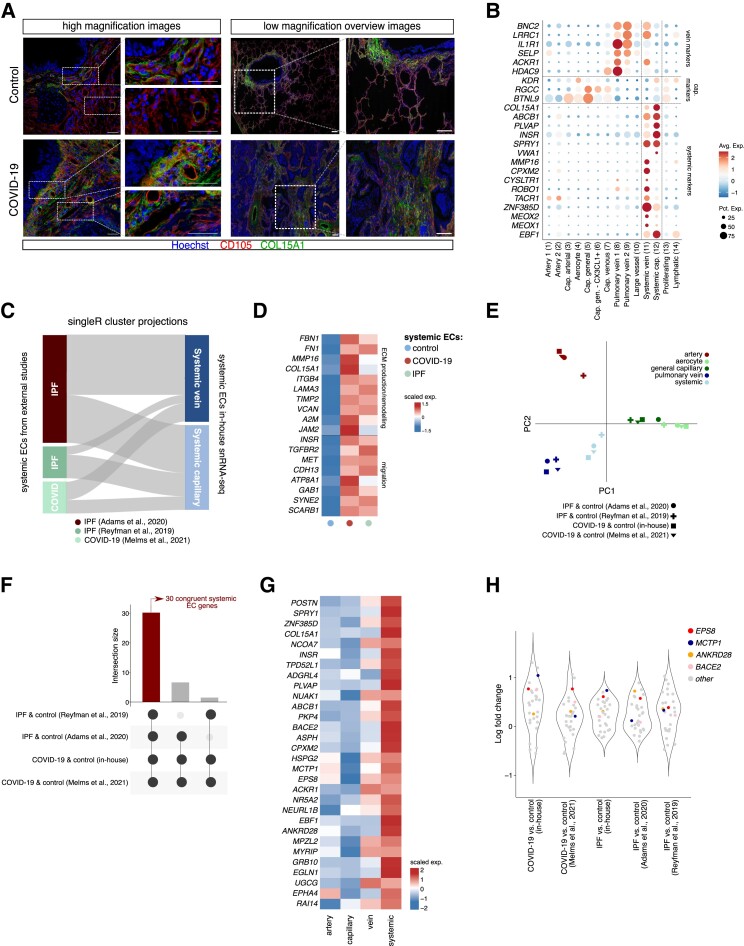
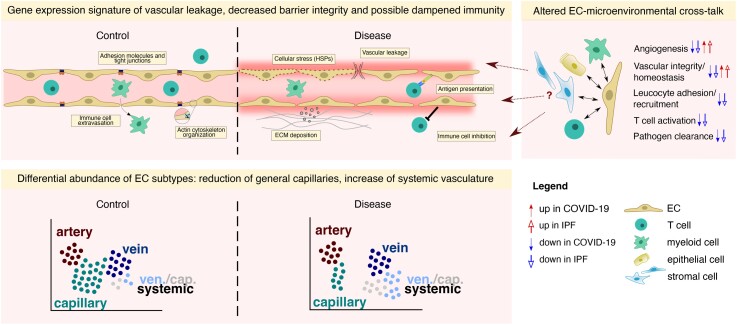
Methods and results: We performed single-nucleus RNA-sequencing on frozen lungs from 7 deceased COVID-19 patients, 6 IPF explant lungs, and 12 controls. The vascular fraction, comprising 38 794 nuclei, could be subclustered into 14 distinct EC subtypes. Non-vascular cell types, comprising 137 746 nuclei, were subclustered and used for EC-interactome analyses. Pulmonary ECs of deceased COVID-19 patients showed an enrichment of genes involved in cellular stress, as well as signatures suggestive of dampened immunomodulation and impaired vessel wall integrity. In addition, increased abundance of a population of systemic capillary and venous ECs was identified in COVID-19 and IPF. COVID-19 systemic ECs closely resembled their IPF counterparts, and a set of 30 genes was found congruently enriched in systemic ECs across studies. Receptor-ligand interaction analysis of ECs with non-vascular cell types in the pulmonary micro-environment revealed numerous previously unknown interactions specifically enriched/depleted in COVID-19 and/or IPF.

Conclusions: This study uncovered novel insights into the abundance, expression patterns, and interactomes of EC subtypes in COVID-19 and IPF, relevant for future investigations into the progression and treatment of both lethal conditions.

Keywords: COVID-19; Endothelial cells; IPF; Lung; SARS-CoV-2; Single-nucleus RNA-seq; Transcriptomics.


Conflict of interest statement

Conflict of interest: A.D. received payments from FMC Belgium, and has a leadership/fiduciary role in the Belgian Society of Pathology (non-profit), and European Society of Pathology Nephropathology working group (non-profit). B.T. has a consulting role for ONO pharmaceutical and owns 10X genomics stocks. B.W. received payments from Hologic. L.J.C. received a research grant and consulting fees from MEDTRONIC. S.F. received support from Pfizer for congress attendance. W.W. received research grants and payment for lectures from Roche and Boehringer Ingelheim and a research grant from Galapagos. S.V. received consulting fees from Therakos and Boehringer Ingelheim. J.W. received investigator-initiated grants, consulting fees, speaker fees, and travel grants from Pfizer and Gilead.

Figures

Graphical Abstract
Graphical Abstract
Figure 1
Figure 1
Pulmonary cell types in COVID-19, IPF, and control lungs. A, UMAP plot of lung cells from 7 deceased COVID-19 patients, 6 IPF patients who required lung transplantation, and 12 SARS-CoV-2-uninfected controls (who died of causes unrelated to lung disease), colour-coded by major cellular lineage. B, Dot plot heatmap of expression of representative marker genes of major cellular lineages. The size and colour intensity of each dot represent, respectively, the percentage of cells within each cell type expressing the marker gene and the average level of expression of the marker in this cell type. Colour scale: top (red), high expression; bottom (blue), low expression. C, UMAP plot of lung cells, colour-coded for the indicated conditions. D, Fractions of major cell types in COVID-19, IPF, and control samples. Mean ± SEM, Kruskal–Wallis, and Dunn’s test for multiple comparisons, *P < 0.05, **P < 0.01. n = 7, 6, and 12 for COVID-19, IPF, and control, respectively. E, Representative images of lung sections from COVID-19 and control subjects, immunostained for the epithelial marker cytokeratin-7 (CK7; brown (dark staining)). Quantifications of the CK7-positive area (% of the total tissue area) are provided to the right of the images. Scale bar: 25 μm. Mean ± SEM, unpaired t-test, two-tailed, ***P < 0.001, n = 5 and n = 5 for COVID-19 and control, respectively. F, Representative images of lung sections from COVID-19 and control subjects, immunostained for the stromal marker alpha-smooth muscle actin (αSMA; brown (dark staining)). Scale bar: 25 μm. Quantifications of the αSMA-positive area (% of the total tissue area) are provided to the right of the images. Data are mean ± SEM, unpaired t-test with Welch correction, two-tailed, *P < 0.05, n = 5 and n = 5 for COVID-19 and control, respectively. G, Overview of the 61 different subclusters identified in epithelial, stromal, endothelial, and immune lineages (for a description of all subclusters and their marker genes, see Supplementary material online, Supplementary Methods).
Figure 2
Figure 2
Vascular subclusters in COVID-19, IPF, and control lungs. A, UMAP plot of EC transcriptomes, colour- and number-coded for the 14 subtypes identified by graph-based clustering. B, Dot plot heatmap of the expression of EC subtype-specific marker genes used for subcluster annotation. The size and colour intensity of each dot represent, respectively, the percentage of cells within each cell type expressing the marker gene and the average level of expression of the marker in this cell type. Colour scale: top (red), high expression; bottom (blue), low expression. C, UMAP plots of ECs, colour-coded per condition D, Fraction of EC subtypes in COVID-19, IPF, and control samples. Data are mean ± SEM, Kruskal–Wallis, and Dunn’s test for multiple comparisons, n = 7 (COVID-19), 6 (IPF), 12 (controls), *P < 0.05, **P < 0.01.
Figure 3
Figure 3
Transcriptomic rewiring of COVID-19 and IPF ECs. A, Volcano plot comparing differentially expressed genes in ECs from COVID-19 vs. control lungs. Representative genes are indicated; each dot represents a single gene. Red (dark) and grey (light) dots indicate up- or downregulated genes with a false discovery rate (q-value) <0.05 or >0.05, respectively. B, Gene set enrichment analysis in ECs derived from COVID-19 lungs, compared with those from controls, using KEGG gene sets. Red bars (to the right, with a value above 0) indicate upregulated gene sets, blue bars (to the left, with value below 0) indicate downregulated gene sets in COVID-19 ECs. C, Gene expression heatmap of individual genes included in the KEGG gene sets presented in (B), in the indicated cell types and conditions. Colour scale: top (red), high expression; bottom (blue), low expression. EC subtypes were pooled into major artery (EC1–3), aerocyte (EC4), general capillary (cap; EC5–6), vein (EC7–9), systemic (EC11–12), and lymphatic (EC14) subgroups. D, Hierarchical clustering analysis of major (pooled) EC subtypes. Dashed boxes indicate clusters that were resolved by multiscale bootstrapping [approximately unbiased (AU) P-value ≥ 95%]. Transcriptomes of COVID-19 aerocytes, general capillaries and veins were statistically separable from their counterparts in control and IPF lungs (blue (dark) dashed boxes); this was not observed for lymphatic, arterial and systemic ECs. GSEA, gene set enrichment analysis; NES, normalized enrichment score.
Figure 4
Figure 4
Predicted endothelial—non-endothelial cell interactions in COVID-19 and IPF lungs. A–C, Heatmaps, visualizing the interaction score for the predicted receptor–ligand pairs (P ≤ 0.05) within the (A) vascular compartment itself (EC–EC interactions), (B) between ECs and epithelial cells, or (C) between ECs and stromal cells in control, COVID-19 and IPF lungs. Only interactions enriched or reduced in COVID-19 and/or IPF vs. control lungs are plotted. In bold indicated and boxed interactions are enriched in COVID-19 or COVID-19 and IPF lungs compared with controls.
Figure 5
Figure 5
Systemic vasculature in COVID-19 and IPF lungs. A, Representative immunofluorescent images of lung sections from COVID-19 and control subjects, immunostained for CD105 and COL15A1. Hoechst labels nuclei. High magnification (left) and low magnification overview images (right) are shown. Smaller images to the right of larger images are magnifications of the respective boxed areas. Scale bar: 50 μm in high magnification images and their zoom-in areas. Scale bar: 250 μm in low magnification overview images and their zoom-in areas. B, Dot plot heatmap of the expression of systemic, capillary, and venous EC marker genes. The size and colour intensity of each dot represent, respectively, the percentage of cells within each subcluster expressing the marker gene and the average level of expression of the marker in this subcluster. Colour scale: top (red), high expression; bottom (blue), low expression. C, SingleR annotation of systemic ECs extracted from the indicated publicly available single-cell/nucleus studies, visualized as cluster projections. The top-50 most highly ranking markers of systemic capillary and venous subclusters in our in-house snRNA-seq dataset were used as a reference. D, Gene expression heatmap of individual genes involved in ECM production/remodelling and migration, in the indicated cell types and conditions. Genes were selected from Gene Ontology enrichment analysis, as presented in Supplementary material online, Table S5. Colour scale: top (red), high expression; bottom (blue), low expression. E, PCA of pairwise Jaccard similarity coefficients of top-50 marker genes enriched in different EC subclusters extracted from indicated single-cell studies. Symbols indicate studies, colours indicate EC subclusters. F, UpSet plot of systemic EC-enriched genes across the four different datasets included in the meta-analysis. Black connected dots beneath the graph indicate which studies are intersected. Left (red) bar: 30 intersecting genes commonly enriched in systemic ECs in all studies [false discovery rate (q-value) <0.05]. G, Gene expression heatmap of genes (n = 30) commonly enriched in systemic ECs across studies (see left (red) bar in F), in the indicated EC subtypes identified in our snRNA-seq atlas. Colour scale: top (red), high expression; bottom (blue), low expression. EC subtypes were pooled into major artery (EC1–3), capillary (cap; EC4–6), vein (EC7–9) and systemic (EC11–12) subgroups. H, Violin plots, visualizing the log-fold change distribution of the 30-gene congruent systemic EC signature obtained in (F). Coloured dots indicate genes congruently enriched in COVID-19 vs. control and/or IPF vs. control lungs across all studies included in the analysis; grey dots indicate all other genes in the 30-gene signature.
Figure 6
Figure 6
Transcriptomic changes in the COVID-19 and IPF vasculature. Schematic representation of vascular transcriptomic rewiring in COVID-19 and IPF vs. control lungs. Upper left panel: the vasculature in (lethal) COVID-19 and IPF lungs harbours a gene expression signature suggestive of vascular leakage, decreased barrier integrity, increased ECM deposition, and possible dampened immunity. Upper right panel: EC-centred interactome analysis revealed various routes of EC-microenvironmental cross-talk that could potentially drive the dysfunctional state of the vasculature in COVID-19 and IPF. Lower panel: ECs in lethal COVID-19 and IPF are dominantly enriched for systemic venous and capillary ECs, whereas general (pulmonary) capillary ECs are decreased in abundance. The transcriptomic signature of systemic ECs suggests an involvement in ECM production/deposition, possibly contributing to the overall fibrotic environment in lethal COVID-19 and IPF. ECM, extracellular matrix; HSPs, heat shock proteins.

Similar articles

Cited by

References

    1. Gibson PG, Qin L, Puah SH. COVID-19 acute respiratory distress syndrome (ARDS): clinical features and differences from typical pre-COVID-19 ARDS. Med J Aust 2020;213:54–56.e51. - PMC - PubMed
    1. Tregoning JS, Flight KE, Higham SL, Wang Z, Pierce BF. Progress of the COVID-19 vaccine effort: viruses, vaccines and variants versus efficacy, effectiveness and escape. Nat Rev Immunol 2021;21:626–636. - PMC - PubMed
    1. Shang L, Lye DC, Cao B. Contemporary narrative review of treatment options for COVID-19. Respirology 2021;26:745–767. - PMC - PubMed
    1. Liao M, Liu Y, Yuan J, Wen Y, Xu G, Zhao J, Cheng L, Li J, Wang X, Wang F, Liu L, Amit I, Zhang S, Zhang Z. Single-cell landscape of bronchoalveolar immune cells in patients with COVID-19. Nat Med 2020;26:842–844. - PubMed
    1. Wilk AJ, Rustagi A, Zhao NQ, Roque J, Martinez-Colon GJ, McKechnie JL, Ivison GT, Ranganath T, Vergara R, Hollis T, Simpson LJ, Grant P, Subramanian A, Rogers AJ, Blish CA. A single-cell atlas of the peripheral immune response in patients with severe COVID-19. Nat Med 2020;26:1070–1076. - PMC - PubMed

Publication types