. 2022 Oct;600(19):4265-4285.
doi: 10.1113/JP283632. Epub 2022 Sep 10.

Cardiac efficiency and Starling's Law of the Heart

Affiliations

Cardiac efficiency and Starling's Law of the Heart

June-Chiew Han et al. J Physiol. 2022 Oct.

Abstract

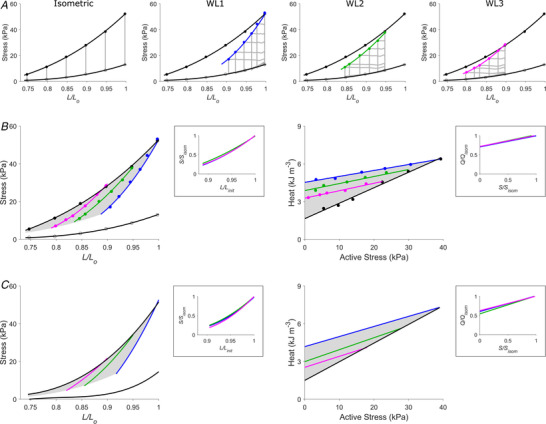
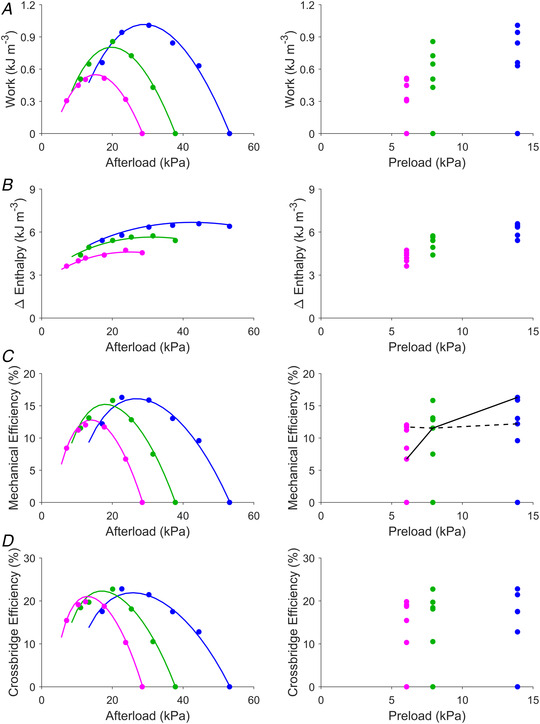
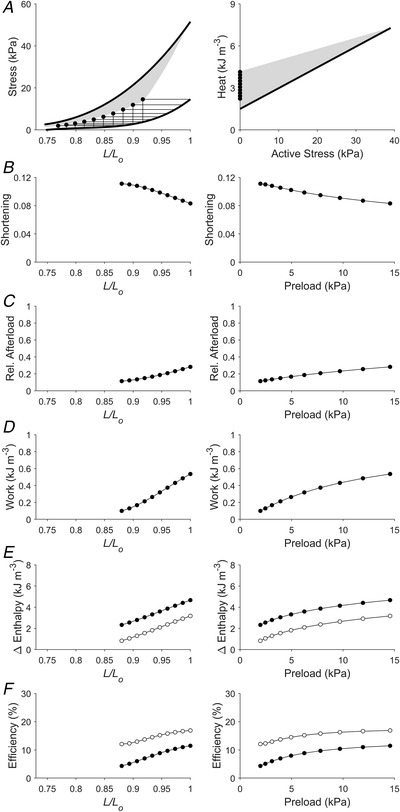
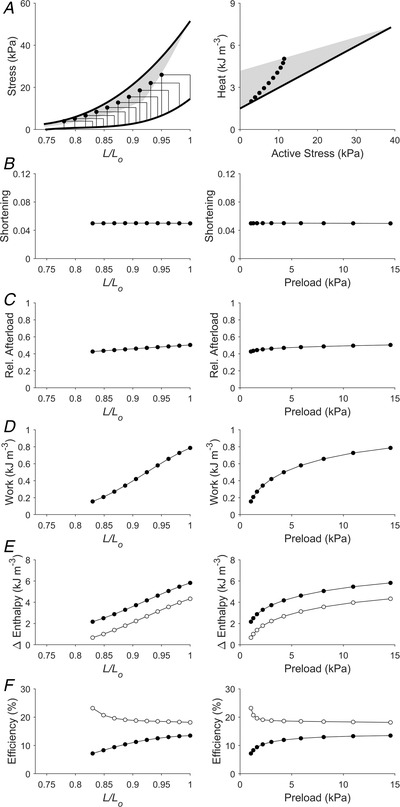
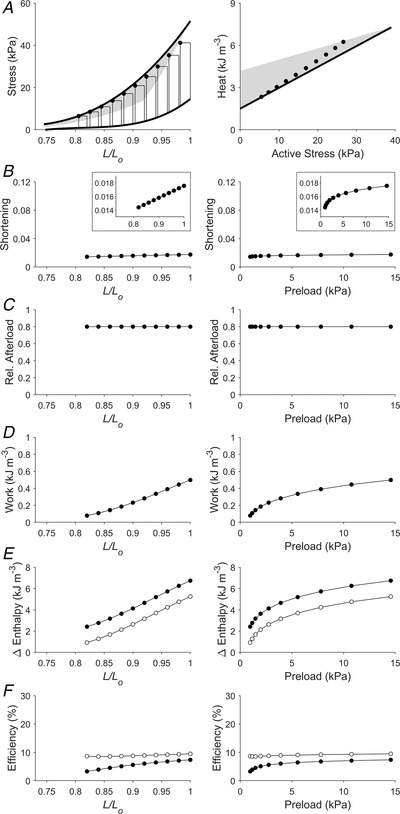
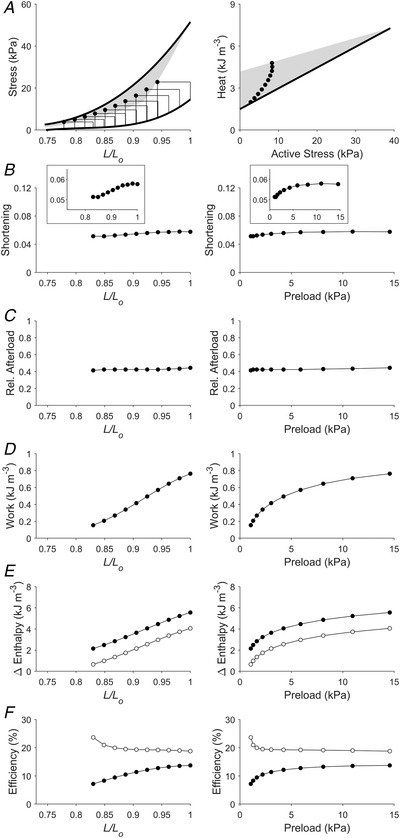
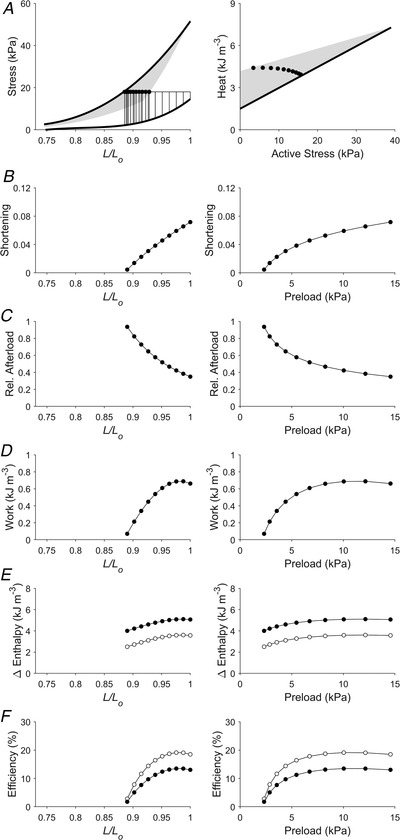
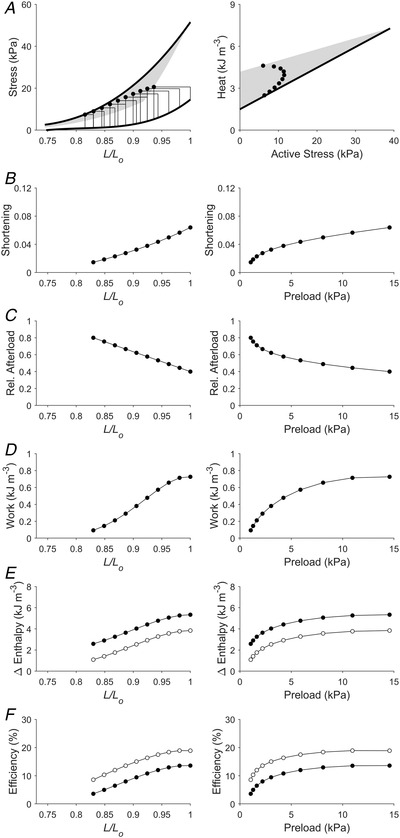
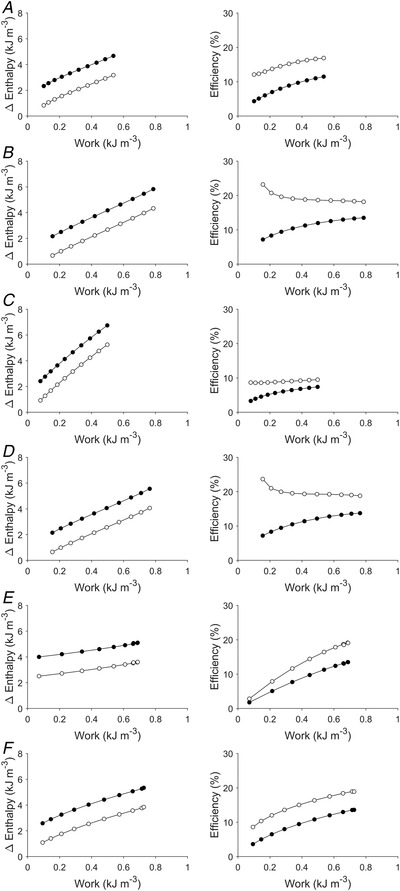
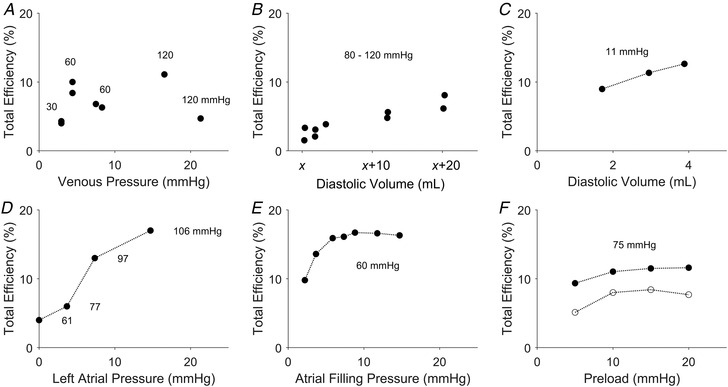
The formulation by Starling of The Law of the Heart states that 'the [mechanical] energy of contraction, however measured, is a function of the length of the muscle fibre'. Starling later also stated that 'the oxygen consumption of the isolated heart … is determined by its diastolic volume, and therefore by the initial length of its muscular fibres'. This phrasing has motivated us to extend Starling's Law of the Heart to include consideration of the efficiency of contraction. In this study, we assessed both mechanical efficiency and crossbridge efficiency by studying the heat output of isolated rat ventricular trabeculae performing force-length work-loops over ranges of preload and afterload. The combination of preload and afterload allowed us, using our modelling frameworks for the end-systolic zone and the heat-force zone, to simulate cases by recreating physiologically feasible loading conditions. We found that across all cases examined, both work output and change of enthalpy increased with initial muscle length; hence it can only be that the former increases more than the latter to yield increased mechanical efficiency. In contrast, crossbridge efficiency increased with initial muscle length in cases where the extent of muscle shortening varied greatly with preload. We conclude that the efficiency of cardiac contraction increases with increasing initial muscle length and preload. An implication of our conclusion is that the length-dependent activation mechanism underlying the cellular basis of Starling's Law of the Heart is an energetically favourable process that increases the efficiency of cardiac contraction. KEY POINTS: Ernest Starling in 1914 formulated the Law of the Heart to describe the mechanical property of cardiac muscle whereby force of contraction increases with muscle length. He subsequently, in 1927, showed that the oxygen consumption of the heart is also a function of the length of the muscle fibre, but left the field unclear as to whether cardiac efficiency follows the same dependence. A century later, the field has gained an improved understanding of the factors, including the distinct effects of preload and afterload, that affect cardiac efficiency. This understanding presents an opportunity for us to investigate the elusive length-dependence of cardiac efficiency. We found that, by simulating physiologically feasible loading conditions using a mechano-energetics framework, cardiac efficiency increased with initial muscle length. A broader physiological importance of our findings is that the underlying cellular basis of Starling's Law of the Heart is an energetically favourable process that yields increased efficiency.

Keywords: Frank-Starling mechanism; cardiac energetics; force-length relation; mechanical efficiency.


Figures

Figure 1
Figure 1. The cardiac end‐systolic zone and its energetics equivalent
A, steady‐state stress–length relations from a representative trabecula undergoing isometric contractions at six lengths and work‐loop (WL) contractions of various afterloads at three preloads. WL1 (blue), WL2 (green) and WL3 (magenta) denote initial muscle lengths (end‐diastolic lengths; L/L o) of 1, 0.95 and 0.90, respectively. On the left panel, the isometric end‐systolic stress–length relation (upper black line) and the passive stress–length relation (lower black line) were obtained by fitting to the end‐systolic points (circles) of the six isometric contractions (grey lines). These two relations were transcribed to the three right panels to demonstrate contraction mode dependency where the isometric end‐systolic stress–length relation falls above the three preloaded work‐loop end‐systolic stress–length relations (WL1, WL2 and WL3). B, all isometric and work‐loop stress–length relations in panel A have been superimposed to illustrate the end‐systolic zone (shaded area on the stress–length domain; right panel) and its energetics equivalent on the heat–stress domain (shaded area, left panel). Points on the end‐systolic zone map to its energetic equivalent on the heat–stress zone (shaded area on the heat–length domain). The end‐systolic zone contains end‐systolic points at all values of L/L o from the minimal length (0.75) to the optimal length (L o), which have been interpolated using the self‐normalised work‐loop stress–length relations in the inset. The three self‐normalised relations in the insets between end‐systolic stress (S) and length (L) and between heat (Q) and active stress (S) have been normalised to their isometric values (subscripted as ‘isom’ to denote isometric, and ‘init’ to denote initial length). C, average relations from all 15 trabeculae. The three average self‐normalised relations in each inset were not significantly different from one another.
Figure 2
Figure 2. Energetic variables plotted against afterload and preload
Data are from the same representative trabecula as in Fig. 1A and B ; the same colour coding applies to denote the work‐loop end‐systolic points at the three initial lengths: L/L o of 1 (blue), 0.95 (green) and 0.90 (magenta). Work (the area of the work‐loop) (A), change of enthalpy (the sum of work and heat) (B), mechanical efficiency (the ratio of work to enthalpy change) (C), and crossbridge efficiency (the ratio of work to crossbridge enthalpy change) (D) are plotted as functions of afterload (left panels) and preload (right panels). In the left‐hand panels, the coloured lines were computed using the preloaded work‐loop end‐systolic relations at each of the three initial lengths and superimposed on the plots. On the right‐hand side of panel C, lines are drawn to illustrate the independence (broken line) and the positive dependence (continuous line) of mechanical efficiency on preload. This demonstrates that the efficiency–preload relation is contingent on the selection of afterload.
Figure 3
Figure 3. Simulated work‐loop contractions under isotonic afterloaded conditions (Case 1)
In panel A, isometric stress–length relations and the end‐systolic zone (shaded) have been transcribed from Fig. 1C . A total of 10 work‐loops were simulated over a range of initial lengths to replicate a scenario of 10 preloaded zero‐active stress isotonic contractions. Shortening (the width of the work‐loop) (B), afterload (relative to the isometric stress at the prescribed initial length) (C), work (the area of the work‐loop) (D), change of enthalpy (the sum of work and heat) (E) and efficiency (the ratio of work to enthalpy) (F) have been plotted as functions of relative length (left panels) and preload (right panels). In panel E, filled circles denote mechanical enthalpy change (the heat component contains both thermal expenditure of activation processes and crossbridge cycling), open circles denote crossbridge enthalpy change. In panel F, filled circles denote mechanical efficiency, open circles denote crossbridge efficiency.
Figure 4
Figure 4. Simulated work‐loops of the same width at various initial lengths (Case 2)
Plotting convention is the same as in Fig 3. Presented here is a scenario that replicates 10 work‐loops with the same width over a range of initial lengths. For each work‐loop, afterloads were chosen such that the extent of shortening was the same for all work‐loops, as illustrated in panel B. In panel E, filled circles denote mechanical enthalpy change, open circles denote crossbridge enthalpy change. In panel F, filled circles denote mechanical efficiency, open circles denote crossbridge efficiency.
Figure 5
Figure 5. Simulated work‐loops at various preloads at a constant, high relative afterload (Case 3)
Plotting convention is the same as in Fig. 3. Presented here is a scenario of 10 work‐loops at various preloads where the relative afterload is set to be 0.8 of the isometric stress at each initial length (or preload). Each inset in panel B shows a reduced ordinate range for a zoom‐in plot of the relation. In panel E, filled circles denote mechanical enthalpy change, open circles denote crossbridge enthalpy change. In panel F, filled circles denote mechanical efficiency, open circles denote crossbridge efficiency.
Figure 6
Figure 6. Simulated work‐loops at preloads and afterloads that produced peak mechanical efficiency (Case 4)
Plotting convention is the same as in Fig. 3. Presented here is a scenario that replicates work‐loops at various preloads. For each preload, the afterload was set at a value that produces peak mechanical efficiency. Each inset in panel B shows a reduced ordinate range for a zoom‐in plot of the relation. In panel E, filled circles denote mechanical enthalpy change, open circles denote crossbridge enthalpy change. In panel F, filled circles denote mechanical efficiency, open circles denote crossbridge efficiency.
Figure 7
Figure 7. Simulated work‐loops at various preloads but at a constant afterload (Case 5)
Plotting convention is the same as in Fig. 3. Presented here is a scenario that replicates 10 work‐loops of different initial muscle lengths each clamped at the absolute afterload of 18 kPa. Muscle would have shortened to various end‐systolic lengths, as illustrated in panel B. In panel E, filled circles denote mechanical enthalpy change, open circles denote crossbridge enthalpy change. In panel F, filled circles denote mechanical efficiency, open circles denote crossbridge efficiency.
Figure 8
Figure 8. Simulated work‐loops with increasing preloads but decreasing relative afterloads (Case 6)
Plotting convention is the same as in Fig. 3. Presented here is a scenario that replicates work‐loops with increasing preloads but decreasing relative afterloads. This scenario is different from that in Fig. 7 because the relative afterload here is decreasing linearly with initial length (panel C), which is brought about by the end‐systolic stress (absolute afterload) increasing monotonically with initial length (panel A). In panel E, filled circles denote mechanical enthalpy change, open circles denote crossbridge enthalpy change. In panel F, filled circles denote mechanical efficiency, open circles denote crossbridge efficiency.
Figure 9
Figure 9. Enthalpy and efficiency as functions of work
For each of the simulated Cases 1–6 in Figs 3, 4, 5, 6, 7, 8, enthalpy change (filled circles: mechanical enthalpy change; open circles: crossbridge enthalpy change) and efficiency (filled circles: mechanical efficiency; open circles: crossbridge efficiency) are plotted as functions of work: A, Case 1; B, Case 2; C, Case 3; D, Case 4; E, Case 5; and F, Case 6.
Figure 10
Figure 10. Digitised literature data on total efficiency
In each panel, the label of the abscissa retains the original label by the authors. The units of the abscissa have been converted from mmH2O to mmHg, or changed from ‘c.c.’ to ‘ml’. The pressure values labelled in each panel are the afterloads. The panels are presented in chronological order of publication. A, data of Evans & Matsuoka (1915) from a dog heart at 35°C. Data of both total efficiency and venous pressure were tabulated from ‘EXP. 15’. The experiment was performed over a range of arterial pressures (in units of mmHg), which are indicated in the vicinity of the data points. B, total efficiency was calculated from digitising the plots of work and oxygen consumption as functions of diastolic volume, as presented in Figs 5 and 6 of Starling & Visscher (1927). The experiment was conducted on a dog heart with the ‘outputs ranged from 200–1200 c.c. per min., and the pressures from 80–120 mm. Hg’. Diastolic volume was expressed as x + known values, where x represents ‘the lowest value of the volume during the experiment, which is impossible to measure when a cardiometer is used’. C, total efficiency was calculated from digitising the data presented in Fig. 4 of Stella (1931) on work and total energy. The experiment was performed on a tortoise heart at 13°C and at a constant arterial resistance of 15 cmH2O (11 mmHg, as indicated on the plot). D, data were plotted from Table 2 of Neely et al. (1967). The experiments were performed on isolated rat working hearts perfused with buffer containing exogenous glucose at 37°C. With increasing left atrial pressure (preload), the aortic pressure (afterload) increased from 61 to 106 mmHg, as has been indicated in the plot. E, data were plotted from Table 2 of Bünger et al. (1979). The experiments were performed at 38°C on isolated perfused working hearts of the guinea pig maintained at a developed systolic pressure of 60 mmHg. F, data were digitised from Fig. 5C of Goo et al. (2014b) plotting measurements from isolated rat working hearts at 37°C (open circles), and from Fig. 2F of Goo et al. (2014a) from similar measurements at 32°C (filled circles). In both sets of experiments, the hearts contracted against a fixed afterload of 75 mmHg.

Similar articles

Cited by

References

    1. Abraham, D. , & Mao, L. (2015). Cardiac pressure‐volume loop analysis using conductance catheters in mice. Journal of Visualized Experiments, 17(103), 52942. - PMC - PubMed
    1. Abraham, D. M. , Davis, R. T. , Warren, C. M. , Mao, L. , Wolska, B. M. , Solaro, R. J. , & Rockman, H. A. (2016). β‐Arrestin mediates the Frank‐Starling mechanism of cardiac contractility. Proceedings of the National Academy of Sciences, USA, 113(50), 14426–14431. - PMC - PubMed
    1. Ait‐Mou, Y. , Hsu, K. , Farman, G. P. , Kumar, M. , Greaser, M. L. , Irving, T. C. , & Tombe, P. P. (2016). Titin strain contributes to the Frank‐Starling law of the heart by structural rearrangements of both thin‐ and thick‐filament proteins. Proceedings of the National Academy of Sciences, USA, 113(8), 2306–2311. - PMC - PubMed
    1. Anderson, R. L. , Trivedi, D. V. , Sarkar, S. S. , Henze, M. , Ma, W. , Gong, H. , Rogers, C. S. , Gorham, J. M. , Wong, F. L. , Morck, M. M. , Seidman, J. G. , Ruppel, K. M. , Irving, T. C. , Cooke, R. , Green, E. M. , & Spudich, J. A. (2018). Deciphering the super relaxed state of human β‐cardiac myosin and the mode of action of mavacamten from myosin molecules to muscle fibers. Proceedings of the National Academy of Sciences, USA, 115(35), E8143‐E8152. - PMC - PubMed
    1. Asanoi, H. , Sasayama, S. , & Kameyama, T. (1989). Ventriculoarterial coupling in normal and failing heart in humans. Circulation Research, 65(2), 483–493. - PubMed

Publication types