

Homeostasis limits keratinocyte evolution
- PMID: 35998218
- PMCID: PMC9436311
- DOI: 10.1073/pnas.2006487119
Homeostasis limits keratinocyte evolution
Abstract
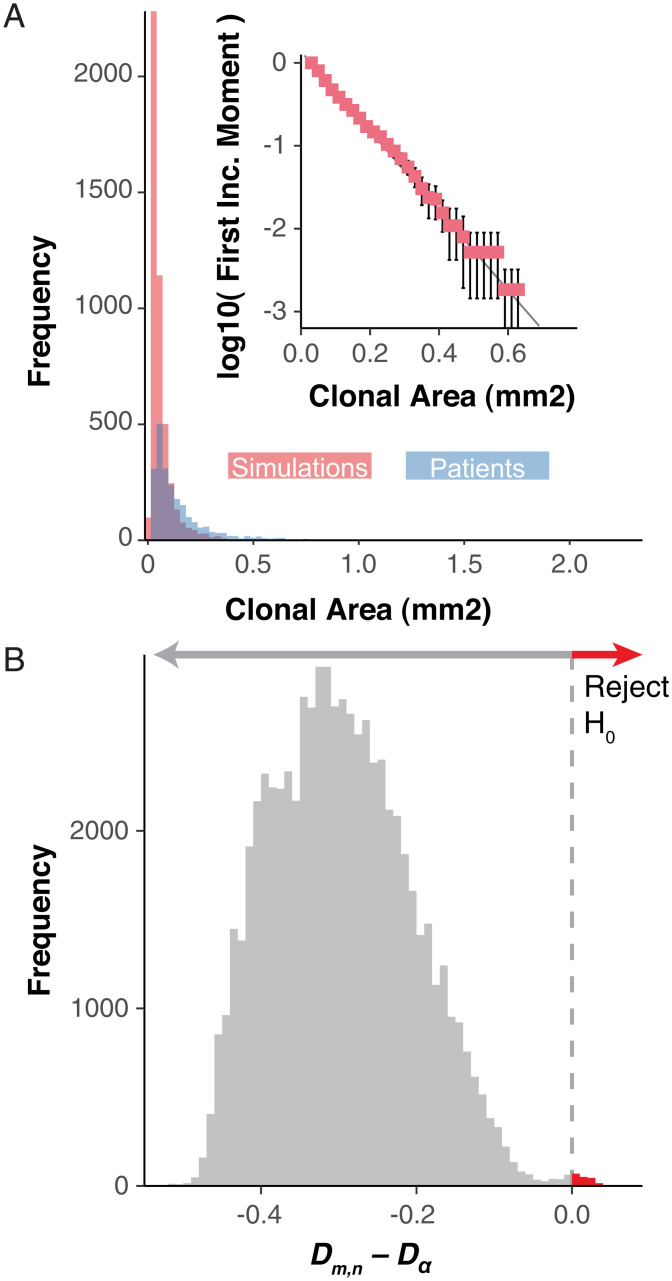
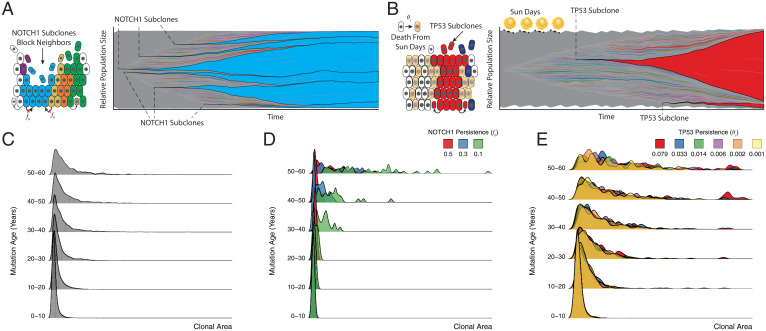
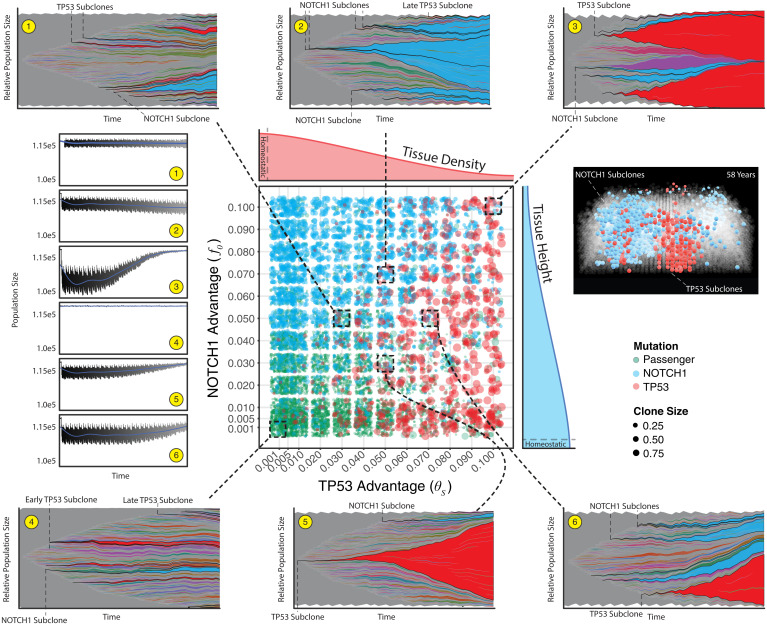
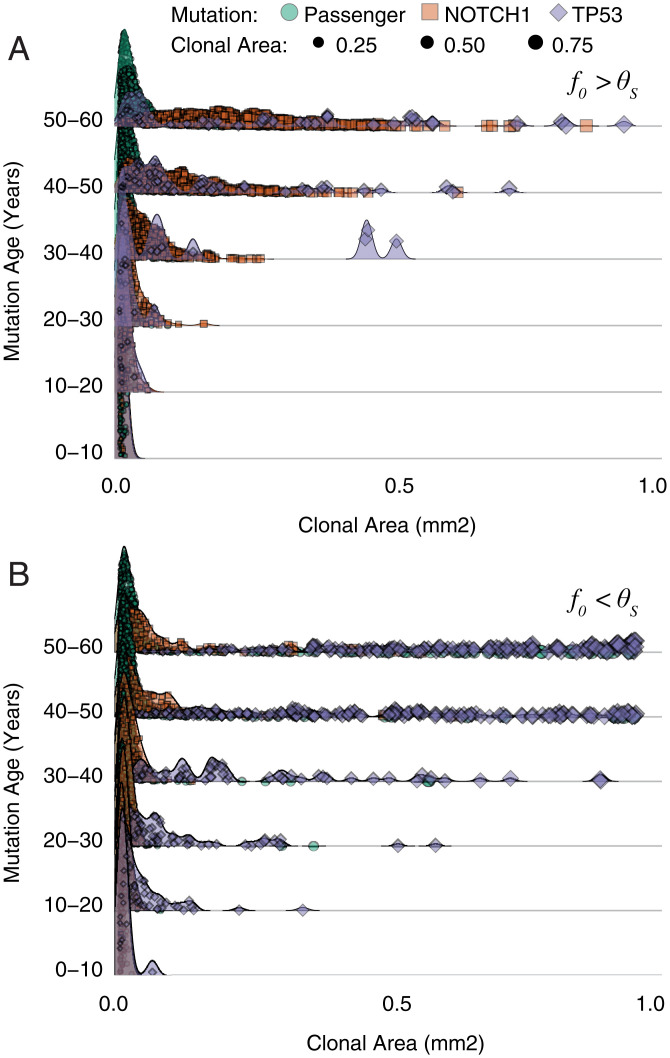
Recent studies have revealed that normal human tissues accumulate many somatic mutations. In particular, human skin is riddled with mutations, with multiple subclones of variable sizes. Driver mutations are frequent and tend to have larger subclone sizes, suggesting selection. To begin to understand the histories encoded by these complex somatic mutations, we incorporated genomes into a simple agent-based skin-cell model whose prime directive is homeostasis. In this model, stem-cell survival is random and dependent on proximity to the basement membrane. This simple homeostatic skin model recapitulates the observed log-linear distributions of somatic mutations, where most mutations are found in increasingly smaller subclones that are typically lost with time. Hence, neutral mutations are "passengers" whose fates depend on the random survival of their stem cells, where a rarer larger subclone reflects the survival and spread of mutations acquired earlier in life. The model can also maintain homeostasis and accumulate more frequent and larger driver subclones if these mutations (NOTCH1 and TP53) confer relatively higher persistence in normal skin or during tissue damage (sunlight). Therefore, a relatively simple model of epithelial turnover indicates how observed passenger and driver somatic mutations could accumulate without violating the prime directive of homeostasis in normal human tissues.
Keywords: carcinogenesis; keratinocyte biology; mathematical modeling; somatic evolution.
Conflict of interest statement
The authors declare no competing interest.
Figures
Similar articles
-
Measuring the distribution of fitness effects in somatic evolution by combining clonal dynamics with dN/dS ratios.Elife. 2020 Mar 30;9:e48714. doi: 10.7554/eLife.48714. Elife. 2020. PMID: 32223898 Free PMC article.
-
Single cell analysis revealed a coexistence of NOTCH1 and TP53 mutations within the same cancer cells in chronic lymphocytic leukaemia patients.Br J Haematol. 2017 Sep;178(6):979-982. doi: 10.1111/bjh.14176. Epub 2016 Jul 29. Br J Haematol. 2017. PMID: 27470445 No abstract available.
-
Use of signals of positive and negative selection to distinguish cancer genes and passenger genes.Elife. 2021 Jan 11;10:e59629. doi: 10.7554/eLife.59629. Elife. 2021. PMID: 33427197 Free PMC article.
-
Cancer heterogeneity: converting a limitation into a source of biologic information.J Transl Med. 2017 Sep 8;15(1):190. doi: 10.1186/s12967-017-1290-9. J Transl Med. 2017. PMID: 28886708 Free PMC article. Review.
-
Order Matters: The Order of Somatic Mutations Influences Cancer Evolution.Cold Spring Harb Perspect Med. 2017 Apr 3;7(4):a027060. doi: 10.1101/cshperspect.a027060. Cold Spring Harb Perspect Med. 2017. PMID: 28096247 Free PMC article. Review.
Cited by
-
On the patterns of genetic intra-tumor heterogeneity before and after treatment.Genetics. 2025 Aug 6;230(4):iyaf101. doi: 10.1093/genetics/iyaf101. Genetics. 2025. PMID: 40439127 Free PMC article.
-
Gattaca: Base-Pair Resolution Mutation Tracking for Somatic Evolution Studies using Agent-based Models.Mol Biol Evol. 2022 Apr 11;39(4):msac058. doi: 10.1093/molbev/msac058. Mol Biol Evol. 2022. PMID: 35298641 Free PMC article.
-
A seven-step guide to spatial, agent-based modelling of tumour evolution.Evol Appl. 2024 May 2;17(5):e13687. doi: 10.1111/eva.13687. eCollection 2024 May. Evol Appl. 2024. PMID: 38707992 Free PMC article. Review.
-
The role of environmentally mediated drug resistance in facilitating the spatial distribution of residual disease.Commun Biol. 2025 Aug 9;8(1):1189. doi: 10.1038/s42003-025-08585-9. Commun Biol. 2025. PMID: 40783466 Free PMC article.
-
Mutation divergence over space in tumour expansion.J R Soc Interface. 2023 Nov;20(208):20230542. doi: 10.1098/rsif.2023.0542. Epub 2023 Nov 22. J R Soc Interface. 2023. PMID: 37989227 Free PMC article.
References
-
- Yokoyama A., et al. , Age-related remodelling of oesophageal epithelia by mutated cancer drivers. Nature 565, 312–317 (2019). - PubMed
Publication types
MeSH terms
Substances
Grants and funding
LinkOut - more resources
Full Text Sources
Research Materials
Miscellaneous
