. 2022 Aug 23;13(1):4844.
doi: 10.1038/s41467-022-32398-7.

Multiancestry exome sequencing reveals INHBE mutations associated with favorable fat distribution and protection from diabetes

Collaborators, Affiliations

Multiancestry exome sequencing reveals INHBE mutations associated with favorable fat distribution and protection from diabetes

Parsa Akbari et al. Nat Commun. .

Abstract

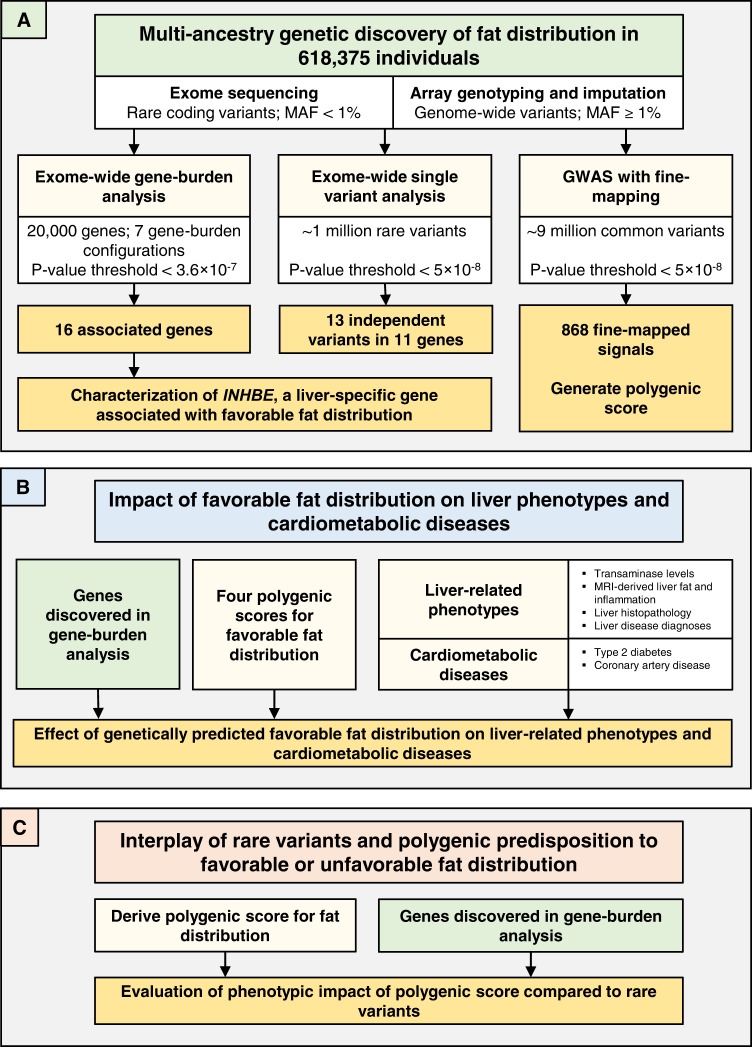
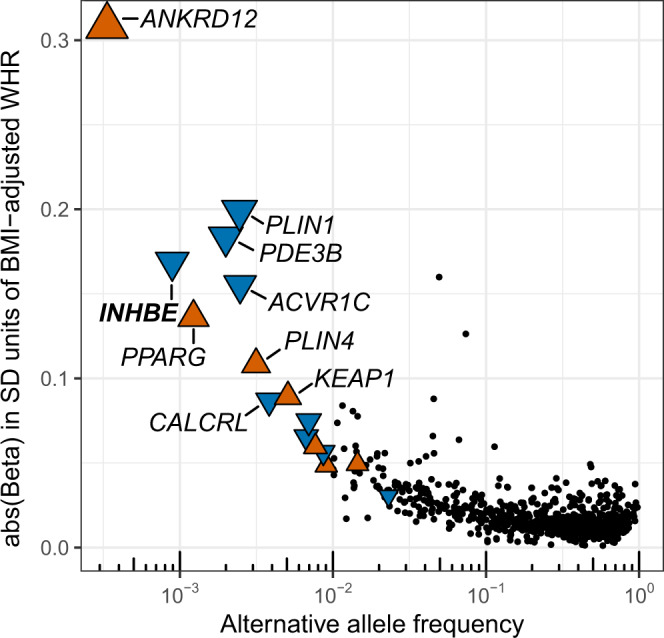
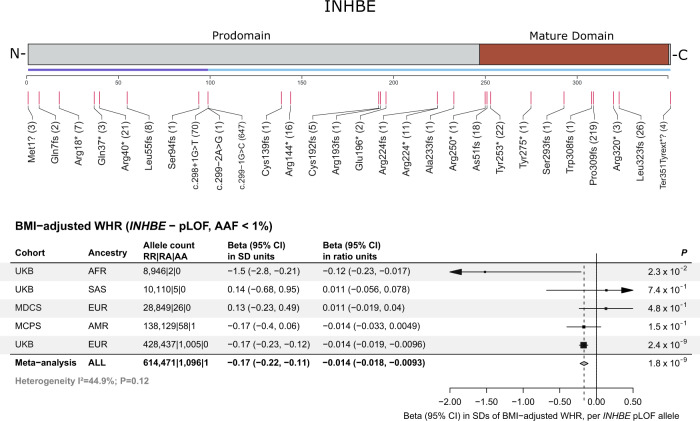
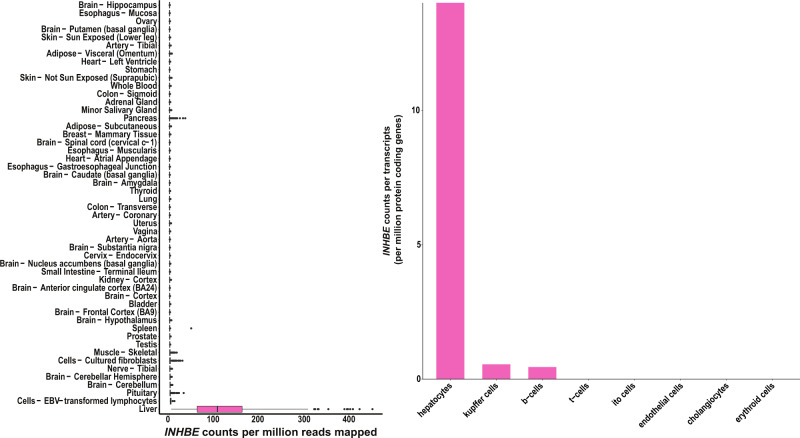
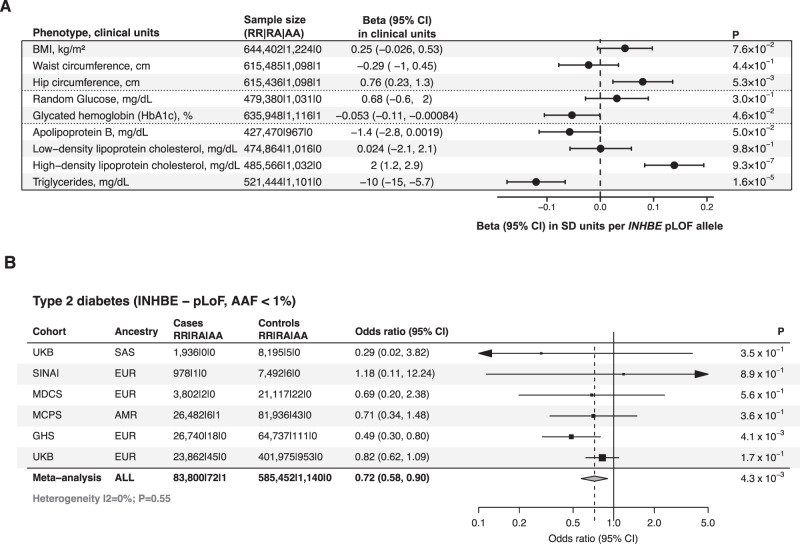
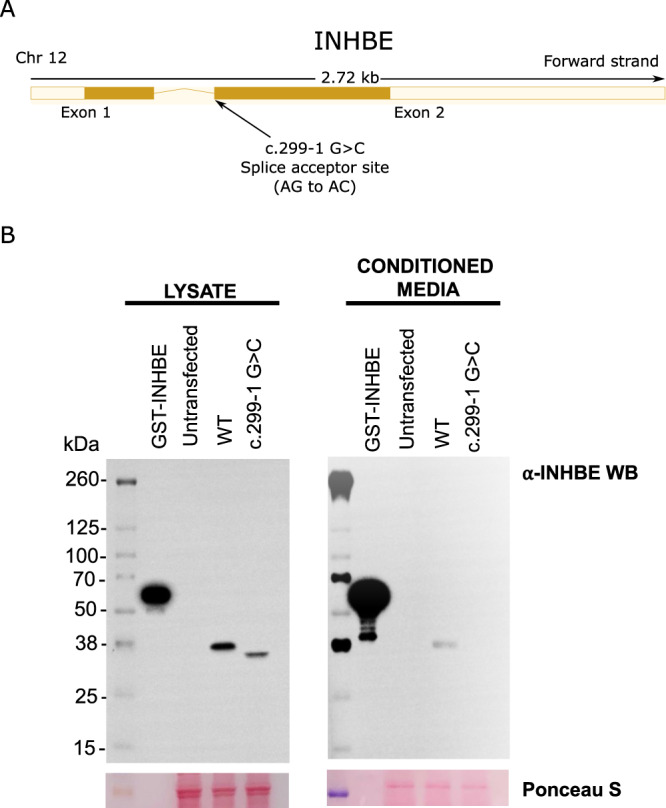
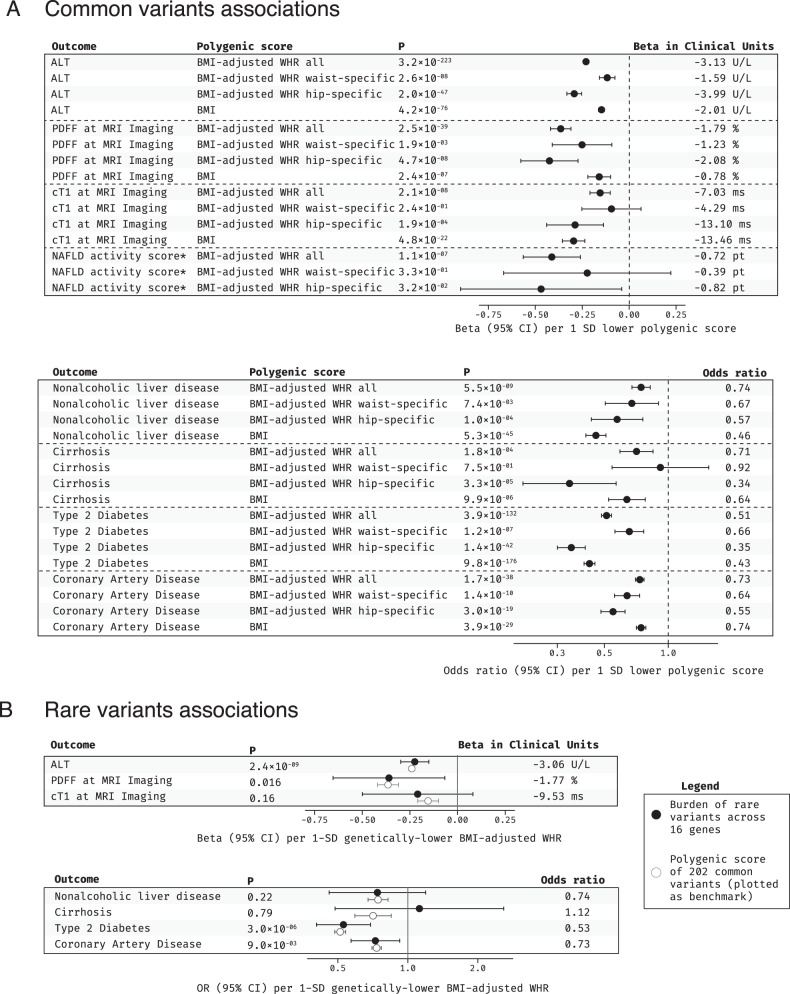
Body fat distribution is a major, heritable risk factor for cardiometabolic disease, independent of overall adiposity. Using exome-sequencing in 618,375 individuals (including 160,058 non-Europeans) from the UK, Sweden and Mexico, we identify 16 genes associated with fat distribution at exome-wide significance. We show 6-fold larger effect for fat-distribution associated rare coding variants compared with fine-mapped common alleles, enrichment for genes expressed in adipose tissue and causal genes for partial lipodystrophies, and evidence of sex-dimorphism. We describe an association with favorable fat distribution (p = 1.8 × 10-09), favorable metabolic profile and protection from type 2 diabetes (~28% lower odds; p = 0.004) for heterozygous protein-truncating mutations in INHBE, which encodes a circulating growth factor of the activin family, highly and specifically expressed in hepatocytes. Our results suggest that inhibin βE is a liver-expressed negative regulator of adipose storage whose blockade may be beneficial in fat distribution-associated metabolic disease.


Conflict of interest statement

Regeneron authors receive salary from and own options and/or stock of the company. G.D.Y is the Chief Scientific Officer and member of the Board of Directors at Regeneron Pharmaceuticals; A.J.M is an Executive Officer of Regeneron Pharmaceuticals. L.A.L., P.A., O.S., M.A.R.F., and A.B. are inventors on provisional patent applications (63/233,258 and 63/274,595), U.S. non-provisional applications (17/549,692, and 17/711,137), and PCT international application (PCT/US21/63150) submitted by RGC relating to INHBE genetics. N.V., O.S., P.A., A.L., A.B., and L.A.L. are inventors on U.S. non-provisional applications (17/740,382), and PCT international application (PCT/US22/28415) submitted by RGC relating to PDE3B genetics. Other co-authors did not declare competing interests.

Figures

Fig. 1
Fig. 1. Study overview.
We performed three major groups of analyses, illustrated in (AC). A outlines the multi-ancestry genetic discovery analysis for BMI-adjusted WHR. B summarizes association analyses for genetically determined fat distribution, liver health parameters and cardiometabolic disease. C outlines the evaluation of common and rare variant interplays in fat distribution. MAF minor allele frequency, GWAS genome-wide association study, MRI magnetic resonance imaging.
Fig. 2
Fig. 2. Associations with BMI-adjusted WHR for common and rare alleles in the multi-ancestry analysis.
The 16 genes with exome-wide significant gene-burden associations are shown as colored triangles, with the triangles pointing upwards (orange) or downwards (blue) indicating associations with higher and lower BMI-adjusted WHR, respectively. The 868 fine-mapped common variants are indicated as black dots. The alternative allele frequency for each variant or gene-burden genotype is indicated on the x-axis. SD standard deviation, WHR waist to hip ratio, BMI body mass index.
Fig. 3
Fig. 3. Protein-truncating variants in INHBE associated with favorable fat distribution.
The top panel is a linear model of the INHBE protein with prodomain and mature domains in gray and brown, respectively. An exon track shows the two exons of the gene (in purple and blue). Predicted loss of function (pLOF) variants identified by exome-sequencing and included in the gene-burden analysis are shown below the exon track, with numbers in parenthesis corresponding to the number of carriers for each allele. The bottom panel shows associations with fat distribution for pLOF variants in INHBE across cohorts. P-values are from two-sided Wald tests. Markers represent the beta estimates while error bars represent 95% confidence intervals. The gray diamond represents meta-analysis estimates. BMI body mass index, WHR waist-hip ratio, pLOF predicted loss of function, AAF alternative allele frequency, UKB UK Biobank, MDCS Malmö Diet and Cancer Study, MCPS Mexico City Prospective Study, AFR African ancestry, SAS south-Asian ancestry, EUR European ancestry, AMR admixed-American ancestry, RR reference-reference homozygous genotype, RA reference-alternative heterozygous genotype, AA alternative-alternative homozygous genotype, CI confidence interval, SD standard deviations, P P-value.
Fig. 4
Fig. 4. INHBE mRNA expression in humans across tissues and liver cell-types.
The left panel shows normalized mRNA expression for INHBE in counts per million (CPM) across tissues from the Genotype Tissue Expression (GTEx) consortium, box plots depict the median, interquartile range, and range of CPM values across individuals for each tissue. The right panel shows normalized cell-type specific expression within liver in counts per transcripts per million protein coding genes (pTPM) from the Human Protein Atlas (HPA).
Fig. 5
Fig. 5. Association of INHBE pLOF variants with favorable metabolic profile and protection from type 2 diabetes.
A shows associations with anthropometric and metabolic phenotypes, including 645,626 individuals. P-values are from two-sided Wald tests. Markers represent estimated beta coefficients, while error bars represent 95% confidence intervals. B shows a meta-analysis of the association with type 2 diabetes risk, including a total of 83,873 cases and 586,592 controls. P-values are from two-sided Wald tests. Markers represent estimated odds ratios, while error bars represent 95% confidence intervals. The gray diamond represents meta-analysis estimates. AAF alternative allele frequency; BMI body mass index; RR reference-reference homozygous genotype; RA reference-alternative heterozygous genotype; AA alternative-alternative homozygous genotype; CI confidence intervals; P P-value; SD standard deviation; pLOF predicted loss of function; kg kilogram; m2 meter squared; mg milligram; dL deciliter; cm centimeter; UKB UK Biobank study; SINAI Mount Sinai BioMe cohort; MDCS Malmö Diet and Cancer Study; MCPS Mexico City Prospective Study; GHS Geisinger Health System; EUR European; SAS South Asian; AMR American; ALL all ancestries pooled.
Fig. 6
Fig. 6. In vitro expression of the INHBE c.299-1G>C splice acceptor variant.
A shows a gene model for INHBE with the predicted loss of function splice acceptor variant (c.299-1G>C) highlighted. B shows a Western blot analysis for INHBE protein in cell lysates and conditioned media from CHO cells transfected with wild-type INHBE or the INHBE c.299-1G>C splice acceptor variant. Full length GST-tagged recombinant INHBE protein (100 ng) was used as a positive control and staining with Ponceau S was used to compare sample loading across samples. The image is representative of one of three technical replicates. Each replicate yielded similar results. Chr chromosome, CHO Chinese hamster ovary, GST Glutathione s-transferase, WT wild type, kDa kilodalton, WB western blot, Ponceau S Ponceau S (Acid Red 112).
Fig. 7
Fig. 7. Genetic associations of favorable fat distribution with liver phenotypes, type 2 diabetes and coronary artery disease risk.
A shows associations for common variants polygenic scores for favorable fat distribution; associations for a BMI polygenic score are shown for comparison. Markers and error bars represent beta coefficients (for continuous traits) or odds ratios (for binary traits) and their 95% confidence intervals. P-values are from two-sided Wald tests. Sample sizes: ALT, 442,695; PDFF at MRI imaging, 38,915; cT1 at MRI imaging, 38,915; NAFLD activity score, 3572; nonalcoholic liver disease, 14,195 cases and 428,139 controls; cirrhosis, 4063 cases and 428,139 controls; type 2 diabetes, 58,379 cases and 530,072 controls; coronary artery disease, 89,202 cases and 342,007 controls; *NAFLD activity score measured by liver biopsy, the association for the BMI polygenic score was not estimated for this phenotype as it is only available in bariatric surgery patients with extremely high BMI. B shows associations for rare coding variants (full black circles) and a common-variant polygenic score for lower BMI-adjusted WHR (open circles; shown as benchmark). Markers and error bars represent beta coefficients (for continuous traits) or odds ratios (for binary traits) and their 95% confidence intervals. P-values are from two-sided Wald tests. P-values are from two-sided Wald tests. ALT, 542,904; PDFF at MRI imaging, 37,686; cT1 at MRI imaging, 37,686; NAFLD activity score, 3565; nonalcoholic liver disease, 15,858 cases and 468,523 controls; cirrhosis, 4950 cases and 466,464 controls; types 2 diabetes, 66,062 cases and 530,538 controls; coronary artery disease, 92,824 cases and 361,297 controls. ALT alanine aminotransferase, PDFF proton-density liver fat fraction, MRI magnetic resonance imaging, cT1 corrected T1, NAFLD nonalcoholic fatty liver disease, BMI body mass index, WHR waist-hip ratio, P P-value, CI confidence intervals, SD standard deviation, U/L units per liter, ms milliseconds, pt point.

References

    1. Danforth E., Jr Failure of adipocyte differentiation causes type II diabetes mellitus? Nat. Genet. 2000;26:13. doi: 10.1038/79111. - DOI - PubMed
    1. O’Rahilly S. Harveian Oration 2016: Some observations on the causes and consequences of obesity. Clin. Med. (Lond.) 2016;16:551–564. doi: 10.7861/clinmedicine.16-6-551. - DOI - PMC - PubMed
    1. Shulman GI. Ectopic fat in insulin resistance, dyslipidemia, and cardiometabolic disease. N. Engl. J. Med. 2014;371:1131–1141. doi: 10.1056/NEJMra1011035. - DOI - PubMed
    1. Stefan N, Haring HU, Hu FB, Schulze MB. Metabolically healthy obesity: epidemiology, mechanisms, and clinical implications. Lancet Diabetes Endocrinol. 2013;1:152–162. doi: 10.1016/S2213-8587(13)70062-7. - DOI - PubMed
    1. Virtue S, Vidal-Puig A. Adipose tissue expandability, lipotoxicity and the metabolic syndrome-an allostatic perspective. Biochim Biophys. Acta. 2010;1801:338–349. doi: 10.1016/j.bbalip.2009.12.006. - DOI - PubMed

Publication types