. 2022 Dec;23(6):701-720.
doi: 10.1007/s10162-022-00863-1. Epub 2022 Aug 23.

Expression and Neurotransmitter Association of the Synaptic Calcium Sensor Synaptotagmin in the Avian Auditory Brain Stem

Affiliations

Expression and Neurotransmitter Association of the Synaptic Calcium Sensor Synaptotagmin in the Avian Auditory Brain Stem

Katrina M MacLeod et al. J Assoc Res Otolaryngol. 2022 Dec.

Abstract

In the avian auditory brain stem, acoustic timing and intensity cues are processed in separate, parallel pathways via the two divisions of the cochlear nucleus, nucleus angularis (NA) and nucleus magnocellularis (NM). Differences in excitatory and inhibitory synaptic properties, such as release probability and short-term plasticity, contribute to differential processing of the auditory nerve inputs. We investigated the distribution of synaptotagmin, a putative calcium sensor for exocytosis, via immunohistochemistry and double immunofluorescence in the embryonic and hatchling chick brain stem (Gallus gallus). We found that the two major isoforms, synaptotagmin 1 (Syt1) and synaptotagmin 2 (Syt2), showed differential expression. In the NM, anti-Syt2 label was strong and resembled the endbulb terminals of the auditory nerve inputs, while anti-Syt1 label was weaker and more punctate. In NA, both isoforms were intensely expressed throughout the neuropil. A third isoform, synaptotagmin 7 (Syt7), was largely absent from the cochlear nuclei. In nucleus laminaris (NL, the target nucleus of NM), anti-Syt2 and anti-Syt7 strongly labeled the dendritic lamina. These patterns were established by embryonic day 18 and persisted to postnatal day 7. Double-labeling immunofluorescence showed that Syt1 and Syt2 were associated with vesicular glutamate transporter 2 (VGluT2), but not vesicular GABA transporter (VGAT), suggesting that these Syt isoforms were localized to excitatory, but not inhibitory, terminals. These results suggest that Syt2 is the major calcium binding protein underlying excitatory neurotransmission in the timing pathway comprising NM and NL, while Syt2 and Syt1 regulate excitatory transmission in the parallel intensity pathway via cochlear nucleus NA.

Keywords: Auditory nerve; Avian; Cochlear nucleus; Nucleus angularis; Nucleus magnocellularis; Synaptotagmin; VGAT; VGluT.


Conflict of interest statement

The authors declare no competing interests.

Figures

Fig. 1
Fig. 1
Anti-Syt2 (znp-1) label showed abundant expression in the avian auditory brainstem nuclei in hatchling (P1) chick. A Low power montage of dorsal right quadrant of transverse brain stem section. Dense label observed in NM, NL, and NA, as well as MVN, but absent from fiber tracts surrounding NM and NL. White boxes indicate location of panels BE. Schematic below shows outlines of nuclei. Scale bar: 300 µm. B Dense label surrounded NM cell bodies, resembling axosomatic endbulb terminals. Scale bar: 50 µm, applies to panels BE. C NA showed anti-Syt2 label throughout the neuropil, surrounding negative cell bodies. D Dense anti-Syt2 label was found in the dorsal and ventral dendritic fields of the medial NL. E Dispersed anti-Syt2 puncta were found in the dorsal and ventral dendritic fields of lateral NL
Fig. 2
Fig. 2
Anti-Syt1label was heterogeneous among the auditory nuclei in the hatchling (P1) chick. Panel organization similar to Fig. 1. A Low power montage of dorsal right quadrant of transverse brain stem section showed weak labeling the timing nuclei NM and NL, but abundant labeling in NA. White boxes indicate location of panels BE. Schematic below shows outlines of nuclei. Scale bar: 300 µm. B Anti-Syt1 label in NM was punctate surrounding cell bodies but did not resemble endbulbs. Scale bar: 50 µm, applies to panels BF. C Dense labeling of the neuropil throughout NA. D Anti-Syt1 label in medial NL was found in sparse puncta. E Lateral region of NL showed dense anti-Syt1 label. F Syt1 label was also evident in the SON (different section)
Fig. 3
Fig. 3
Anti-Syt1 labeling revealed fibers innervating NL from a dorsally located local neuron (asterisk). Dotted lines outline the cell body layer of NL. Scale bar: 30 µm
Fig. 4
Fig. 4
Anti-Syt7 label was heterogeneous among the auditory nuclei. A Low power montage of dorsal right quadrant of transverse brain stem section showed weak labeling of the cochlear nuclei NA and NM, while there was robust labeling of NL dendritic fields, as well as MVN and non-auditory brain stem tissue. Panel organization similar to Figs. 1 and 2. White boxes indicate location of panels BE. Schematic below shows outlines of nuclei. Scale bar: 300 µm. B Anti-Syt7 label in NM was weak and punctate where present. Scale bar: 50 µm, applies to panels BE. C Anti-Syt7 was nearly absent from NA, although a few densely labeled fibers of unknown origin penetrated medial margins. D In NL, diffuse labeling was seen in the dendritic lamina. E Punctate anti-Syt7 label was abundant in the SON (different section). F Anti-Syt7 robustly labeled Purkinje cell bodies and their apical dendrites in the cerebellum. Scale bar: 50 µm
Fig. 5
Fig. 5
Optical density (OD) analysis of anti-Syt2 label across the tonotopic axes of NM (A), NA (B), and NL (C, D). Each nucleus was divided into three regions of interest (schematics in panels Ai–Ci) and the average OD measured. Relative best frequency (BF) color coded as gray/black: higher BF, cyan: lower BF, pink: middle BF. (Aii) In NM, Syt2 label was slightly more abundant in lateral (lower BF) NM than medial (higher BF) NM (N = 7 sections, P = 0.0391, Wilcoxon-matched pairs signed rank test). No tonotopic differences were observed for Syt1 or Syt7 label in NM or for any Syt isoform in NA (Bii). Analysis in AB pooled across 4 subjects. (Cii) Analysis of Syt1 label showed a significant, though small, tonotopic effect across mediolateral divisions of NL (one-way ANOVA, N = 11 Sects. (4 subjects), F(2, 20) = 4.546, P = 0.0236; medial vs lateral, P = 0.0218, Holm-Šídák’s multiple comparison test). (Di) Detailed analysis of Syt1 label in NL from 4 sequential rostrocaudal sections, subdivided into 2–3 mediolateral sectors: [2, 3], [4–6], [7–9], and [10–11]. A significant effect was observed in the caudolateral extreme of NL (sector 10 vs 11, Wilcoxon-matched pairs ranked test, N = 6 Sects. (3 subjects), P = 0.0312). All statistical comparisons were made within section. (Dii) Extreme caudolateral area of NL corresponding to sector 11 showed anti-Syt1 labeling of fiber innervation. Scale bar: 100 µm
Fig. 6
Fig. 6
Synaptotagmin protein expression showed small but significant developmental changes across the auditory brain stem. A Representative images showing developmental changes in expression of Syt2 (left panel), Syt1 (middle panel), and Syt7 (right panel) in NM (top row in each set of panels), NA (middle row), and NL (bottom row). Columns within each panel shows representative images per age group: E18, hatchlings (P1), or week-old chicks (P7). B Summary of optical density changes with development for Syt2 (i), Syt1 (ii), and Syt7 (iii). Mean OD was measured from the whole nucleus as a region of interest in each section, pooled across 3 or 4 subjects for each nucleus and age (see “Materials and Methods” section). Statistically significant effects of age were observed for anti-Syt2 (two-way ANOVA, main effect by age: F(6, 154) = 0.3953, P = 0.0012), anti-Syt1 (F(2, 128) = 9.365, P = 0.0002), and anti-Syt7 (F(2, 147) = 14.91, P < 0.0001). Asterisks indicate significant Tukey’s multiple comparisons tests (*P < 0.05, **P < 0.01, ****P < 0.0001). Significant effects by nucleus were also found (see text)
Fig. 7
Fig. 7
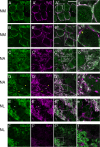
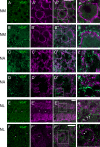
Syt2 and Syt1 were both associated with glutamatergic terminals. Double immunofluorescent labeling of VGluT2 (green) with Syt2 or Syt1(magenta, alternating rows) and merged images (right two columns) acquired as confocal single plane images at 63 × magnification from NM (A, B), NA (C, D), and medial region of NL (E, F). Far right panels (af) are zoomed in areas (white boxes) from panels A″–F″. Scale bar: 30 µm applies to all panels except a–f. A VGluT2 and Syt2 colocalized and appeared to be within putative endbulb synaptic endings onto NM cell bodies. B Syt1 had some areas of non-overlap with VGluT2 (arrowhead). C, D In NA, VGluT2 densely labeled dendritic neuropil. Syt2 and Syt1 both colocalized with VGluT2 in the dendritic plexus. VGlut2-negative Syt1-positive fibers or en passant synaptic contacts (arrowheads, D–D′) wrapping NA somata (asterisk) were observed. E VGluT2 and Syt2 both densely labeled the NL dendritic lamina and colocalized there. Syt2-positive, VGlutT2-negative fibers, or en passant contacts were observed apposed to cell bodies (asterisk). F Syt1 expression was extremely sparse in medial NL with little or no colocalization
Fig. 8
Fig. 8
Syt2 and Syt1 were largely not associated with VGAT + terminals. Panels organized as in Fig. 6 but for VGAT (green) colabeling with Syt1 and Syt2 (magenta). A In NM, VGAT positive puncta were distributed in the extracellular matrix between NM cell bodies (A′), and interdigitated with Syt2 positive presumed endbulbs (A′–A″, a), with little to no overlap. Scale bar: 30 µm applies to panels A–D″. B Syt1 and VGAT also showed almost no overlap in NM. C In NA, anti-VGAT and anti-Syt2 (and anti-Syt1 in panels in D) both label many profiles throughout NA, but do not overlap. E In medial NL, VGluT2 and Syt2 both densely labeled dendritic region but were not colocalized. VGAT + /Syt2 − puncta lined the somata in the cell body layer (arrows panel e). Scale bar: 30 µm. F Rare Syt1 + fiber that innervated NL with profiles surrounding the cell body (asterisk) was also VGAT − (arrowheads in panel f)
Fig. 9
Fig. 9
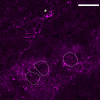
Anti-Syt1 (green) and anti-Syt2 (magenta) label showed substantial but partial overlap in expression in NM (A) and NA (B). C In lateral NL, Syt1 and Syt2 show little colocalization. Scale bars: 30 µm (A, B) and 50 µm (C). In all nuclei, singly labeled (yellow arrowheads) and doubly labeled (white arrows) profiles can be found
Fig. 10
Fig. 10
Syt7 immunofluorescence colocalization with Syt1 and Syt2. Anti-Syt2 (green) and anti-Syt7 (magenta) label showed little overlap in expression in NM (A) and NA (B) while some colocalization was observed in the neuropil of NL (C). In lateral NL, anti-Syt1 (green) showed no significant colocalization with Syt7 (D). Scale bars: 30 µm

Similar articles

Cited by

References

    1. Adolfsen B, Saraswati S, Yoshihara M, Littleton JT. Synaptotagmins are trafficked to distinct subcellular domains including the postsynaptic compartment. J Cell Biology. 2004;166:249–260. doi: 10.1083/jcb.200312054. - DOI - PMC - PubMed
    1. Agmon-Snir H, Carr CE, Rinzel J. The role of dendrites in auditory coincidence detection. Nature. 1998;393:1–5. doi: 10.1038/30505. - DOI - PubMed
    1. Ahn J, MacLeod KM. Target-specific regulation of presynaptic release properties at auditory nerve terminals in the avian cochlear nucleus. J Neurophysiol. 2016;115:1679–1690. doi: 10.1152/jn.00752.2015. - DOI - PMC - PubMed
    1. Bacaj T, Wu D, Yang X, et al. Synaptotagmin-1 and synaptotagmin-7 trigger synchronous and asynchronous phases of neurotransmitter release. Neuron. 2013;80:947–959. doi: 10.1016/j.neuron.2013.10.026. - DOI - PMC - PubMed
    1. Bouhours B, Gjoni E, Kochubey O, Schneggenburger R. Synaptotagmin2 (Syt2) drives fast release redundantly with Syt1 at the output synapses of parvalbumin-expressing inhibitory neurons. J Neurosci. 2017;37:4604–4617. doi: 10.1523/jneurosci.3736-16.2017. - DOI - PMC - PubMed

Publication types

LinkOut - more resources