. 2022 Aug 23;12(1):14387.
doi: 10.1038/s41598-022-18562-5.

Cytoskeletal assembly in axonal outgrowth and regeneration analyzed on the nanoscale

Affiliations

Cytoskeletal assembly in axonal outgrowth and regeneration analyzed on the nanoscale

Max Hofmann et al. Sci Rep. .

Abstract

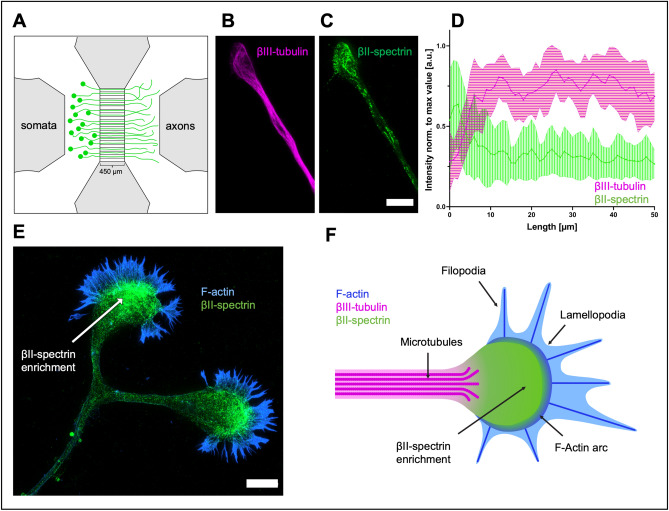
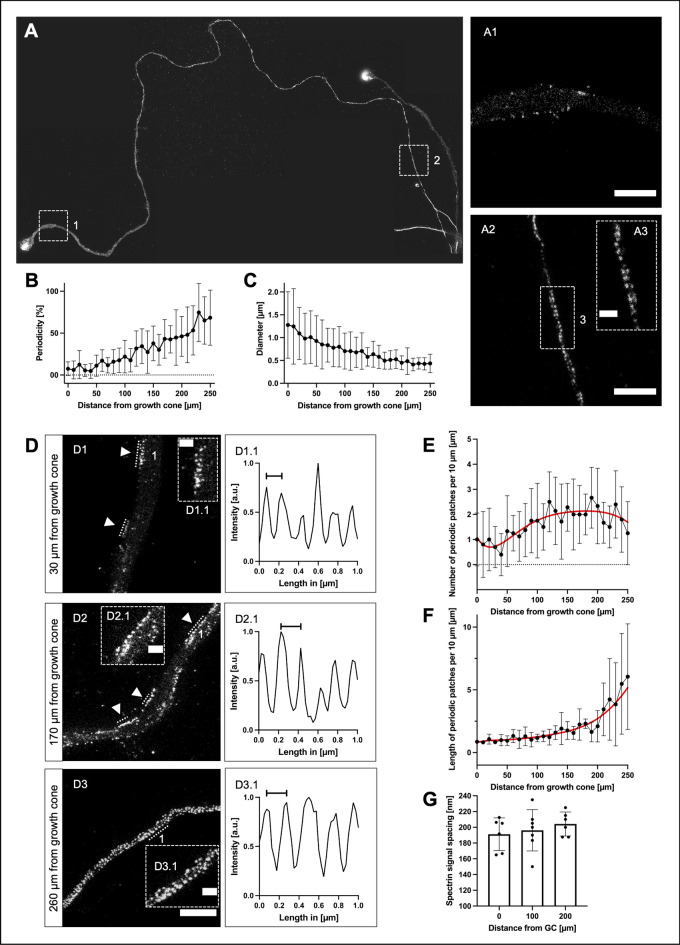
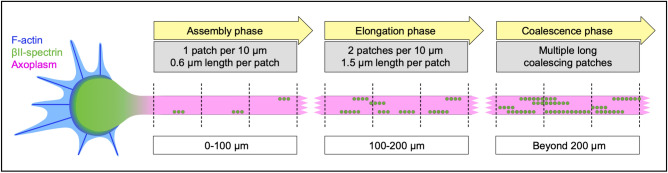
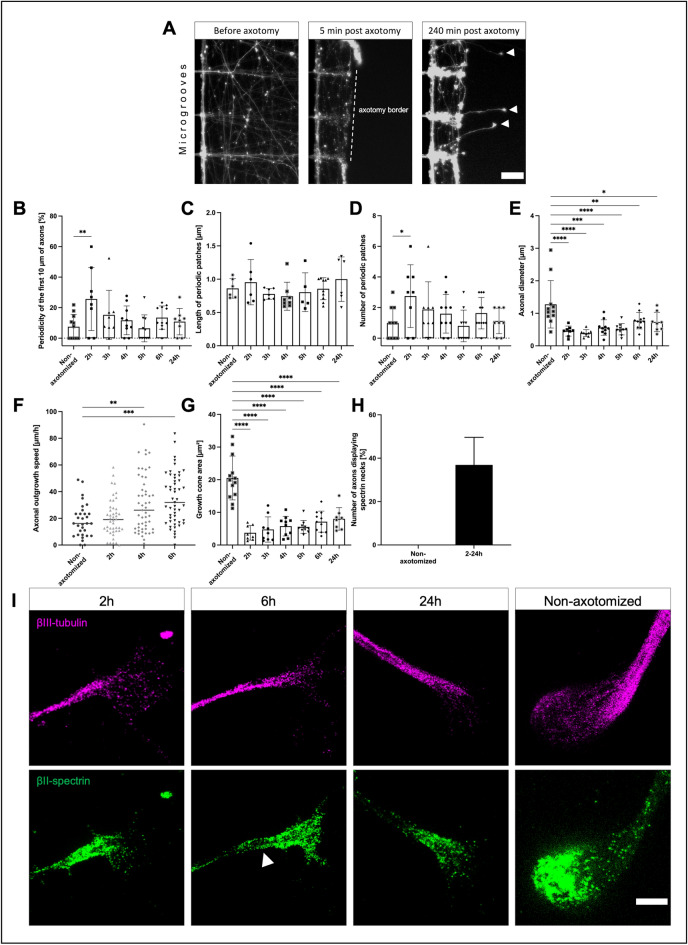
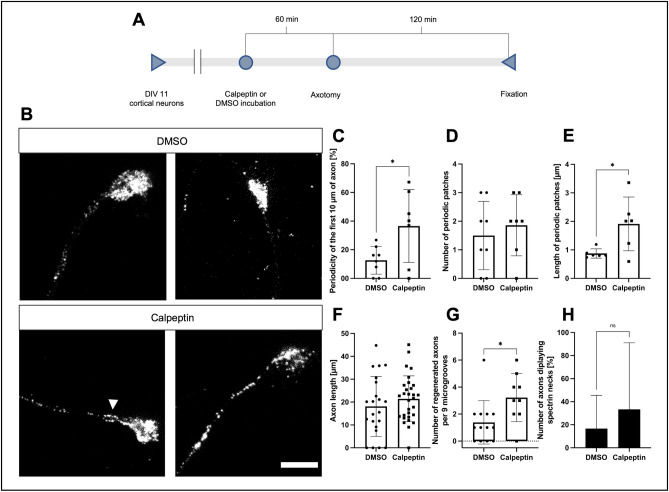
The axonal cytoskeleton is organized in a highly periodic structure, the membrane-associated periodic skeleton (MPS), which is essential to maintain the structure and function of the axon. Here, we use stimulated emission depletion microscopy of primary rat cortical neurons in microfluidic chambers to analyze the temporal and spatial sequence of MPS formation at the distal end of growing axons and during regeneration after axotomy. We demonstrate that the MPS does not extend continuously into the growing axon but develops from patches of periodic βII-spectrin arrangements that grow and coalesce into a continuous scaffold. We estimate that the underlying sequence of assembly, elongation, and subsequent coalescence of periodic βII-spectrin patches takes around 15 h. Strikingly, we find that development of the MPS occurs faster in regenerating axons after axotomy and note marked differences in the morphology of the growth cone and adjacent axonal regions between regenerating and unlesioned axons. Moreover, we find that inhibition of the spectrin-cleaving enzyme calpain accelerates MPS formation in regenerating axons and increases the number of regenerating axons after axotomy. Taken together, we provide here a detailed nanoscale analysis of MPS development in growing axons.


Conflict of interest statement

The authors declare no competing interests.

Figures

Figure 1
Figure 1
Distribution of βII-spectrin and βIII-tubulin along the axon and the growth cone in non-axotomized rat cortical neurons. (A) Schematic drawing of a microfluidic chamber seeded with primary cortical neurons in the somatic department, transduced with AAV.EGFP virus. These neurons extend their axons through the microgrooves (length: 450 µm) into the axonal compartment within 11 days (green cells). (B and C) STED images of cortical neurons stained for spectrin and tubulin. Note that spectrin is enriched in the growth cone while tubulin concentration is decreased. Scale bar 5 µm. (D) Quantification of line intensity scans along the axon, starting from the growth cone tip. Spectrin fluorescence intensity peaks at the growth cone, whereas the tubulin signal is lower compared to the axon. Data is represented as mean ± SD. At least 5 biological replicates were analyzed, 11 axons were analyzed in total. (E) Representative STED image of a growth cone stained for spectrin and F-actin. Spectrin is enriched close to the actin filaments. Scale bar 5 µm. (F) Schematic drawing of a growth cone, showing an enrichment of βII-spectrin in the apical central domain of the GC and microtubules splaying into the GC. The depicted F-actin arc resembles the transition domain, whereas microtubules splay into the central domain of the GC.
Figure 2
Figure 2
Development of the membrane-associated periodic skeleton along the growing axon. (A) Representative image of an axon with its growth cone, stained for spectrin, stitched from multiple STED images, up to 270 µm towards soma. A1 shows an enlarged axon section at 10 µm distance from the growth cone, no periodicity is visible (scale bar 2 µm). A2 shows an enlarged section of A, 270 µm from the growth cone (scale bar 2 µm). A3 shows an enlarged section of A2, MPS is clearly visible (scale bar 0.5 µm). (B) Graphical display of the development of periodicity over the length of the axon, starting from the growth cone base. Periodicity is increasing linearly towards the soma. Data is represented as mean ± SD. At least 5 biological replicates were analyzed, 11 axons were analyzed in total. Because of limitations in following axons back for extended lengths, not all axons could be included at distal points. (C) Reduction of the axonal diameter over the length of the axon, starting from the growth cone base, contrariwise to (B). Data is represented as mean ± SD. At least 5 biological replicates were analyzed, 11 axons were analyzed in total. Because of limitations in following axons back for extended lengths, not all axons could be included at distal points. (D) Three sections of an axon stained for spectrin, showing different stages of MPS development, were imaged using STED microscopy. D1 is 30 µm afar from the growth cone, D2 170 µm, and D3 260 µm. The arrowheads point to periodic patches, periodic arrangements of spectrin with at least three signals (scale bar 2 µm). D1.1 shows the periodic plot of a line intensity scan along the numbered periodic patch in D1. The marked distance is 150 nm. D2.1 shows a periodic line intensity scan along the numbered periodic patch in D2. The marked distance is 200 nm. D3.1 shows the periodic plot of a line intensity scan along the numbered periodic patch in D3. The marked distance is 200 nm. The scale bar length of the enlarged images D1.1, D2.1, and D3.1 is 0.5 µm each. (E and F) Quantification of parameters for the development of MPS along the axon, starting from the growth cone base. The number of periodic patches (E) increases, then decreases beyond 200 µm. The length of periodic patches (F) increases towards soma. Data is represented as mean ± SD. Red lines indicate estimated curve fits. At least 5 biological replicates were analyzed, 10 axons were analyzed in total. Because of limitations in following axons back for extended lengths, not all axons could be included at distal points. (G) Development of the spacing of spectrin tetramers in periodic patches in 10 µm long axonal segments at a distance of 0 µm, 100 µm, and 200 µm from the growth cone in non-axotomized axons. Although a slight increase of spectrin tetramer spacing along the axon is visible, no significant changes were detected using ordinary one-way ANOVA, followed by Turkey’s multiple comparisons test. Bars represent mean ± SD, at least 5 biological replicates were analyzed, 11 axons were analyzed in total.
Figure 3
Figure 3
Phases of MPS development along the growing axon. Schematic drawing of the phases of MPS development along the growing axon, the growth cone is to the left. The dotted lines mark 10 µm intervals. βII-Spectrin molecules form periodic patches (symbolized by small green circles) close to the growth cone (assembly phase). These patches then increase in number and size (elongation phase), coalesce during maturation, and form the final MPS (coalescence phase).
Figure 4
Figure 4
Comparison of growth cone morphology and βII-spectrin periodicity of the first 10 µm of axon proximal to the growth cone in samples of non-axotomized and regenerating neurons. (A) Graphical explanation of the method used for marking regenerating axons. Microscopic images of the same section of the axonal compartment were acquired before axotomy, five minutes after, and 2–24 h after axotomy. For detailed information, see the methods section. White arrowheads indicate regenerating axons. Scale bar is 30 µm. (B) Comparison of periodicity in the first 10 µm of the axon, starting from the growth cone base. Data of different time points after axotomy and non-axotomized axons are shown. The 2 h time point shows a significant increase in periodicity. Bars represent mean ± SD. One-way ANOVA, followed by Dunnett’s multiple comparisons test, was performed. At least 8 axons were analyzed per condition, n = 3, 67 axons were analyzed in total. (C and D) Comparison of the average length and number of periodic patches in the first 10 µm of axon adjacent to the growth cone. Data of different time points after axotomy and non-axotomized axons are shown. No significant differences were detected for periodic patch length (C). The average number of periodic patches was significantly increased at the 2 h time point, compared to non-axotomized axons (D). One-way ANOVA was performed, followed by Dunnett’s multiple comparisons test. Bars represent mean ± SD. At least 8 axons were analyzed per condition, n = 3, 67 axons were analyzed in total. (E) Comparison of axonal diameter in the first 10 µm of the axon, starting from the growth cone base. Data of different time points after axotomy and non-axotomized axons are shown. The reduction of the axonal diameter of the different time points after axotomy is significant, compared to non-axotomized axons, whereas only the 2 h time point shows a significant increase in periodicity (B). Bars represent mean ± SD, one-way ANOVA, followed by Dunnett’s multiple comparisons test was performed. At least 8 axons were analyzed per condition, n = 3, 67 axons were analyzed in total. (F) Comparison of axonal outgrowth speed in cortical neurons fixed at DIV 10. The 4 h and 6 h time points showed significantly increased outgrowth speed compared to non-axotomized axons. The line represents mean, one-way ANOVA, followed by Dunnett’s multiple comparisons test was performed. At least 31 Axons were analyzed per condition, n = 3, 177 axons were analyzed in total. (G), Comparison of growth cone area of different time points after axotomy and non-axotomized axons, quantified in spectrin-stained axons. The growth cone area of regenerating axons is significantly reduced compared to non-axotomized axons. Bars represent mean ± SD; one-way ANOVA, followed by Dunnett’s multiple comparisons test, was performed. At least 8 axons were analyzed per condition, n = 3, 67 axons were analyzed in total. (H) Comparison of regenerating axons of combined time points and non-axotomized axons displaying spectrin necks. Non-axotomized axons did not display spectrin necks, whereas regenerating axons showed variating percentages of spectrin necks. A spectrin neck was defined as an at least 600 nm long increase of spectrin signal at the axonal segment directly connected to the growth cone, not longer than 3 µm. At least 8 axons were analyzed per condition, n = 3, 67 axons were analyzed in total. (I) Representative STED images of growth cone sizes at different time points after axotomy and non-axotomized. Notice the size difference between non-axotomized and regenerating axons. White arrowhead points to spectrin neck. The scale bar is 2 µm.
Figure 5
Figure 5
Effects of calpeptin treatment on spectrin periodicity and regeneration of axons after axotomy. (A) Schematic display of used test setup. 10 µM of calpeptin or equal amounts of DMSO were used for incubation. STED imaging was performed following fixation. (B) Representative STED images of cortical neurons treated with calpeptin or DMSO before axotomy, fixation after 2 h, scale bar 2 µm. The arrowhead points to a spectrin neck at the base of the growth cone. (C–E) Quantification of parameters for MPS development along the axon in regenerating axons treated with calpeptin, compared to regenerating DMSO controls. Analyzed were the first 10 µm of axon close to the growth cone. Periodicity (C) and size of periodic patches (E) were increased in calpeptin-treated axons. Bars represent mean ± SD. Unpaired t test (C and D) or Kolmogorov–Smirnov test (E) was performed. At least 7 axons were analyzed per condition, n = 3, 15 axons were analyzed in total. (F and G) Graphical display of axon length of regenerating neurons 2 h after axotomy. (F) shows no significant increase in axon length, while (G) shows a significant increase in regenerating axons per 9 microgrooves. Bars represent mean ± SD. Non-parametric Mann–Whitney U test was performed. At least 22 axons were analyzed per condition, n = 3, 52 axons were analyzed in total. (G) at least 27 microgrooves were analyzed per condition, n = 3, 198 microgrooves were analyzed in total. (H) Quantification of axons, treated with DMSO or calpeptin, displaying spectrin necks. Calpeptin-treated axons displayed a higher percentage of growth cones with spectrin necks. A spectrin neck was defined as an at least 600 nm long increase of spectrin signal at the axonal segment directly connected to the growth cone, not longer than 3 µm. At least 7 axons were analyzed per condition, n = 3, 15 axons were analyzed in total.

References

    1. Xu K, Zhong G, Zhuang X. Actin, spectrin, and associated proteins form a periodic cytoskeletal structure in axons. Science. 2013;339:452–456. - PMC - PubMed
    1. Lukinavičius G, et al. Fluorogenic probes for live-cell imaging of the cytoskeleton. Nat. Methods. 2014;11:731–733. - PubMed
    1. D’Este E, et al. Subcortical cytoskeleton periodicity throughout the nervous system. Sci. Rep. 2016;6:1–8. - PMC - PubMed
    1. He J, et al. Prevalent presence of periodic actin-spectrin-based membrane skeleton in a broad range of neuronal cell types and animal species. Proc. Natl. Acad. Sci. U. S. A. 2016;113:6029–6034. - PMC - PubMed
    1. D’Este E, Kamin D, Göttfert F, El-Hady A, Hell SW. STED Nanoscopy reveals the ubiquity of subcortical cytoskeleton periodicity in living neurons. Cell Rep. 2015;10:1246–1251. - PubMed

Publication types