. 2022 Sep;23(9):1365-1378.
doi: 10.1038/s41590-022-01289-w. Epub 2022 Aug 23.

Differences in CD80 and CD86 transendocytosis reveal CD86 as a key target for CTLA-4 immune regulation

Affiliations

Differences in CD80 and CD86 transendocytosis reveal CD86 as a key target for CTLA-4 immune regulation

Alan Kennedy et al. Nat Immunol. 2022 Sep.

Abstract

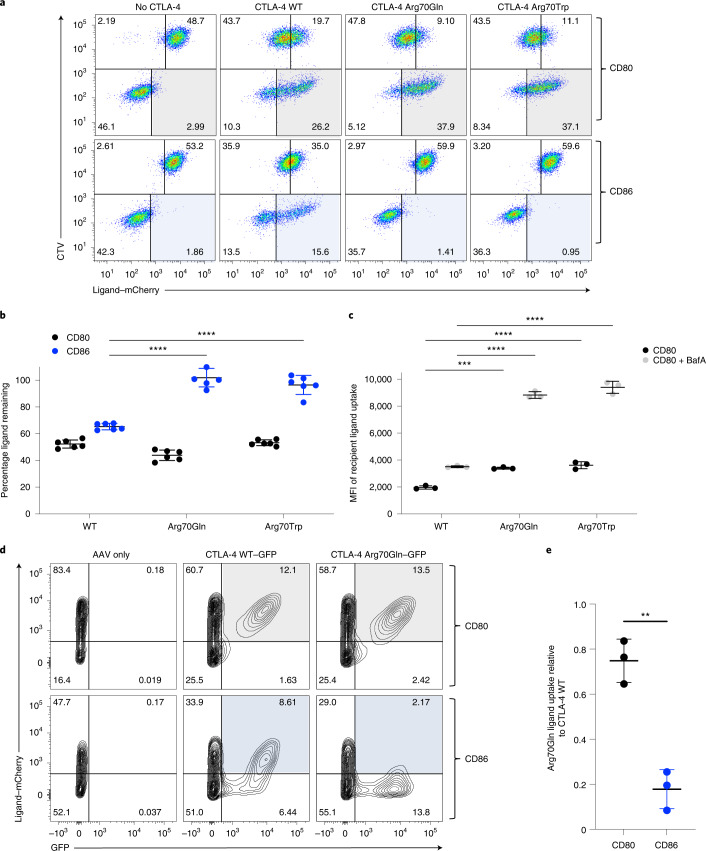
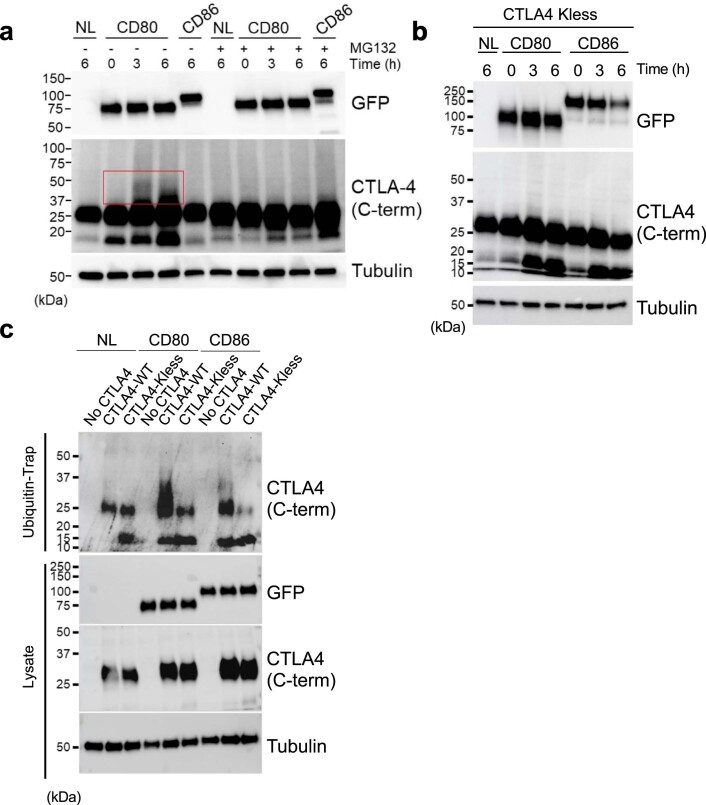
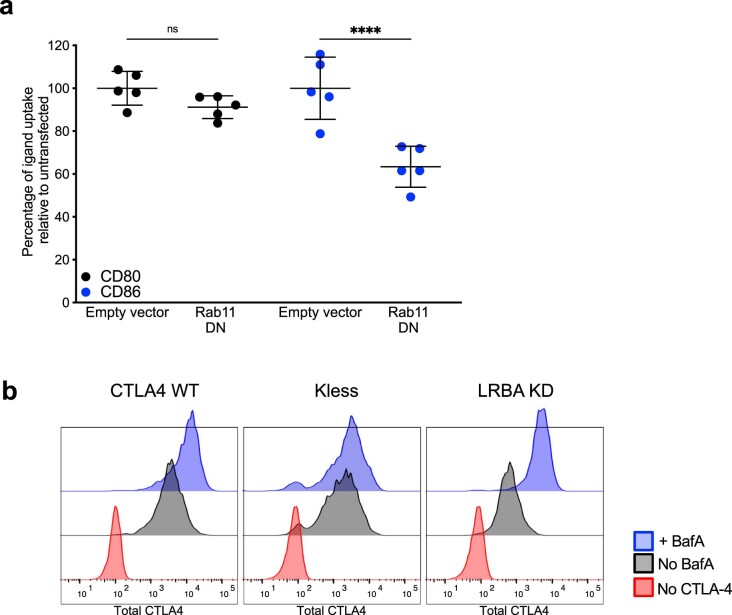
CD28 and CTLA-4 (CD152) play essential roles in regulating T cell immunity, balancing the activation and inhibition of T cell responses, respectively. Although both receptors share the same ligands, CD80 and CD86, the specific requirement for two distinct ligands remains obscure. In the present study, we demonstrate that, although CTLA-4 targets both CD80 and CD86 for destruction via transendocytosis, this process results in separate fates for CTLA-4 itself. In the presence of CD80, CTLA-4 remained ligand bound, and was ubiquitylated and trafficked via late endosomes and lysosomes. In contrast, in the presence of CD86, CTLA-4 detached in a pH-dependent manner and recycled back to the cell surface to permit further transendocytosis. Furthermore, we identified clinically relevant mutations that cause autoimmune disease, which selectively disrupted CD86 transendocytosis, by affecting either CTLA-4 recycling or CD86 binding. These observations provide a rationale for two distinct ligands and show that defects in CTLA-4-mediated transendocytosis of CD86 are associated with autoimmunity.


Conflict of interest statement

O.S.Q. is an employee of Celentix Ltd. The other authors declare no competing interests

Figures

Fig. 1
Fig. 1. TE of CD80 and CD86 reveals distinct ligand characteristics.
a, Cartoon representing TE assay. Ligand donor cells expressing CD80 or CD86 proteins with mCherry or GFP fusion tags (red plasma membrane) are labeled with CTV (CTV+) and mixed with CTLA-4-expressing (blue dots) recipient cells (CTV). During TE, plasma membrane-expressed ligands are removed from donor cells (reduced red plasma membrane signal) and the fluorescent ligand is now detected in CTLA-4-expressing recipient cells. Internalized ligands either separate from CTLA-4 (red dots) or remain co-localized (blue dots with red outline). b, Flow cytometric analysis of the TE assay described in a for CD80 and CD86 (16 h) showing loss of ligand–GFP from CTV+ donor CHO cells (cells move from the top right to the top left quadrant with ligand loss) and ligand gain by CTLA-4-expressing recipient (CTV) CHO cells (cells move from the bottom left quadrant to the bottom right). NH4Cl was added to inhibit lysosomal activity. Detection of CD80 and CD86 acquisition is highlighted in the gray- and blue-shaded quadrants, respectively. c, TE by human Treg cells showing CD80–mCherry or CD86–mCherry ligands captured from DG-75 B cells. BafA was added to inhibit lysosomal activity. Detection of CD80 and CD86 acquisition is highlighted in the gray- and blue-shaded quadrants, respectively. d, Confocal analysis of overnight TE in CHO cells showing CTLA-4 (green), co-localization of CTLA-4 and ligand (yellow) and CD80 or CD86 (red). Scale bar, 10 µm. Graphs show the percentage co-localization between CTLA-4 and ligand and the average size of co-localized vesicles. Statistical significance was determined by a Mann–Whitney, two-tailed, unpaired test: *P < 0.05, ***P < 0.001. All data are presented as mean ± s.d. and show individual data points (n = 37–40 cells from one experiment, representing three independent experiments). e, Confocal analysis of 6-h TE in Treg cells showing CTLA-4 alone (green) or co-localization (yellow) with CD80 or CD86 ligand (red) acquired from DG-75 B cells (gray). Scale bar, 5 µm. Graphs show the percentage co-localization between CTLA-4 and ligand and the average size of co-localized vesicles. Statistical significance was determined by a Mann–Whitney, two-tailed, unpaired test: ***P < 0.001, ****P < 0.0001. All data are presented as mean ± s.d. and show individual data points (n = 33 fields of view examined over three independent experiments). All confocal analysis was performed in CellProfiler. Source data
Fig. 2
Fig. 2. CD80 engagement drives CTLA-4 ubiquitylation.
a, Immunoblot analysis of TE experiments using CD80–GFP- and CD86–GFP-expressing CHO cells compared with cells with no ligand (NL). After TE for the times shown, whole-cell lysates (WCL) from combined CTLA-4 and ligand-expressing cells were directly blotted using anti-CTLA-4 (C-term) and anti-GFP (ligand) antibodies. Lysates were also blotted for tubulin as a sample-processing control. b, Quantification of anti-CTLA-4 (C-term) blots showing >25-kDa smear density relative to the 25-kDa band after CD80 or CD86 TE. The graph compares CTLA-4 WT or CTLA-4 lacking cytoplasmic lysine residues (K-less). Analysis was performed in Image Lab (BioRad) from four independent experiments. Statistical significance was calculated using two-way ANOVA with Sidak’s multiple comparison correction. All data are presented as mean ± s.d. and show individual data points. ****P < 0.0001. c, CHO TE experiments performed for 4 h and IP carried out via CD80–GFP or CD86–GFP. Precipitates from WT CTLA-4, K-less and CTLA-4 lacking a cytoplasmic domain (Δ36) were blotted for ubiquitin, CTLA-4 (C-term) and ligand (GFP). d, TE using CHO–CD80/86-CTLA-4 (WT/K-less) was carried out for the times indicated, subjected to ubiquitin IP, followed by blotting for CTLA-4 (C-term) and CD80/86 (GFP). e, CD80 and CD86 TE experiments performed with CTLA-4-expressing Jurkat T cells and DG-75 B cells expressing CD80–GFP or CD86–GFP at a 1:1 ratio. At the times indicated, ubiquitin was precipitated and then blotted for CTLA-4 and ligand–GFP. f, CD80 and CD86 TE experiments carried out using DG-75–GFP ligand-expressing cells and unmodified primary human Treg cells for 5 h followed by ubiquitin precipitation and blotting for CTLA-4 and ligand. All data represent a minimum of three similar experiments. The increased Mr of CTLA-4 is highlighted by a red box. For IPs, WCLs from all experiments were blotted for tubulin to control for protein loading. Source data
Fig. 3
Fig. 3. CD80 and CD86 direct CTLA-4 trafficking via different intracellular compartments.
a, PLAs in CHO cells showing the association between CTLA-4 and ubiquitin (red) and their co-localization (yellow) with CD80 or CD86 (green) after overnight TE with CTLA-4+ CHO cells labeled with CTFR and CD80/CD86–GFP CHO cells or CHO cells expressing NL at a 1:1 ratio in the presence of NH4Cl. Images were acquired by confocal microscopy and cells quantified for the number of PLA puncta (CTLA-4+Ubq+). The significance was calculated using the Mann–Whitney U-test: **P < 0.01 All data are presented as mean ± s.d. and show individual data points (n = 30 cells from one experiment representing three independent experiments). b, Co-localization of CTLA-4, ligand–GFP and markers of intracellular compartments in CTLA-4-expressing HeLa cells (human cells with appropriate morphology) and quantified using CellProfiler. The statistical significance was determined by two-way ANOVA with Sidak’s multiple comparison correction: *P < 0.05, **P < 0.01. All data are presented as mean ± s.d. and show individual data points (n = 8 fields of view examined over two independent experiments). c, CHO cells expressing CD80 or CD86 surface stained using CTLA-4–Ig and then washed at the pH indicated. CTLA-4–Ig remaining bound was detected by Immunoblot using anti-IgG. Lysates were immunoblotted for tubulin as a sample-processing control. Data represent four individual experiments. d, Impact of NH4Cl on CD80 and CD86 TE over time. CHO cells expressing GFP–ligands were labeled with CTV and co-incubated with CTLA-4-expressing CHO cells for 8 h (d) or the times shown (e) in the presence of 25 mM NH4Cl, and analyzed by flow cytometry. Detection of CD80 and CD86 acquisition is highlighted in the gray- and blue-shaded quadrants, respectively. All data are presented as mean ± s.d. (n = 4 independent experiments). f, Detection of available CTLA-4 in Jurkat T cells after overnight TE of DG-75 B cells expressing CD80, CD86 or without ligand (‘no TE’). Histograms show available CTLA-4 measured using anti-CTLA-4 antibody at 37 °C for 60 min and MFI of CTLA-4 staining quantified. The statistical significance was determined by two-way ANOVA with Sidak’s multiple comparison correction: ****P < 0.0001. All data are presented as mean ± s.d. and show individual data points. g, The TE experiment in f was repeated using CTLA-4+CD4+CD25+ human Treg cells. The statistical significance was determined by two-way ANOVA with Sidak’s multiple comparison correction: ****P < 0.0001. All data are presented as mean ± s.d. and show individual data points from four independent experiments. Source data
Fig. 4
Fig. 4. Altering CTLA-4 recycling affects TE of CD86 but not CD80.
a, TE assays carried out for 16 h using Jurkat T cells at a ratio of three donors (DG-75 mCherry ligand):one recipient to provide excess ligand. Recipient Jurkat T cells either lacked CTLA-4 (‘no CTLA-4’) or expressed CTLA-4 WT or CTLA-4 K-less variants. CTLA-4 WT was also expressed in Jurkat cells lacking LRBA after CRISPR–Cas9 targeting (LRBA KD). Representative FACS plots are shown in a and quantified in b for the amount of ligand acquired by the CTLA-4-expressing cell (shaded quadrant: gray CD80 and blue CD86). The far right-hand graph shows the uptake of CD86 relative to CD80 for each condition. The statistical significance was determined by the paired Student’s t-test: **P < 0.01. All data are presented as mean ± s.d. and show individual data points from three independent experiments. c, Kinetic analysis of the TE assay used in b. All data are presented as mean ± s.d. from four independent experiments. d, The impact of the K-less mutation on TE by human T cells. K-less or WT CTLA-4 was knocked into the endogenous CTLA-4 locus by homology-directed repair (HDR) using a CRISPR–Cas9/AAV6 system. Knock-in cells were detected using a GFP reporter. GFP+ T cells expressing WT or K-less cDNA, were analyzed for their ability to capture CD80–mCherry (gray quadrants) or CD86–mCherry (blue quadrants) from DG-75 B cells. The statistical significance was calculated using two-way ANOVA with Sidak’s multiple comparison correction: **P < 0.01. All data are presented as mean ± s.d. and show individual data points from three biologically independent samples. Source data
Fig. 5
Fig. 5. CTLA-4 Arg70 mutations allow binding to CD80 but not CD86.
a, Patient-identified CTLA-4 mutations resulting in ligand-facing amino acid changes (red) mapped to CTLA-4 (ribbon structure) and the location of bound CD80 (blue space-filling structure). The right-hand structure shows a view after 90° rotation. b, FACS analysis of CD80–Ig binding and CD86–Ig binding to CTLA-4 WT or mutant proteins (Arg70Gln, Arg70Trp, Cys85Tyr, Ala86Val and Pro137Arg) expressed in CHO cells. Binding of Ig fusions to CTLA-4 (x axis) at 37 °C for 1 h is plotted against a co-stain for total CTLA-4 (y axis) using a cytoplasmic (C-term) domain antibody (C-19). Staining of CTLA-4 control cells is shown in the red contours. c, Mutant CTLA-4 Ig proteins (Arg70Gln, Arg70Trp) or CTLA-4 WT Ig was used to stain CD80–GFP- and CD86–GFP-expressing CHO cells. Red contours show anti-Ig control staining in the absence of CTLA-4 Ig. d, Calculated monomeric affinity of the CD80–CTLA-4–Arg70Gln interaction, based on binding of soluble monomeric CD80 to immobilized Arg70Gln–Ig on the sensor. e, Calculated monomeric affinity of the CD86–CTLA-4–Arg70Gln interaction, based on binding of soluble monomeric CD86 to immobilized Arg70Gln–Ig on the sensor.
Fig. 6
Fig. 6. CTLA-4 Arg70 mutants are defective in CD86 TE.
a, CTLA-4 WT or mutant proteins (Arg70Gln and Arg70Trp) expressed in Jurkat T cells tested for TE of CD80–mCherry and CD86–mCherry from ligand-expressing DG-75 B cells. CTV-labeled, ligand-expressing cells were incubated with CTLA-4-expressing cells (CTV) and assessed for TE overnight. Detection of CD80 and CD86 acquisition is highlighted in the gray- and blue-shaded quadrants, respectively. b, Quantification of ligand remaining on the donor cell relative to no CTLA-4 controls. c, The amount of CD80–mCherry ligand detected inside CTLA-4+ recipient cells shown for the CTLA-4 mutants. BafA was added to evaluate the impact of lysosome blockade. d, The impact of Arg70Gln mutation on TE by human Treg cells. Arg70Gln or WT CTLA-4 was knocked into the endogenous CTLA-4 locus by HDR using a CRISPR–Cas9/AAV6 system. Knock-in cells were detected using a GFP reporter. GFP+ Treg cells expressing Arg70Gln mutant cDNA were compared with endogenous CTLA-4 (GFP) or GFP+-expressing Treg cells containing WT cDNA for their ability to capture CD80 (gray quadrant) or CD86 (blue quadrant) from DG-75 B cells. e, Quantification of the experiment shown in d, using data from three independent samples. The statistical significance was determined by two-way ANOVA with Sidak’s multiple comparison correction (b and c) or two-tailed, unpaired Student’s t-test (e): **P < 0.01, ***P < 0.001, ****P < 0.0001. All data are presented as mean ± s.d. from three independent experiments (b and c) or three biologically independent samples (e). Source data
Fig. 7
Fig. 7. CTLA-4 Arg70Gln is unable to regulate a CD86-driven T cell response.
a,b, CTFR-labeled CD86-expressing (a) or CD80-expressing (b) DG-75 B cells exposed to Jurkat T cells expressing no CTLA-4, CTLA-4 Arg70Gln or CTLA-4 WT overnight in a TE assay. TE of GFP–ligand is shown in the left-hand column. After TE, B cells were then used to co-stimulate T cell proliferation of CTV-labeled human CD4+CD25 T cells (representative histograms). T cell receptor stimulation was provided by soluble anti-CD3 antibody and proliferative responses measured by flow cytometry at day 5 for CTV dilution. c, Quantification of the experiment shown in a and b, using data from six individual donors, showing the percentage of T cells in the initial culture that entered cell division. The statistical significance was determined by two-way ANOVA with Sidak’s multiple comparison correction: ***P < 0.001, ****P < 0.0001 All data are presented as mean ± s.d. and show individual data points from six biologically independent samples. Source data
Extended Data Fig. 1
Extended Data Fig. 1. Kinetic analysis of transendocytosis by flow cytometry.
Transendocytosis assays were performed with CTLA-4-CHO: ligand CHO cells (a) or CTLA-4-Jurkat: ligand DG75 B cells (b) for the times indicated. Representative FACS plots at time points indicated on the left, with full kinetic analysis of both ligand downregulation on donor cells and uptake by CTLA-4 recipient cells quantified on the right. c). Example of transendocytosis using Jurkat cells without CTLA-4 (no CTLA-4) or expressing (CTLA-4) capturing ligand from CD80 or CD86-expressing DG75 B cells showing the impact of Bafilomycin A (+ BafA) treatment on detection of ligand in CTLA-4 expressing recipient cells. Detection of CD80 and CD86 acquisition is highlighted in the grey and blue shaded quadrants, respectively. Statistical significance was determined by paired t test, **P < 0.01. All data are presented as mean ± s.d. and show individual data points from 3 independent experiments. Source data
Extended Data Fig. 2
Extended Data Fig. 2. Impact of MG132 treatment and Kless mutation on CTLA-4 ubiquitylation.
a). Transendocytosis was carried out using CD80-GFP or CD86-GFP expressing CHO cells or CHO cells with no ligand (NL) for the times shown and whole cell lysates were blotted for GFP (ligand), CTLA4 (C-term), with membranes stripped and reprobed for tubulin. CTLA-4 increases in Mw are highlighted (red box). b). CTLA-4 lacking cytoplasmic lysine residues (CTLA-4 Kless) was used in transendocytosis assays with CHO cells expressing CD80, CD86 or CHO cells with no ligand (NL) for times indicated and whole cell lysates blotted for GFP (ligand), and CTLA-4. Lysates were blotted for tubulin as a sample processing control. c). The impact of Kless mutation on ubiquitylation of CTLA-4 expressed in Jurkat T cells. Transendocytosis of DG75 B cells expressing CD80-GFP or CD86-GFP was carried out for 6 hours, followed by lysis and immunoprecipitation of total ubiquitin (ubiquitin trap). Blots were then probed for CTLA-4 expression using anti-CTLA4 antibody (C-term) and GFP (ligand). Whole cell lysates (WCL) were also blotted using anti-CTLA4, and tubulin to control for protein loading. All data is representative of at least 3 independent experiments. Source data
Extended Data Fig. 3
Extended Data Fig. 3. Colocalization of CTLA-4, ligand and markers of intracellular trafficking.
Confocal analysis of overnight transendocytosis between CHO CD80GFP (left-hand panels) or CD86GFP (right-hand panels) and HeLa cells expressing CTLA-4. Following transendocytosis cells were fixed and stained for CTLA-4 (red), ligand (green) and components of the endosomal/lysosomal pathway (Rab5, Rab7, Lamp3 and LRBA) as indicated (cyan). Arrowheads indicate location of triple colocalization of ligand, CTLA-4 and indicated cellular component. Arrows are illustrative and do not show all colocalization events, which were determined automatically using Cell Profiler software and are quantified in Figure 3b.
Extended Data Fig. 4
Extended Data Fig. 4. Inhibiting recycling using dominant negative Rab11 impairs CD86 transendocytosis.
a). CTLA-4+ HeLa cells were transiently transfected with dominant negative (DN) Rab11-GTPase or empty vector backbone and the impact on transendocytosis assessed using CHO mCherry-ligand uptake at 20h assessed by flow cytometry. Statistical significance was determined by 2-way ANOVA with Sidak’s multiple comparison correction, ****P < 0.0001. All data are presented as mean ± s.d. and show individual data points from 5 independent experiments. b). Impact of Kless and LRBA on CTLA-4 degradation. Comparison of CTLA-4 sensitivity to BafA in WT, Kless and LRBA knockout Jurkat T cells. CTLA-4 degradation in the steady state was estimated by the impact of treatment with BafA on the staining for total CTLA-4 expression. Source data
Extended Data Fig. 5
Extended Data Fig. 5. Enhanced recycling and insensitivity to degradation in CTLA-4 Kless cells.
a). CHO cells expressing WT or CTLA-4 lacking cytoplasmic lysine residues (Kless) were stained for CTLA-4 recycling using anti-CTLA-4 antibodies at 37 °C and detected by flow cytometry. The percentage of CTLA-4 recycled is shown in the presence and absence of MG132 to assess the impact of ubiquitylation. b). Flow cytometry analysis of WT and Kless cells stained for CTLA-4 at 4°C (to stain cell surface), 37 °C (to stain cycling) and following fixation and permeabilisation (to stain total) in the presence or absence of MG132. c). Impact of Kless mutation knocked in to the CTLA-4 locus in activated human CD4+ T cells using CRISPR-Cas9/AAV6 HDR. Cycling CTLA-4 was detected using anti-CTLA-4 antibody at 37°C for 1h in cells receiving either a WT or Kless CTLA-4 repair template (histograms). The amount of cycling CTLA-4 was compared between edited (GFP+) and non-edited (GFP) cells in the same culture. Data shown is collated from 3 biologically independent samples. Statistical significance was determined by 2-way ANOVA with Sidak’s multiple comparison correction, ****P < 0.0001. All data are presented as mean ± s.d. and show individual data points from 3 biologically independent samples.
Extended Data Fig. 6
Extended Data Fig. 6. R70 mutations in CTLA-4 cause CD80 to behave more like CD86.
a). Confocal microscopy of CD80-GFP (green) with CTLA-4 WT, R70Q or R70W (red) following overnight transendocytosis in CHO cells. Scale bar, 10 µm. b). Quantification of the experiment shown in a, showing the percentage of colocalization between CTLA-4 and CD80. Data shown is collated from a minimum of 4 images per condition. Statistical significance was determined by 2-way ANOVA with Sidak’s multiple comparison correction, **P < 0.01, ****P < 0.0001. All data are presented as mean ± s.d. and show individual data points. n= 20-33 cells from 1 experiment, representative of 2 independent experiments c). Following transendocytosis by Jurkat T cells expressing CTLA-4 WT or R70 mutants, CD80 was immunoprecipitated via its GFP tag and blotted for the presence of co-precipitated CTLA-4. Data are representative of two similar experiments. d). pH sensitivity of R70Q-Ig binding to CD80 expressing CHO cells. CHO cells expressing CD80 or CD86 were surface stained using CTLA-4 WT-Ig (Abatacept), or CTLA-4 R70Q-Ig and then washed at the pH shown. Cells were lysed and bound CTLA-4 was detected by Immunoblotting using anti-Human-Fc (anti-human-HRP) and anti-N terminal CTLA-4 (EPR1476). Data are representative of two similar experiments. Tubulin was used as a loading control in c and d. Source data
Extended Data Fig. 7
Extended Data Fig. 7. Proposed model of impact of CD80 and CD86 on CTLA-4 transendocytosis.
a). CD80 forms a high avidity dimer-dimer lattice with CTLA-4, resulting in stable binding and increased CTLA-4 ubiquitylation. Ubiquitylation deviates CTLA-4 away from recycling by targeting of the CD80 and CTLA-4 complex to late endosomes/lysosomes marked by Rab7 and LAMP3. b). Interaction of low affinity monomeric CD86 does not modify CTLA-4 with ubiquitin and results in pH-dependent separation of CTLA-4 and CD86. Unmodified CTLA-4 recycles back to the cell surface in an LRBA and Rab11-dependent manner. After detaching from CTLA-4, CD86 is rapidly degraded.

Comment in

  • Two CTLA-4 ligands, separate pHates.
    Humphries PA, Lo WL. Humphries PA, et al. Nat Immunol. 2022 Sep;23(9):1297-1299. doi: 10.1038/s41590-022-01296-x. Nat Immunol. 2022. PMID: 35999395 No abstract available.

References

    1. Esensten JH, Helou YA, Chopra G, Weiss A, Bluestone JA. CD28 costimulation: from mechanism to therapy. Immunity. 2016;44:973–988. doi: 10.1016/j.immuni.2016.04.020. - DOI - PMC - PubMed
    1. Salomon B, et al. B7/CD28 costimulation is essential for the homeostasis of the CD4+CD25+ immunoregulatory T cells that control autoimmune diabetes. Immunity. 2000;12:431–440. doi: 10.1016/S1074-7613(00)80195-8. - DOI - PubMed
    1. Shahinian A, et al. Differential T cell costimulatory requirements in CD28 deficient mice. Science. 1993;261:609–612. doi: 10.1126/science.7688139. - DOI - PubMed
    1. Zhang R, et al. An obligate cell-intrinsic function for CD28 in Tregs. J. Clin. Investig. 2013;123:580–593. - PMC - PubMed
    1. Linterman MA, et al. CD28 expression is required after T cell priming for helper T cell responses and protective immunity to infection. eLife. 2014;3:e03180. doi: 10.7554/eLife.03180. - DOI - PMC - PubMed

Publication types