

COVID-19 trends, public restrictions policies and vaccination status by economic ranking of countries: a longitudinal study from 110 countries
- PMID: 35999620
- PMCID: PMC9398898
- DOI: 10.1186/s13690-022-00936-w
COVID-19 trends, public restrictions policies and vaccination status by economic ranking of countries: a longitudinal study from 110 countries
Abstract
Background: The coronavirus disease 2019 (COVID-19) pandemic has transitioned to a third phase and many variants have been originated. There has been millions of lives loss as well as billions in economic loss. The morbidity and mortality for COVID-19 varies by country. There were different preventive approaches and public restrictions policies have been applied to control the COVID-19 impacts and usually measured by Stringency Index. This study aimed to explore the COVID-19 trend, public restriction policies and vaccination status with economic ranking of countries.
Methods: We received open access data from Our World in Data. Data from 210 countries were available. Countries (n = 110) data related to testing, which is a key variable in the present study, were included for the analysis and remaining 100 countries were excluded due to incomplete data. The analysis period was set between January 22, 2020 (when COVID-19 was first officially reported) and December 28, 2021. All analyses were stratified by year and the World Bank income group. To analyze the associations among the major variables, we used a longitudinal fixed-effects model.
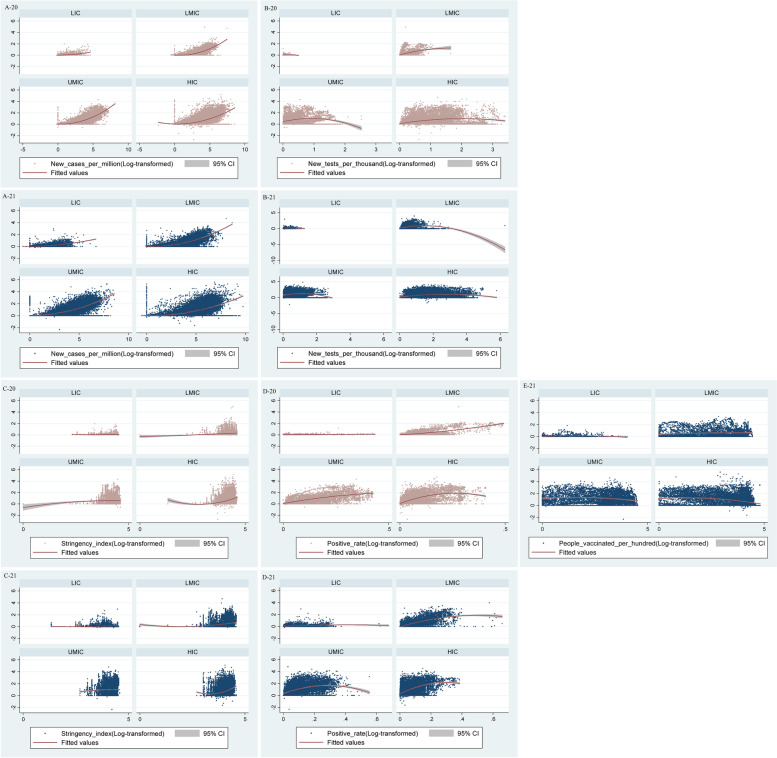
Results: Out of the 110 countries included in our analysis, there were 9 (8.18%), 25 (22.72%), 31 (28.18%), and 45 (40.90%) countries from low income countries (LIC), low and middle income countries (LMIC), upper middle income countries (UMIC) and high income countries (HIC) respectively. New case per million was similar in LMIC, UMIC and HIC but lower in LIC. The number of new COVID-19 test were reduced in HIC and LMIC but similar in UMIC and LIC. Stringency Index was negligible in LIC and similar in LMIC, UMIC and HIC. New positivity rate increased in LMIC and UMIC. The daily incidence rate was positively correlated with the daily mortality rate in both 2020 and 2021. In 2020, Stringency Index was positive in LIC and HIC but a negative association in LMIC and in 2021 there was a positive association between UMIC and HIC. Vaccination coverage did not appear to change with mortality in 2021.
Conclusion: New COVID-19 cases, tests, vaccinations, positivity rates, and Stringency indices were low in LIC and highest in UMIC. Our findings suggest that the available resources of COVID-19 pandemic would be allocated by need of countries; LIC and UMIC.
Keywords: COVID-19; Mortality; Reproductive ratio; SARS-CoV-2; Stringency index, Vaccine.
© 2022. The Author(s).
Conflict of interest statement
We declare that there is no conflict of interest.
Figures
References
-
- Mortality Risk of COVID-19 - Statistics and Research - Our World in Data [https://ourworldindata.org/mortality-risk-covid]. Accessed 3 Jan 2022.
-
- WHO Coronavirus Disease (COVID-19) Dashboard [https://covid19.who.int/]. Accessed 5 May 2022.
-
- MORTALITY ANALYSES [https://coronavirus.jhu.edu/data/mortality]. Accessed 5 May 2022.
LinkOut - more resources
Full Text Sources
Miscellaneous
