. 2022 Nov 3;21(11):1674-1688.
doi: 10.1158/1535-7163.MCT-22-0207.

Establishment and Evaluation of Dual HDAC/BET Inhibitors as Therapeutic Options for Germ Cell Tumors and Other Urological Malignancies

Affiliations

Establishment and Evaluation of Dual HDAC/BET Inhibitors as Therapeutic Options for Germ Cell Tumors and Other Urological Malignancies

Aaron Burmeister et al. Mol Cancer Ther. .

Abstract

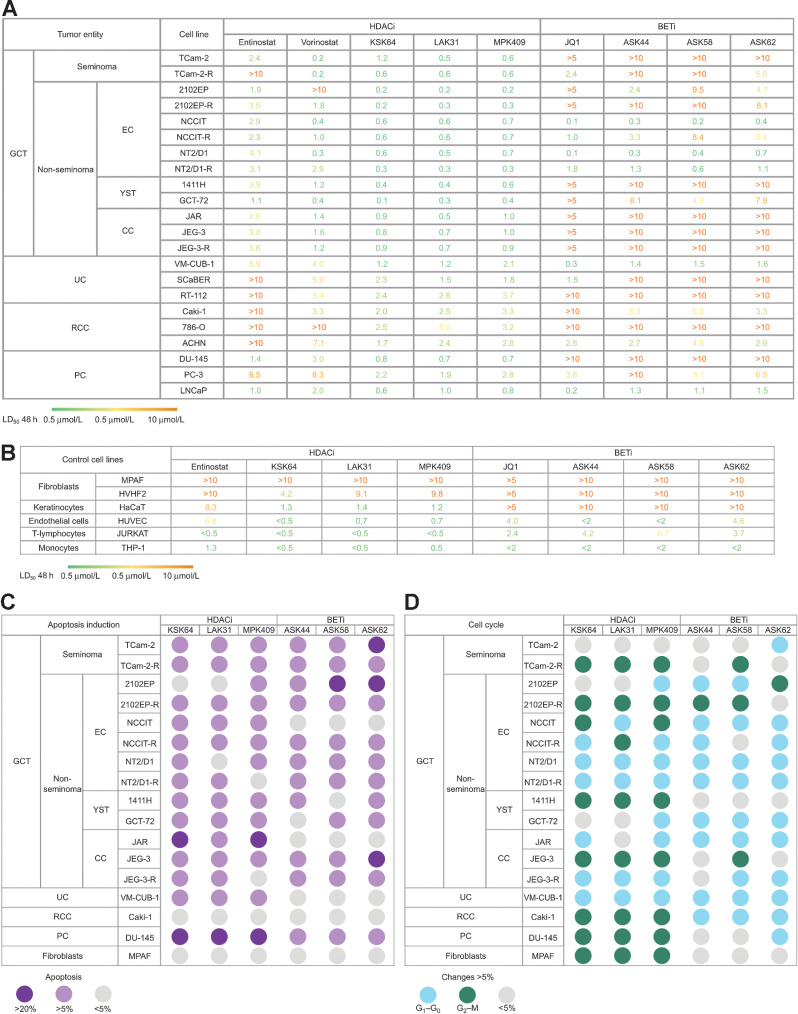
Urological malignancies represent major challenges for clinicians, with annually rising incidences. In addition, cisplatin treatment induced long-term toxicities and the development of therapy resistance emphasize the need for novel therapeutics. In this study, we analyzed the effects of novel histone deacetylase (HDAC) and bromodomain and extraterminal domain-containing (BET) inhibitors to combine them into a potent HDAC-BET-fusion molecule and to understand their molecular mode-of-action. Treatment of (cisplatin-resistant) germ cell tumors (GCT), urothelial, renal, and prostate carcinoma cells with the HDAC, BET, and dual inhibitors decreased cell viability, induced apoptosis, and affected the cell cycle. Furthermore, a dual inhibitor considerably decreased tumor burden in GCT xenograft models. On a molecular level, correlating RNA- to ATAC-sequencing data indicated a considerable induction of gene expression, accompanied by site-specific changes of chromatin accessibility after HDAC inhibitor application. Upregulated genes could be linked to intra- and extra-cellular trafficking, cellular organization, and neuronal processes, including neuroendocrine differentiation. Regarding chromatin accessibility on a global level, an equal distribution of active or repressed DNA accessibility has been detected after HDAC inhibitor treatment, questioning the current understanding of HDAC inhibitor function. In summary, our HDAC, BET, and dual inhibitors represent a new treatment alternative for urological malignancies. Furthermore, we shed light on new molecular and epigenetic mechanisms of the tested epi-drugs, allowing for a better understanding of the underlying modes-of-action and risk assessment for the patient.


Figures

Figure 1. Screening for cytotoxicity of the novel HDAC and BET inhibitors in urological malignancies. A and B, Illustration of the micromolar EC50 values acquired by XTT cell viability assays 48 hours after treatment of urological malignancies (A) or healthy untransformed cells (B) with HDACi and BETi. The HDACi Entinostat and Vorinostat were compared with the three novel HDACi inhibitors KSK64, LAK31, and MPK409, whereas JQ1 was compared with the novel BETi ASK44, ASK58, and ASK62. A red color code indicates high EC50 values (>5 μmol/L), whereas green tiles represent a low EC50 (<2 μmol/L). The inhibitors were analyzed in cell lines of all four tumor entities (UC, RCC, prostate cancer, and GCT). For GCTs cisplatin-resistant cell lines (-R) were also included. C and D, Color-coded flow cytometry-based analysis of (C) apoptosis induction and (D) cell-cycle phase distribution 24 hours after EC50 treatment of HDACi/BETi in cell lines of all four tumor entities (UC, RCC, PC, and GCT) in comparison with a DMSO solvent control.
Figure 1.
Screening for cytotoxicity of the novel HDAC and BET inhibitors in urological malignancies. Illustration of the micromolar EC50 values acquired by XTT cell viability assays 48 hours after treatment of urological malignancies (A) or healthy untransformed cells (B) with HDACi and BETi. The HDACi Entinostat and Vorinostat were compared with the three novel HDACi inhibitors KSK64, LAK31, and MPK409, whereas JQ1 was compared with the novel BETi ASK44, ASK58, and ASK62. A red color code indicates high EC50 values (> 5 μmol/L), whereas green tiles represent a low EC50 (< 2 μmol/L). The inhibitors were analyzed in cell lines of all four tumor entities (UC, RCC, PC, and GCT). For GCTs cisplatin-resistant cell lines (-R) were also included. Color-coded flow cytometry-based analysis of apoptosis induction (C) and cell-cycle phase distribution (D) 24 hours after EC50 treatment of HDACi/BETi in cell lines of all four tumor entities (UC, RCC, PC, and GCT) in comparison with a DMSO solvent control.
Figure 2. Analysis of global changes of chromatin accessibility after LAK31 treatment in four different urological tumor entities. A, A PCA of LAK31-induced changes (triangles) in chromatin accessibility in cell lines of all four tumor entities in comparison with DMSO solvent control (spheres). B, A bar plot illustrated the number of opened (green) and closed (red) chromatin regions after LAK31 treatment in 2102EP, VM-CUB-1, Caki-1, and DU-145 in comparison with DMSO solvent control. C, A PCA of HDACi-induced changes (triangles; Romidepsin, Quisinostat, MZ-1) in chromatin accessibility in 2102EP cells in comparison with DMSO solvent control (sphere). D, A bar plot illustrating the number of opened (green) and closed (red) chromatin regions after Romidepsin, Quisinostat, or MZ-1 treatment in 2102EP cells in comparison with DMSO solvent control. E, A HOMER algorithm-based screening for transcription factor–binding motifs in DNA rendered accessible or inaccessible after HDACi treatment of 2102EP cells. Venn diagrams summarize similarities in the identified TOP50 motifs. Bar diagrams highlight the TOP10-binding motifs (sorted by p-value in LAK31-treated 2102EP cells) and their distribution in target sequences affected by HDACi treatment.
Figure 2.
Analysis of global changes of chromatin accessibility after LAK31 treatment in four different urological tumor entities. A, A PCA of LAK31-induced changes (triangles) in chromatin accessibility in cell lines of all four tumor entities in comparison with DMSO solvent control (spheres). B, A bar plot illustrating the number of opened (green) and closed (red) chromatin regions after LAK31 treatment in 2102EP, VM-CUB-1, Caki-1, and DU-145 in comparison with DMSO solvent control. C, A PCA of HDACi-induced changes (triangles; romidepsin, quisinostat, MZ-1) in chromatin accessibility in 2102EP cells in comparison with DMSO solvent control (sphere). D, A bar plot illustrating the number of opened (green) and closed (red) chromatin regions after Romidepsin, Quisinostat, or MZ-1 treatment in 2102EP cells in comparison with DMSO solvent control. E, A HOMER algorithm-based screening for transcription factor–binding motifs in DNA rendered accessible or inaccessible after HDACi treatment of 2102EP cells. Venn diagrams summarize similarities in the identified TOP50 motifs. Bar diagrams highlight the TOP10-binding motifs (sorted by P value in LAK31 treated 2102EP cells) and their distribution in target sequences affected by HDACi treatment.
Figure 3. Deciphering of the molecular processes induced by HDACi LAK31 in urological malignancies. A, Volcano plots of transcriptional changes upon LAK31 treatment in comparison with the DMSO solvent control in 2102EP, VM-CUB-1, Caki-1, and DU-145, acquired by RNA-seq (FC - log2 2 is shown in red; FC log2 2 is shown in green). The number of up-/downregulated genes is given in each plot. B, A PCA illustrating the changes in transcription upon LAK31 treatment in comparison with the DMSO control. C, DAVID analysis and Venn diagrams for commonly up- and downregulated genes of cell lines all four tumor entities (2102EP, VM-CUB-1, Caki-1, and DU-145) after LAK31 treatment. 190 genes were commonly upregulated (log2 FC > 2), whereas 6 were commonly downregulated (FC - log2 2). D, STRING interaction analysis of commonly upregulated genes in 2102EP, VM-CUB-1, Caki-1, and DU-145 upon LAK31 treatment compared with the solvent control. E, qRT-PCR validation gene expression panel of the three most potent novel HDACi (KSK64, LAK31, and MPK409) in GCT cell lines TCam-2 (blue), 2102EP (red), GCT-72 (gray), and JAR (yellow). F, qRT-PCR analysis of a gene expression panel of key players of BETi in GCT cell lines treated with the three most potent novel BETi (ASK44, ASK58, and ASK62).
Figure 3.
Deciphering of the molecular processes induced by HDACi LAK31 in urological malignancies. A, Volcano plots of transcriptional changes upon LAK31 treatment in comparison with the DMSO solvent control in 2102EP, VM-CUB-1, Caki-1, and DU-145, acquired by RNA-seq (FC < −log2 2 is shown in red; FC > log2 2 is shown in green). The number of up- /downregulated genes is given in each plot. B, A PCA illustrating the changes in transcription upon LAK31 treatment in comparison with the DMSO control. C, DAVID analysis and Venn diagrams for commonly up- and downregulated genes of cell lines of all four tumor entities (2102EP, VM-CUB-1, Caki-1, and DU-145) after LAK31 treatment. 190 genes were commonly upregulated (FC > log2 2), whereas 6 were commonly downregulated (FC < −log2 2). D, STRING interaction analysis of commonly upregulated genes in 2102EP, VM-CUB-1, Caki-1, and DU-145 upon LAK31 treatment compared with the solvent control. E, qRT-PCR validation gene expression panel of the three most potent novel HDACi (KSK64, LAK31, and MPK409) in GCT cell lines TCam-2 (blue), 2102EP (red), GCT-72 (gray), and JAR (yellow). F, qRT-PCR analysis of a gene expression panel of key players of BETi in GCT cell lines treated with the three most potent novel BETi (ASK44, ASK58, and ASK62).
Figure 4. Characterization of novel HDAC-BET-dual inhibitors. A, Structures of the three novel HDAC-BET-dual inhibitors (LAK-FFK11, LAK129, and LAK-HGK7). B, Illustrations of the micromolar EC50 values 48 hours after treatment with HDAC-BET-dual inhibitors as acquired by XTT cell viability assays. A red color code indicates high EC50 values (>5 μmol/L), whereas green tiles represent a low EC50 (<2 μmol/L). The inhibitors were analyzed in cell lines of all four tumor entities (UC, RCC, PC, and GCT) and six healthy control cell lines. For GCTs cisplatin-resistant cell lines (-R) were also included. C, Color-coded flow cytometry-based analysis of apoptosis rates 24 hours after EC50 application of dual inhibitors in cell lines of all four tumor entities (UC, RCC, PC, and GCT) in comparison with the DMSO solvent control and (D) upon co-treatment with the caspase-inhibitor Z-VAD-FMK. E, Color-coded flow cytometry-based analysis of cell-cycle phase distribution 24 hours after EC50 application of dual inhibitors in cell lines of all four tumor entities (UC, RCC, PC, and GCT) in comparison with the DMSO solvent control. F, A qRT-PCR analysis of expression of key players of HDACi and BETi.
Figure 4.
Characterization of novel HDAC-BET-dual inhibitors. A, Structures of the three novel HDAC-BET-dual inhibitors (LAK-FFK11, LAK129, and LAK-HGK7). B, Illustrations of the micromolar EC50 values 48 hours after treatment with HDAC-BET-dual inhibitors as acquired by XTT cell viability assays. A red color code indicates high EC50 values (> 5 μmol/L), whereas green tiles represent a low EC50 (< 2 μmol/L). The inhibitors were analyzed in cell lines of all four tumor entities (UC, RCC, PC, and GCT) and six healthy control cell lines. For GCTs cisplatin-resistant cell lines (-R) were also included. C, Color-coded flow cytometry-based analysis of apoptosis rates 24 hours after EC50 application of dual inhibitors in cell lines of all four tumor entities (UC, RCC, PC, and GCT) in comparison with the DMSO solvent control and (D) upon co-treatment with the caspase-inhibitor Z-VAD-FMK. E, Color-coded flow cytometry-based analysis of cell cycle phase distribution 24 hours after EC50 application of dual inhibitors in cell lines of all four tumor entities (UC, RCC, PC, and GCT) in comparison with the DMSO solvent control. F, A qRT-PCR analysis of expression of key players of HDACi and BETi.
Figure 5. Treatment effects of dual inhibitor (LAK-FFK11) in vitro. A, A PCA illustrating changes in chromatin accessibility upon treatment with LAK31, Romidepsin, Quisinostat, and LAK-FFK11 in comparison to the DMSO control as measured by ATAC-seq. B, A bar plot illustrating the number of opened (green) and closed (red) chromatin regions after treatment with the dual inhibitor LAK-FFK11 in 2102EP cells in comparison with DMSO solvent control. C, A HOMER algorithm-based screening for transcription factor–binding motifs in DNA rendered accessible or inaccessible after HDACi treatment of 2102EP cells. Venn diagrams summarize similarities in the identified TOP50 motifs. Bar diagrams highlight the TOP10 binding motifs (sorted by P value in LAK-FFK11–treated 2102EP cells) and their distribution in target sequences affected by HDACi treatment. Motifs identified in both, LAK-FFK11 and the other HDACi are labeled in green. D, A Volcano plot of transcriptional changes upon LAK-FFK11 treatment in comparison with the DMSO solvent control in 2102EP cells as measured by RNA-seq (FDR-corrected P < 0.05, FC - log2 4 is shown in red; FC log2 4 is shown in green). DAVID (E) and STRING (F) interaction analysis for commonly up- and downregulated genes of 2102EP cells treated with LAK-FFK11 (high stringency).
Figure 5.
Treatment effects of dual inhibitor (LAK-FFK11) in vitro. A, A PCA illustrating changes in chromatin accessibility upon treatment with LAK31, romidepsin, quisinostat, and LAK-FFK11 in comparison to the DMSO control as measured by ATAC-seq. B, A bar plot illustrating the number of opened (green) and closed (red) chromatin regions after treatment with the dual inhibitor LAK-FFK11 in 2102EP cells in comparison with DMSO solvent control. C, A HOMER algorithm-based screening for transcription factor–binding motifs in DNA rendered accessible or inaccessible after HDACi treatment of 2102EP cells. Venn diagrams summarize similarities in the identified TOP50 motifs. Bar diagrams highlight the TOP10 binding motifs (sorted by P value in LAK-FFK11–treated 2102EP cells) and their distribution in target sequences affected by HDACi treatment. Motifs identified in both, LAK-FFK11, and the other HDACi are labeled in green. D, A Volcano plot of transcriptional changes upon LAK-FFK11 treatment in comparison with the DMSO solvent control in 2102EP cells as measured by RNA-seq (FDR-corrected P < 0.05, FC < −log2 2 is shown in red; FC > log2 2 is shown in green). DAVID (E) and STRING (F) interaction analysis for commonly up- and downregulated genes of 2102EP cells treated with LAK-FFK11 (high stringency).
Figure 6. Treatment effects of dual inhibitor (LAK-FFK11) on xenotransplanted 2102EP(-R). Macroscopic appearance of DMSO and LAK-FFK11 treated 2102EP (A) and 2102EP-R (B) xenografted tumors. In vivo results of tumor growth inhibition by LAK-FFK11 in xenografted C) 2102EP and D) 2102EP-R cells. The relative tumor volume is displayed over a period of 3 weeks. Treatment and measurements were performed every two days. Weight of mice has been examined in xenografted (E) 2102EP and (F) 2102EP-R cells treated with either LAK-FFK11 or solvent control. Hematoxylin–eosin (H&E) staining of DMSO and LAK-FFK11 treated (G) 2102EP and (H) 2102EP-R xenografted tumors. I, Graphical summary the key findings of this study and (J) molecular effects of HDACi/dual inhibition.
Figure 6.
Treatment effects of dual inhibitor (LAK-FFK11) on xenotransplanted 2102EP(-R). Macroscopic appearance of DMSO and LAK-FFK11 treated 2102EP (A) and 2102EP-R (B) xenografted tumors. In vivo results of tumor growth inhibition by LAK-FFK11 in xenografted 2102EP (C) and 2102EP-R (D) cells. The relative tumor volume is displayed over a period of 3 weeks. Treatment and measurements were performed every 2 days. Weight of mice has been examined in xenografted 2102EP (E) and 2102EP-R (F) cells treated with either LAK-FFK11 or solvent control. Hematoxylin–eosin (H&E) staining of DMSO and LAK-FFK11 treated 2102EP (G) and 2102EP-R (H) xenografted tumors. Graphical summary the key findings of this study (I) and molecular effects of HDACi/dual inhibition (J).

References

    1. Sung H, Ferlay J, Siegel RL, Laversanne M, Soerjomataram I, Jemal A, et al. Global cancer statistics 2020: GLOBOCAN estimates of incidence and mortality worldwide for 36 cancers in 185 countries. CA Cancer J Clin 2021;71:209–49. - PubMed
    1. Park JS, Kim J, Elghiaty A, Ham WS. Recent global trends in testicular cancer incidence and mortality. Medicine 2018;97:e12390. - PMC - PubMed
    1. Berney DM, Looijenga LHJ, Idrees M, Oosterhuis JW, Rajpert-De Meyts E, Ulbright TM, et al. Germ cell neoplasia in situ (GCNIS): evolution of the current nomenclature for testicular pre-invasive germ cell malignancy. Histopathology 2016;69:7–10. - PubMed
    1. Oosterhuis JW, Looijenga LHJ. Testicular germ-cell tumours in a broader perspective. Nat Rev Cancer 2005;5:210–22. - PubMed
    1. Oing C, Giannatempo P, Honecker F, Oechsle K, Bokemeyer C, Beyer J. Palliative treatment of germ cell cancer. Cancer Treat Rev 2018;71:102–7. - PubMed

Publication types