. 2022 Aug 15;149(16):dev200833.
doi: 10.1242/dev.200833. Epub 2022 Aug 24.

Molecular and cellular architecture of the larval sensory organ in the cnidarian Nematostella vectensis

Affiliations

Molecular and cellular architecture of the larval sensory organ in the cnidarian Nematostella vectensis

Eleanor Gilbert et al. Development. .

Abstract

Cnidarians are the only non-bilaterian group to evolve ciliated larvae with an apical sensory organ, which is possibly homologous to the apical organs of bilaterian primary larvae. Here, we generated transcriptomes of the apical tissue in the sea anemone Nematostella vectensis and showed that it has a unique neuronal signature. By integrating previously published larval single-cell data with our apical transcriptomes, we discovered that the apical domain comprises a minimum of six distinct cell types. We show that the apical organ is compartmentalised into apical tuft cells (spot) and larval-specific neurons (ring). Finally, we identify ISX-like (NVE14554), a PRD class homeobox gene specifically expressed in apical tuft cells, as an FGF signalling-dependent transcription factor responsible for the formation of the apical tuft domain via repression of the neural ring fate in apical cells. With this study, we contribute a comparison of the molecular anatomy of apical organs, which must be carried out across phyla to determine whether this crucial larval structure evolved once or multiple times.

Keywords: Nematostella vectensis; Apical organ; Cilia; Cnidaria; Evolution; Neuron.


Conflict of interest statement

Competing interests The authors declare no competing or financial interests.

Figures

Fig. 1.
Fig. 1.
Origin and evolution of the nervous system and the apical organ. (A) A brief overview of evolutionary relationships in the animal kingdom. Porifera and Placozoa do not have defined neurons. Among non-bilaterians, Cnidaria and Ctenophora have well defined neurons. (B-E) Schematic drawings of surface-contacting flask-shaped cells in the ciliated larvae of different marine phyla. Sponge larvae (B) have ciliated photoreceptor cells capable of light sensing and other peripheral cell types such as flask and cuboidal cells. Among non-bilaterians (C,D), a true larval apical organ with integrated neurons is only found in cnidarians. Schematics were drawn based on the following primary data: (B) Nakanishi et al. (2015), Richards and Degnan (2012), Ueda et al. (2016); (C) Gajewski et al. (1996), Katsukura et al. (2004); (D) Zang and Nakanishi (2020); (E) Voronezhskaya et al. (2002), Nezlin and Voronezhskaya (2017). As ctenophore aboral sensory organs, which are sometimes also termed ‘apical organs’, are clearly not homologous to the larval apical organs of Cnidaria and Bilateria (Tamm, 2014; Edgar et al., 2022) we did not include them in this Figure.
Fig. 2.
Fig. 2.
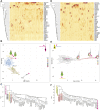
Global transcriptomic analysis. (A) Schematic representation of the apical region microdissected from the rest of the larval body tissue for transcriptomics. (B-C) Mean-difference (MD) plots represent the log[fold change (FC)] ratio of differential expression between apical and body tissues from (B) planula and (C) late planula stages. The upregulated and downregulated genes are highlighted as red and blue circles, respectively. Apical organ, AO; body, B; late planula apical organ, LPAO; late planula body, LPB; planula apical organ, PAO; planula body, PB. (D) PCA plot displaying a global overview of all datasets. (E) Correlation analysis identified two major clusters, as noted in the PCA plot. (F) MD plots represent the logFC ratio of differential expression between apical and body tissues. Datasets were pooled from planula and late planula development stages. (G) Venn diagram showing the DEGs from apical and body tissues. (H) A table detailing the number of DEGs in the current study, the number of genes with homologs and genes identified in the previous apical organ study by Sinigaglia et al. (2015), and the number of genes previously shown to be associated with the oral/aboral domains in Nematostella planula. For additional details, refer to Table S1. (I) A heatmap displaying the gene expression of selected marker genes enriched in apical organ cells. (J,K) ISH of apical organ-enriched genes. The insets show the apical view. Images are representative of approximately 40 Nematostella larvae per gene. Scale bars: 50 µm.
Fig. 3.
Fig. 3.
Spatial distribution of larval nervous system-associated genes. (A) Heatmap displaying the gene expression pattern of a set of genes related to diverse neuronal functions. Neuropeptide genes are highlighted in red. (B) Neuropeptides Nv-RPamide III and PRGamide were exclusively expressed in the apical tissue, whereas Nv-LWamide and HIRamide were detected predominantly in the body tissue. Scale bars: 50 µm. Images are representative of approximately 40 Nematostella larvae per gene. (C) Maximum likelihood analyses of the sequences from cluster analysis Fig. S2B. Phylogeny constructed with C. gigas, P. dumerilii, S. kovalevski, D. melanogaster and H. sapiens . SH support indicates fast approximate likelihood-based measures of branch supports. Adipokinetic hormone, AKH; crustacean cardioacceleratory peptide, CCAP; cholecystokinin, CCK; excitatory peptide, EP; ecdysis triggering hormone, ETH; gonadotropin releasing hormone, GnRH; muscarinic acetylcholine receptor, mAChR; neuromedin-U, NMU; neuropeptide F, NPF; neuropeptide S, NPS; neuropeptide Y, NPY; trace amine receptor, TAR; thyrotropin releasing hormone, TRH.
Fig. 4.
Fig. 4.
Spatial distribution of Nematostella larval cell types. (A,D) Expression of apically (A) and body- (D) enriched genes (rows) across 38 metacells sorted by cluster association. (B,E) Single-cell PCA plot for apically (B) and body- (E) enriched genes. Pink asterisks indicate apical organ cell type. (C,F) Hierarchical clustering for apically (C) and body- (F) enriched genes. The dendrogram produced similar results as single-cell PCA.
Fig. 5.
Fig. 5.
Spatial distribution of larval gland/secretory-cell types visualised by whole-mount ISH. (A,D-G,I-O) ISH (right) of larval gland/secretory-cell type marker genes. Each bar plot (left) displays the expression profile of selected marker genes in the different larval cell populations. The insets (top right) show the apical view. (A-D) ISH of larval gland/secretory-cell type 1. (B,C) Monopolar sensory cells with their projection from the cell body extended towards mesoglea (asterisks); the insets show the whole animal. (E,F) ISH of larval gland/secretory-cell type 2. (G,I,J) ISH of the larval gland/secretory-cell type 3; panel J shows the ciliated gland-cell type 3 at higher magnification. (H) Heatmap displaying the gene expression pattern of selected marker genes specific for each larval gland/secretory-cell types. (K-O) ISH of the larval gland/secretory-cell type 4; panel O demonstrates the spatial expression of gland-cell type 4 concentrated in the mesentery tissue. (P) Schematic representation of the spatial distribution of larval gland/secretory-cell types. (Q) Dendrogram displaying the correlation among gland cells and a list of a different combination of transcription factors expressed in each gland-cell type. (R) Gene expression of trypsin domain-containing proteins in gland cells from larval single-cell data. Images are representative of approximately 40 Nematostella larvae per gene. Scale bars: 50 µm.
Fig. 6.
Fig. 6.
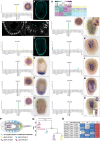
Expression analysis of apical spot and neuronal ring markers. (A-D) FISH analysis of NVE8226 (yellow). (E-H) FISH analysis of NVE14902 (yellow). A,B,E,F show the planula, C,G show metamorphosis and D,H show the early primary polyp. (I) Bar plot displaying the expression profiles of selected marker genes. (J-M) Double FISH demonstrates mutual localisation of marker genes for the spot (ISX-like; green) and the ring (NVE8226 and NVE14902; red). DAPI-stained nuclei are shown in blue. The insets (L,M) on the top right display the three-dimensional image from the apical view. (N) Immunostaining with the anti-acetylated tubulin antibody (white) counterstained with DAPI (blue) for nuclei; the pink line demonstrates the apical tuft cells concentrated in the apical pit. Pink stars indicate the apical tuft. J-N show the planula. Images are representative of approximately 40 Nematostella larvae per gene. (O) Summary diagram showing the spatial distribution of the apical organ/tuft and larval-specific neuronal cell types.
Fig. 7.
Fig. 7.
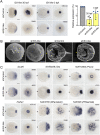
ISX-like RNAi efficiency and loss-of-function analysis of ISX-like. (A) At 30 hpf, ISX-like RNAi efficiently reduces the amount of ISX-like mRNA as shown by ISH (left) and qPCR (right). By 3 dpf, ISX-like expression largely recovers. Data show the mean±s.d. (B) ISX-like RNAi results in loss of the apical tuft. SEM of 72 hpf embryos viewed aborally (two images on the left) or laterally (two images on the right; the embryos were cracked open to visualise the internal structures). (C) Effect of ISX-like RNAi on marker gene expression in the 3 dpf planula. Ring genes NVE8226 and NVE14902 became spot genes. PRGamide and RPamide III expression was not affected. Six3/6 expression extended into the apical organ. FGFa1 expression was not affected. Lateral and aboral views are shown. For lateral views, asterisks denote the oral end. In A and C, the numbers in the top right corner show the fraction of the embryo demonstrating this phenotype. B,C show the planula. Scale bars: 50 µm.
Fig. 8.
Fig. 8.
ISX-like expression is controlled by FGF signalling. (A) The expression of the spot and ring genes is abolished upon FGF receptor or MEK inhibition, but not the expression of the aborally enriched PRGamide and RPamide III. Six3/6 expression extends into the apical organ domain. Lateral and aboral views of 3 dpf planulae are shown. For lateral views, asterisks denote the oral end. The numbers in the top right corner show the fraction of the embryos displaying the phenotype shown on the image out of the total number of embryos treated and stained as indicated on the figure. Scale bar: 50 µm. (B) Genetic interactions regulating the apical domain patterning based on findings by Sinigaglia et al. (2013) and Leclère et al. (2016) (grey) and this paper (black and blue).

References

    1. Altschul, S. F., Madden, T. L., Schäffer, A. A., Zhang, J., Zhang, Z., Miller, W. and Lipman, D. J. (1997). Gapped BLAST and PSI-BLAST: a new generation of protein database search programs. Nucleic Acids Res. 25, 3389-3402. 10.1093/nar/25.17.3389 - DOI - PMC - PubMed
    1. Arendt, D., Tosches, M. A. and Marlow, H. (2016). From nerve net to nerve ring, nerve cord and brain — evolution of the nervous system. Nat. Rev. Neurosci. 17, 61-72. 10.1038/nrn.2015.15 - DOI - PubMed
    1. Babonis, L. S., Ryan, J. F., Enjolras, C. and Martindale, M. Q. (2019). Genomic analysis of the tryptome reveals molecular mechanisms of gland cell evolution. EvoDevo 10, 23. 10.1186/s13227-019-0138-1 - DOI - PMC - PubMed
    1. Bolger, A. M., Lohse, M. and Usadel, B. (2014). Trimmomatic: a flexible trimmer for Illumina sequence data. Bioinformatics 30, 2114-2120. 10.1093/bioinformatics/btu170 - DOI - PMC - PubMed
    1. Brauchle, M., Bilican, A., Eyer, C., Bailly, X., Martínez, P., Ladurner, P., Bruggmann, R. and Sprecher, S. G. (2018). Xenacoelomorpha survey reveals that all 11 animal homeobox gene classes were present in the first Bilaterians. Genome Biol. Evol. 10, 2205-2217. 10.1093/gbe/evy170 - DOI - PMC - PubMed

Publication types