. 2022 Sep 6;11(17):e022574.
doi: 10.1161/JAHA.121.022574. Epub 2022 Aug 24.

Inflammatory Role of Milk Fat Globule-Epidermal Growth Factor VIII in Age-Associated Arterial Remodeling

Affiliations

Inflammatory Role of Milk Fat Globule-Epidermal Growth Factor VIII in Age-Associated Arterial Remodeling

Leng Ni et al. J Am Heart Assoc. .

Abstract

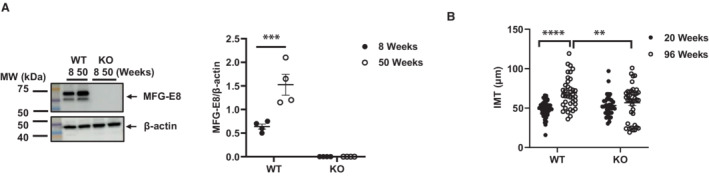
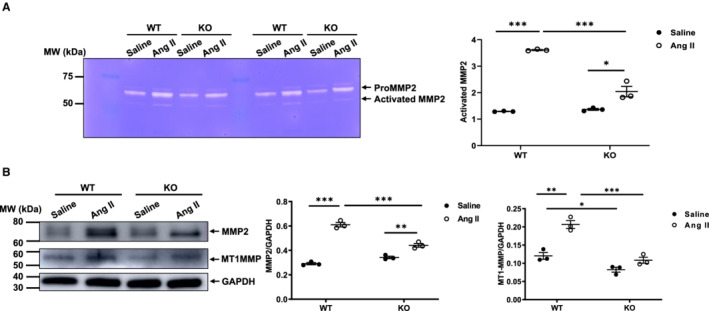
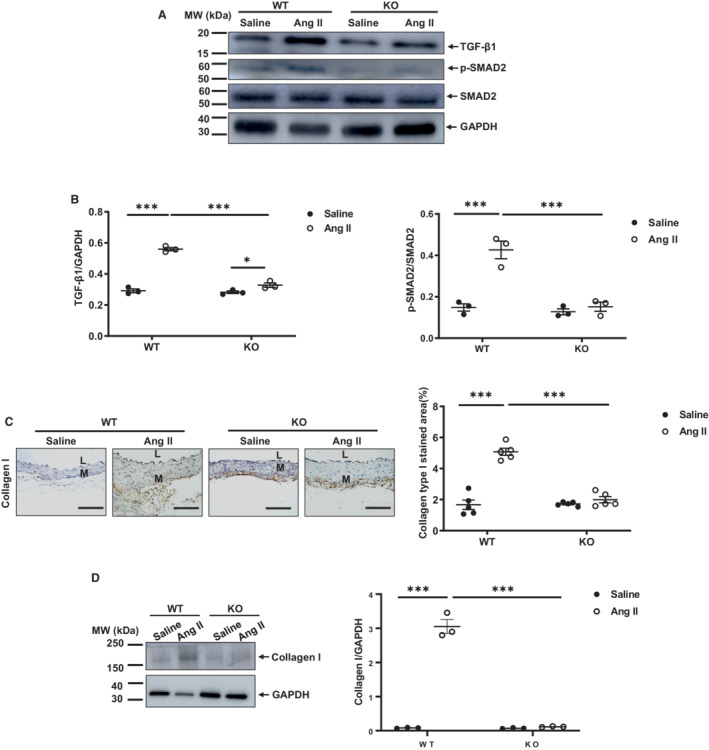
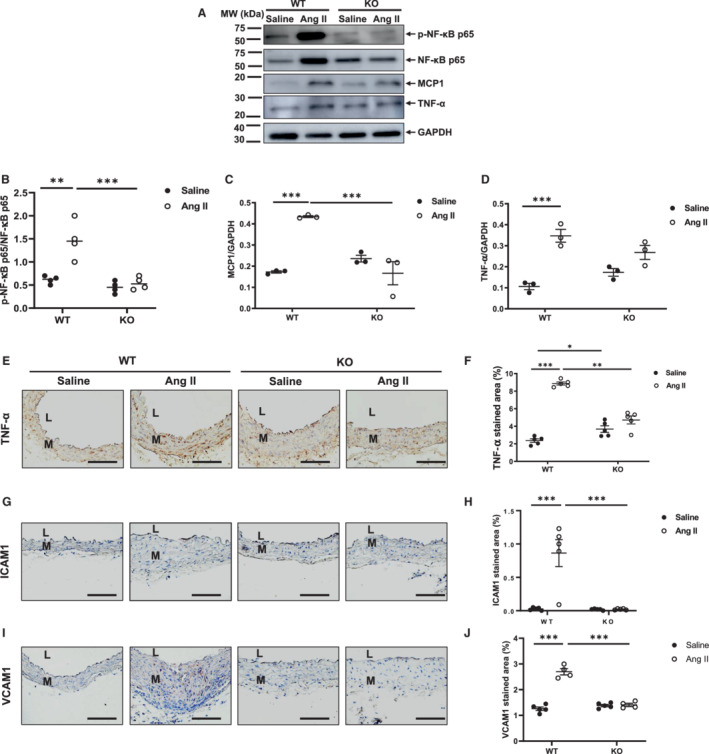
Background Age-associated aortic remodeling includes a marked increase in intimal medial thickness (IMT), associated with signs of inflammation. Although aortic wall milk fat globule-epidermal growth factor VIII (MFG-E8) increases with age, and is associated with aortic inflammation, it is not known whether MFG-E8 is required for the age-associated increase in aortic IMT. Here, we tested whether MFG-E8 is required for the age-associated increase in aortic IMT. Methods and Results To determine the role of MFG-E8 in the age-associated increase of IMT, we compared aortic remodeling in adult (20-week) and aged (96-week) MFG-E8 (-/-) knockout and age matched wild-type (WT) littermate mice. The average aortic IMT increased with age in the WT from 50±10 to 70±20 μm (P<0.0001) but did not significantly increase with age in MFG-E8 knockout mice. Because angiotensin II signaling is implicated as a driver of age-associated increase in IMT, we infused 30-week-old MFG-E8 knockout and age-matched littermate WT mice with angiotensin II or saline via osmotic mini-pumps to determine whether MFG-E8 is required for angiotensin II-induced aortic remodeling. (1) In WT mice, angiotensin II infusion substantially increased IMT, elastic lamina degradation, collagen deposition, and the proliferation of vascular smooth muscle cells; in contrast, these effects were significantly reduced in MFG-E8 KO mice; (2) On a molecular level, angiotensin II treatment significantly increased the activation and expression of matrix metalloproteinase type 2, transforming growth factor beta 1, and its downstream signaling molecule phosphorylated mother against decapentaplegic homolog 2, and collagen type I production in WT mice; however, in the MFG-E8 knockout mice, these molecular effects were significantly reduced; and (3) in WT mice, angiotensin II increased levels of aortic inflammatory markers phosphorylated nuclear factor-kappa beta p65, monocyte chemoattractant protein 1, tumor necrosis factor alpha, intercellular adhesion molecule 1, and vascular cell adhesion molecule 1 molecular expression, while in contrast, these inflammatory markers did not change in knockout mice. Conclusions Thus, MFG-E8 is required for both age-associated proinflammatory aortic remodeling and also for the angiotensin II-dependent induction in younger mice of an aortic inflammatory phenotype observed in advanced age. Targeting MFG-E8 would be a novel molecular approach to curb adverse arterial remodeling.

Keywords: age‐associated aortic remodeling; angiotensin II signaling; inflammation; intimal medial thickening; milk fat globule–epidermal growth factor 8.


Figures

Figure 1
Figure 1. Age‐associated characteristics of the MFG‐E8 knockout mouse.
A, Representative western blots of aortic MFG‐E8 (left panel). Quantitative data of western blots show aortic MFG‐E8 protein abundance (P<0.01 for main age effect, P<0.0001 for main genotype effect, P<0.01 for age×genotype, by 2‐way ANOVA). Graph (right panel) showing mean±SEM combined with individual data points for knockout and WT mice. ***P<0.001 by Bonferroni post‐hoc tests following 2‐way ANOVA. B, Morphometric analysis of the aortic IMT (P<0.0001 for main age effect, P<0.01 for main genotype effect, P<0.0001 for interaction by 2‐way ANOVA). Graph showing mean±SEM combined with individual data points for knockout and WT mice. **P<0.01; and ****P<0.0001 by Bonferroni post‐hoc tests following 2‐way ANOVA. IMT indicates intimal medial thickness; KO, knockout; MFG‐E8, milk fat globule–epidermal growth factor VIII; MW, molecular weight; and WT, wild‐type.
Figure 2
Figure 2. MFG‐E8 is required for the angiotensin II–induced signaling.
A, Plasma angiotensin II concentrations (P<0.001 for overall treatment effect by repeated 2‐way ANOVA with the factors of treatment and genotype). Graph showing mean±SEM with individual animal data from knockout and WT mice with angiotensin II or saline infusion over time. **P<0.01 and ***P<0.001 by Bonferroni post hoc tests following 2‐way ANOVA. B, Representative western blots of AT1 receptors (left panel). Western blotting analysis of the AT1 abundance (P<0.0001 for main angiotensin II treatment effect, P<0.0001 for main genotype effect, P<0.0001 for treatment×genotype, by 2‐way ANOVA). Graph (right panel) showing mean±SEM combined with individual data points for knockout and WT mice. ***P<0.001 and ****P<0.0001 by Bonferroni post hoc tests following 2‐way ANOVA. C, Representative western blots of AT2 receptor (left panel). Western blotting analysis of the AT2 abundance (P<0.001 for main angiotensin II infusion effect, P<0.05 for main genotype effect by 2‐way ANOVA). Graph (right panel) showing mean±SEM combined with individual data points for knockout and WT mice. **P<0.01 by Bonferroni post hoc tests following 2‐way ANOVA. D, Representative western blots of aortic MFG‐E8 (left panel). Quantitative data of Western blots of aortic MFG‐E8 protein abundance as normalized by GAPDH (P<0.001 for main angiotensin II infusion effect, P<0.001 for main genotype effect, P<0.001 for treatment×genotype, by 2‐way ANOVA). Graph (right panel) showing mean±SEM with individual data for knockout and WT mice with angiotensin II or saline infusion. ***P<0.001 by Bonferroni post hoc tests following 2‐way ANOVA. Ang II indicates angiotensin II; AT1, angiotensin II receptor type 1; AT2, angiotensin II receptor type 2; KO, knockout; MFG‐E8, milk fat globule–epidermal growth factor VIII; MW, molecular weight; and WT, wild‐type.
Figure 3
Figure 3. MFG‐E8 is required for the angiotensin II–induced aortic remodeling.
A, Photomicrographs of hematoxylin and eosin staining of aortic walls. Morphometric analysis of the aortic IMT (P<0.001 for main treatment effect, P<0.001 for main genotype effect, P<0.001 for treatment×genotype, by 2‐way ANOVA) (far right panel) B, Photomicrographs of EVG staining of aortic walls. Quantification of elastin breaks (P<0.05 for main treatment effect, P<0.001 for main genotype effect, P<0.01 for treatment×genotype, by 2‐way ANOVA) (far right panel). C, Photomicrograph of Masson's trichrome staining of aortic walls. Morphometric analysis of intimal medial ECM (blue color) (P>0.05 for main treatment effect, P<0.01 for main genotype effect, P<0.01 for treatment×genotype, by 2‐way ANOVA) (far right panel). D, Photomicrographs of PCNA immunostaining of aortic walls. Quantification of relative PCNA stained nuclei area (P>0.05 for main treatment effect, P<0.01 for main genotype effect, P<0.01 for treatment×genotype, by 2‐way ANOVA) (far right panel). Graph showing mean±SEM with individual animal data points for knockout and WT mice with angiotensin II or saline infusion. *P<0.05, **P<0.01 and ***P<0.001 by Bonferroni post‐hoc tests following 2‐way ANOVA. Scale bar=100 μm. Ang II indicates angiotensin II; ECM, extracellular matrix; EVG, Elastin Verhoeff's–Van Gieson; HE, hematoxylin and eosin; IMT, intimal medial thickness; KO, knockout; L, lumen; M, media; PCNA, proliferating cell nuclear antigen; and WT, wild‐type.
Figure 4
Figure 4. Angiotensin II activation of aortic MMP2 is dependent on MFG‐E8.
A, Representative zymograms of aortic gelatinases (left panel). Quantitative graph shows activated MMP2 protein abundance (P<0.001 for main treatment effect, P<0.001 for main genotype effect, P<0.001 for treatment×genotype, by 2‐way ANOVA). Graph (right panel) showing mean±SEM with individual data for knockout and WT mice with angiotensin II or saline infusion. *P<0.05 and ***P<0.001 by Bonferroni post hoc tests following 2‐way ANOVA. B, Representative western blots of aortic MMP2, MT1MMP, and GAPDH (left panel). Quantitative data of aortic MMP2 protein abundance (P<0.001 for main treatment effect, P<0.01 for main genotype effect, P<0.01 for treatment×genotype, by 2‐way ANOVA) (middle panel). Quantitative data of aortic MT1MMP2 protein abundance (P<0.001 for main treatment effect, P<0.01 for main genotype effect, P<0.01 for treatment×genotype, by 2‐way ANOVA). Graph (right panel) showing mean±SEM with individual data for knockout and WT mice with angiotensin II or saline infusion. *P<0.05, **P<0.01, and ***P<0.001 by Bonferroni post hoc tests following 2‐way ANOVA. Ang II indicates angiotensin II; IMT, intimal medial thickness; KO, knockout; MFG‐E8, milk fat globule–epidermal growth factor VIII; MMP2, matrix metalloproteinase type 2; MT1MMP, type I of MMP activator; MW, molecular weight; and WT, wild‐type.
Figure 5
Figure 5. Angiotensin II increases aortic TGF‐β1 fibrotic signaling through MFG‐E8.
A, Representative western blots of aortic TGF‐β1, p‐SMAD2, and SMAD2. B, Quantitative data of aortic activated TGF‐β1 protein abundance (P<0.001 for main treatment effect, P<0.001 for main genotype effect, P<0.001 for treatment×genotype, by 2‐way ANOVA) (left panel). Quantitative data of aortic p‐SMAD2/SMAD2 ratio (P<0.001 for main treatment effect, P<0.001 for main genotype effect, P<0.01 for treatment×genotype, by two‐way ANOVA). Graph (right panel) showing mean±SEM with individual data for knockout and WT mice with angiotensin II or saline infusion. *P<0.05 and ***P<0.001 by Bonferroni post hoc tests following 2‐way ANOVA. C, Photomicrographs of immunostaining collagen type I. Morphometric analysis shows relative collagen I immunostaining area (%) (P<0.001 for main treatment effect, P<0.001 for main genotype effect, P<0.001 for treatment×genotype, by 2‐way ANOVA). Graph (far right panel) showing mean±SEM with individual data for knockout and WT mice with angiotensin II or saline infusion. ***P<0.001 by Bonferroni post hoc tests following 2‐way ANOVA. D, Representative western blots of aortic collagen I. Quantitative data of aortic collagen I (P<0.01 for main treatment effect, P>0.05 for main genotype effect, P<0.0001 for treatment×genotype, by 2‐way ANOVA). Graph (right panel) showing mean±SEM with individual data points for knockout and WT mice with angiotensin II or saline infusion. ***P<0.001 by Bonferroni post hoc tests following 2‐way ANOVA. Scale bar=100 μm. Ang II indicates angiotensin II; KO, knockout; L, lumen; M, media; MW, molecular weight; p‐SMAD2, phosphorylated mother against decapentaplegic homolog 2; SMAD2, mother against decapentaplegic homolog 2; TGF‐β1, transforming growth factor beta 1; and WT, wild‐type.
Figure 6
Figure 6. Angiotensin II activation of NF‐κB signaling and its downstream proinflammatory effects require MFG‐E8.
A, Representative western blots of aortic p‐NF‐κB p65, NF‐κB p65, MCP‐1, TNF‐α, and GAPDH. B, Quantitative data of p‐NF‐κB p65 protein abundance (P<0.001 for main treatment effect, P<0.01 for main genotype effect, P<0.001 for treatment×genotype, by 2‐way ANOVA). Graph showing mean±SEM and individual data points for knockout and WT mice with angiotensin II or saline infusion. **P<0.01 and ***P<0.001 by Bonferroni post hoc tests following 2‐way ANOVA. C, Quantitative data of MCP1 protein abundance (P<0.01 for main treatment effect, P<0.05 for main genotype effect, P<0.001 for treatment×genotype, by two‐way ANOVA). Graph showing mean±SEM with individual data points for knockout and WT mice with angiotensin II or saline infusion. ***P<0.001 by Bonferroni post‐hoc tests following two‐way ANOVA. D, Quantitative data of TNF‐α protein abundance (P<0.001 for main treatment effect, P>0.05 for main genotype effect, P<0.05 for treatment×genotype, by two‐way ANOVA). Bar graph showing mean±SEM with individual data points for knockout and WT mice with angiotensin II or saline infusion. ***P<0.001 by Bonferroni post hoc tests following 2‐way ANOVA. E, Photomicrographs of immunostaining of TNF‐α. F, Quantitative data of aortic TNF‐α immunostaining area (%) (P<0.01 for main treatment effect, P<0.05 for main genotype effect, P<0.01 for treatment×genotype, by two‐way ANOVA). Graph showing mean±SEM with individual data for KO and WT mice with angiotensin II or saline infusion. *P<0.05, **P<0.01, and ***P<0.001 by Bonferroni post hoc tests following two‐way ANOVA. G, Photomicrographs of immunostaining ICAM1. H, Morphometric analysis of relative ICAM1 immunostaining area (%) (P<0.001 for main treatment effect, P<0.001 for main genotype effect, P<0.001 for treatment×genotype, by 2‐way ANOVA). Graph showing mean±SEM with individual data for knockout and WT mice with angiotensin II or saline infusion. ***P<0.001 by Bonferroni post hoc tests following 2‐way ANOVA. I, Photomicrographs of immunostaining VCAM1. J. Morphometric analysis of relative VCAM1 immunostaining area (%) (P<0.001 for main treatment effect, P<0.001 for main genotype effect, P<0.001 for treatment×genotype, by two‐way ANOVA). Graph showing mean±SEM with individual data for knockout and WT mice with angiotensin II or saline infusion. ***P<0.001 by Bonferroni post‐hoc tests following 2‐way ANOVA. Scale bar=100 μm. Ang II indicates angiotensin II; ICAM1, intercellular adhesion molecule 1; KO, knockout; L, lumen; M, media; MCP1, monocyte chemoattractant protein 1; MFG‐E8, milk fat globule–epidermal growth factor VIII; MW, molecular weight; NF‐κB p65, nuclear factor‐kappa beta p65; p‐NF‐κB p65, phosphorylated nuclear factor‐kappa beta p65; VCAM1, vascular cell adhesion molecule 1; TNF‐α, tumor necrosis factor alpha; and WT, wild‐type.

Similar articles

Cited by

References

    1. Borisenko GG, Iverson SL, Ahlberg S, Kagan VE, Fadeel B. Milk fat globule epidermal growth factor 8 (MFG‐e8) binds to oxidized phosphatidylserine: implications for macrophage clearance of apoptotic cells. Cell Death Differ. 2004;11:943–945. doi: 10.1038/sj.cdd.4401421 - DOI - PubMed
    1. Atabai K, Fernandez R, Huang X, Ueki I, Kline A, Li Y, Sadatmansoori S, Smith‐Steinhart C, Zhu W, Pytela R, et al. Mfge8 is critical for mammary gland remodeling during involution. Mol Biol Cell. 2005;16:5528–5537. doi: 10.1091/mbc.e05-02-0128 - DOI - PMC - PubMed
    1. Wang M, Fu Z, Wu J, Zhang J, Jiang L, Khazan B, Telljohann R, Zhao M, Krug AW, Pikilidou M, et al. MFG‐E8 activates proliferation of vascular smooth muscle cells via integrin signaling. Aging Cell. 2012;11:500–508. doi: 10.1111/j.1474-9726.2012.00813.x - DOI - PMC - PubMed
    1. Fu Z, Wang M, Gucek M, Zhang J, Wu J, Jiang L, Monticone RE, Khazan B, Telljohann R, Mattison J, et al. Milk fat globule protein epidermal growth factor‐8: a pivotal relay element within the angiotensin ii and monocyte chemoattractant protein‐1 signaling cascade mediating vascular smooth muscle cells invasion. Circ Res. 2009;104:1337–1346. doi: 10.1161/CIRCRESAHA.108.187088 - DOI - PMC - PubMed
    1. Soubeyrand S, Nikpay M, Turner A, Dang AT, Herfkens M, Lau P, McPherson R. Regulation of MFGE8 by the intergenic coronary artery disease locus on 15q26.1. Atherosclerosis. 2019;284:11–17. doi: 10.1016/j.atherosclerosis.2019.02.012 - DOI - PubMed

Publication types