. 2022 Sep 6;11(17):e026036.
doi: 10.1161/JAHA.122.026036. Epub 2022 Aug 24.

Gut Microbiota and Coronary Plaque Characteristics

Affiliations

Gut Microbiota and Coronary Plaque Characteristics

Akihiro Nakajima et al. J Am Heart Assoc. .

Abstract

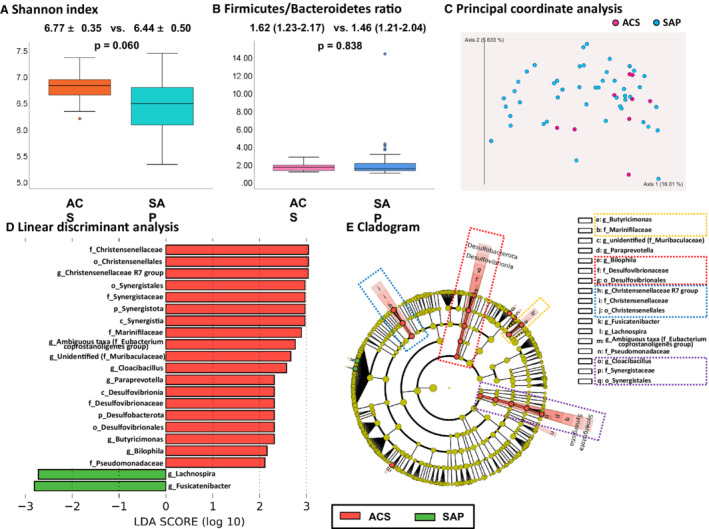
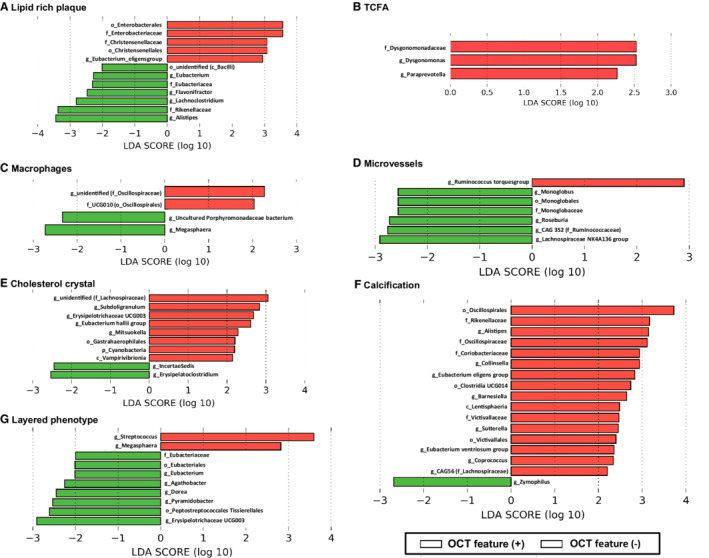
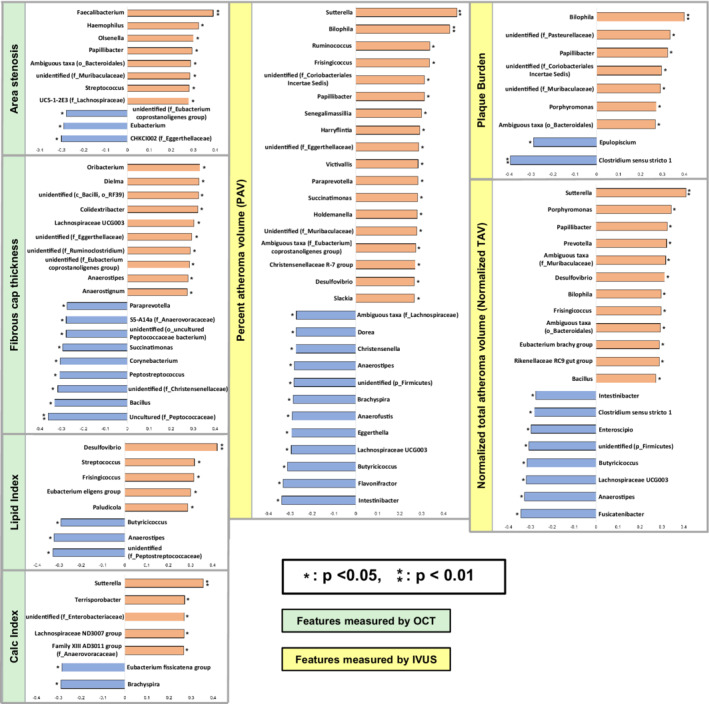
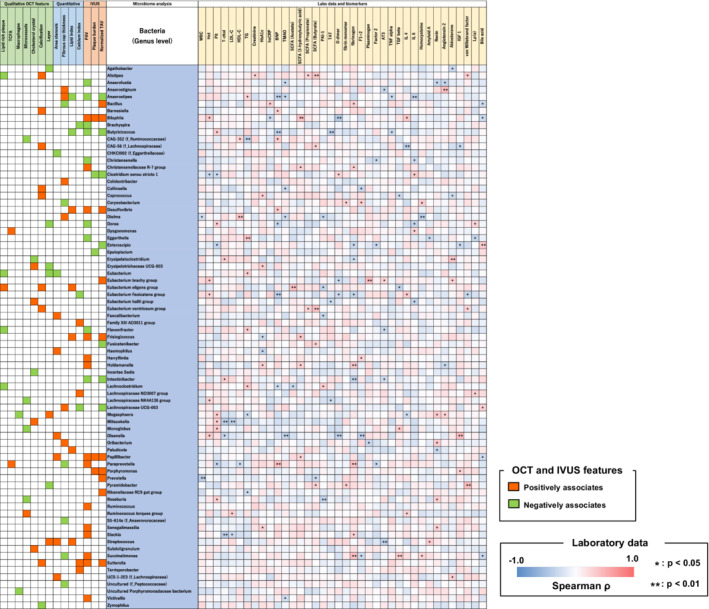
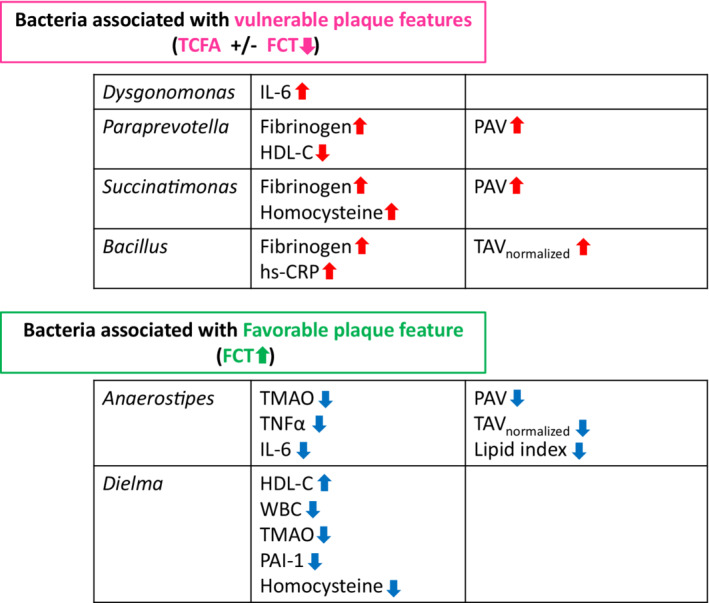
Background The relationship between gut microbiota and in vivo coronary plaque characteristics has not been reported. This study was conducted to investigate the relationship between gut microbiota and coronary plaque characteristics in patients with coronary artery disease. Methods and Results Patients who underwent both optical coherence tomography and intravascular ultrasound imaging and provided stool and blood specimens were included. The composition of gut microbiota was evaluated using 16S rRNA sequencing. A total of 55 patients were included. At the genus level, 2 bacteria were associated with the presence of thin-cap fibroatheroma, and 9 bacteria were associated with smaller fibrous cap thickness. Among them, some bacteria had significant associations with inflammatory/prothrombotic biomarkers. Dysgonomonas had a positive correlation with interleukin-6, Paraprevotella had a positive correlation with fibrinogen and negative correlation with high-density lipoprotein cholesterol, Succinatimonas had positive correlations with fibrinogen and homocysteine, and Bacillus had positive correlations with fibrinogen and high-sensitivity C-reactive protein. In addition, Paraprevotella, Succinatimonas, and Bacillus were also associated with greater plaque volume. Ten bacteria were associated with larger fibrous cap thickness. Some were associated with protective biomarker changes; Anaerostipes had negative correlations with trimethylamine N-oxide, tumor necrosis factor α, and interleukin-6, and Dielma had negative correlations with trimethylamine N-oxide, white blood cells, plasminogen activator inhibitor-1, and homocysteine, and a positive correlation with high-density lipoprotein cholesterol. Conclusions Bacteria that were associated with vulnerable coronary plaque phenotype and greater plaque burden were identified. These bacteria were also associated with elevated inflammatory or prothrombotic biomarkers. Registration URL: https://www.umin.ac.jp/ctr/; Unique identifier: UMIN000041692.

Keywords: 16S rRNA; biomarkers; coronary artery disease; gut microbiota; intravascular ultrasound; optical coherence tomography; vulnerable plaque.


Figures

Figure 1
Figure 1. Difference in gut microbiota between patients presenting with ACS and those with SAP.
A, Shannon index. B, Firmicutes/Bacteroidetes ratio. C, Principal coordinate analysis did not show a clear tread. D, LDA showed that 5 bacteria at the family level (Christensenellaceae, Synergistaceae, Marinifilaceae, Desulfovibrionaceae, and Pseudomonadaceae) and 5 bacteria at the genus level (Christensenellaceae R7 group, Cloacibacillus, Paraprevotella, Butyricimonas, and Bilophila) (excluding unidentified bacteria and ambiguous taxa) were associated with ACS. Two bacteria at the genus level (Lachnospira and Fusicatenibacter) were associated with SAP. E, Cladogram showed the following lineages were associated with ACS: DesulfobacterotaDesulfovibrioniaDesulfovibrionalesDesulfovibrionaceaeBilophila, SynergistotaSynergistiaSynergistalesSynergistaceaeCloacibacillus, ChristensenellalesChristensenellaceaeChristensenellaceae R7 group, and MarinifilaceaeButyricimonas. ACS indicates acute coronary syndrome; c_, class level; f_, family level; g_, genus level; LDA, linear discriminant analysis; o_, order level; p_, phylum level; and SAP, stable angina pectoris.
Figure 2
Figure 2. Gut bacteria that are associated with specific qualitative OCT features in linear discrimination analysis.
The figure shows the gut bacteria that are associated with lipid rich plaque (A), TCFA (B), macrophages (C), microvessels (D), cholesterol crystal (E), calcification (F), and layered phenotype (G) in LDA. c_ indicates class level; f_, family level; g_, genus level; LDA, linear discrimination analysis; o_, order level; OCT, optical coherence tomography; p_, phylum level; and TCFA, thin‐cap fibroatheroma.
Figure 3
Figure 3. Correlations between gut bacteria and quantitative OCT/IVUS features at the genus level.
The figure shows the correlations between gut bacteria quantitative OCT/IVUS features at the genus level. Eight bacteria, 5 bacteria, and 5 bacteria (6 bacteria, 5 bacteria, and 4 bacteria excluding unidentified bacteria and ambiguous taxa) were associated with positive correlations with area stenosis, lipid index, and calcification index, respectively. Nine bacteria (7 bacteria excluding unidentified bacteria) were associated with negative correlations with FCT measured. Eighteen bacteria, 7 bacteria, and 12 bacteria (14 bacteria, 3 bacteria, and 10 bacteria excluding unidentified bacteria and ambiguous taxa) were associated with positive correlations with PAV, PB, and TAVnormalized measured by IVUS, respectively. c_ indicates class level; f_, family level; FCT, fibrous cap thickness; g_, genus level; IVUS, intravascular ultrasound; o_, order level; OCT, optical coherence tomography; p_, phylum level; PAV, percent atheroma volume; PB, plaque burden; and TAVnormalized, normalized total atheroma volume.
Figure 4
Figure 4. Correlations between blood biomarkers and gut bacteria that are associated with specific OCT/IVUS features at the genus level.
The figure shows the correlations between blood biomarkers and gut bacteria that associate with specific OCT/IVUS features at the genus level. Notable bacteria are summarized in Figure 5. AT3 indicates antithrombin III; BNP, B‐type natriuretic peptide; F1+2, prothrombin fragment F1+2; HbA1c, glycosylated hemoglobin; Hct, hematocrit; HDL‐C, high‐density lipoprotein cholesterol; hs‐CRP, high‐sensitivity C‐reactive protein; IGF 1, insulin‐like growth factor 1; IL, interleukin; IVUS, intravascular ultrasound; LDL‐C, low‐density lipoprotein cholesterol; Lp(a), lipoprotein (a); OCT, optical coherence tomography; PAI‐1, plasminogen activator inhibitor‐1; PAV, percent atheroma volume; Plt, platelet; SCFA, short‐chain fatty acid; TAT, thrombin–anti‐thrombin complex; TAV, total atheroma volume; TCFA, thin‐cap fibroatheroma; T‐chol, total cholesterol; TG, triglyceride; TGFβ, transforming growth factor β; TMAO, trimethylamine N‐oxide; TNFα, tumor necrosis factor α; and WBC, white blood cell.
Figure 5
Figure 5. Notable gut bacteria that are associated with vulnerable features and inflammatory/prothrombotic blood biomarkers.
Dysgonomonas (associated with the presence of TCFA) had a significant positive correlation with IL‐6, Paraprevotella (associated with the presence of TCFA, decrease in FCT, and increase in PAV) had a significant positive correlation with fibrinogen and negative correlation with HDL‐C, Succinatimonas (associated with a decrease in FCT and increase in PAV) had significant positive correlations with fibrinogen and homocysteine, and Bacillus (associated with a decrease in FCT and increase in TAVnormalized) had significant positive correlations with fibrinogen and hs‐CRP. Anaerostipes (associated with an increase in FCT and decrease in lipid index, PAV, and TAVnormalized) had significant negative correlations with TMAO, TNFα, and IL‐6, and Dielma (associated with an increase in FCT) had negative correlations with white blood cells, TMAO, PAI‐1, and homocysteine and a positive correlation with HDL‐C. FCT indicates fibrous cap thickness; HDL‐C, high‐density lipoprotein cholesterol; hs‐CRP, high‐sensitivity C‐reactive protein; IL, interleukin; PAI‐1, plasminogen activator inhibitor‐1; PAV, percent atheroma volume; TAVnormalized, normalized total atheroma volume; TCFA, thin‐cap fibroatheroma; TMAO, trimethylamine N‐oxide; TNFα, tumor necrosis factor α; and WBC, white blood cell.

Similar articles

Cited by

References

    1. Jonsson AL, Bäckhed F. Role of gut microbiota in atherosclerosis. Nat Rev Cardiol. 2017;14:79–87. doi: 10.1038/nrcardio.2016.183 - DOI - PubMed
    1. Tang WHW, Backhed F, Landmesser U, Hazen SL. Intestinal microbiota in cardiovascular health and disease: JACC state‐of‐the‐art review. J Am Coll Cardiol. 2019;73:2089–2105. doi: 10.1016/j.jacc.2019.03.024 - DOI - PMC - PubMed
    1. Fan Y, Pedersen O. Gut microbiota in human metabolic health and disease. Nat Rev Microbiol. 2021;19:55–71. doi: 10.1038/s41579-020-0433-9 - DOI - PubMed
    1. Tang WH, Wang Z, Levison BS, Koeth RA, Britt EB, Fu X, Wu Y, Hazen SL. Intestinal microbial metabolism of phosphatidylcholine and cardiovascular risk. N Engl J Med. 2013;368:1575–1584. doi: 10.1056/NEJMoa1109400 - DOI - PMC - PubMed
    1. Verhaar BJH, Collard D, Prodan A, Levels JHM, Zwinderman AH, Backhed F, Vogt L, Peters MJL, Muller M, Nieuwdorp M, et al. Associations between gut microbiota, faecal short‐chain fatty acids, and blood pressure across ethnic groups: the HELIUS study. Eur Heart J. 2020;41:4259–4267. doi: 10.1093/eurheartj/ehaa704 - DOI - PMC - PubMed

Publication types

Associated data