

β-catenin cancer-enhancing genomic regions axis is involved in the development of fibrolamellar hepatocellular carcinoma
- PMID: 36000549
- PMCID: PMC9512470
- DOI: 10.1002/hep4.2055
β-catenin cancer-enhancing genomic regions axis is involved in the development of fibrolamellar hepatocellular carcinoma
Abstract
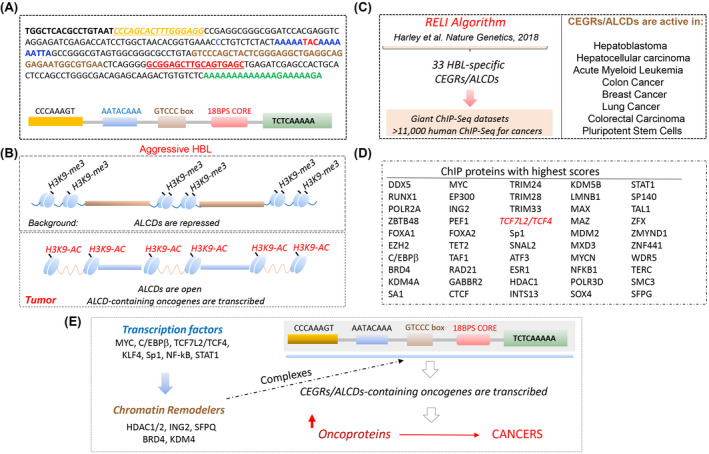
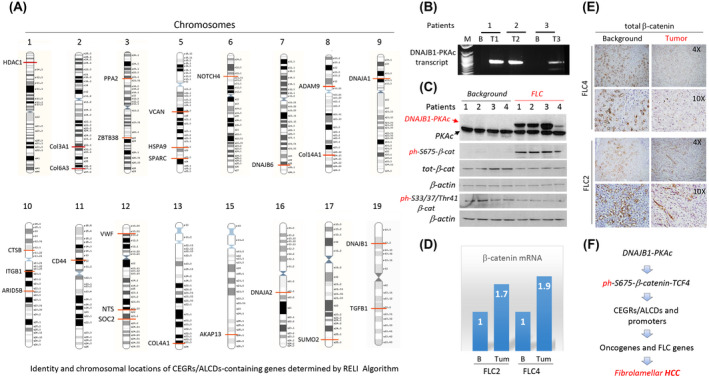
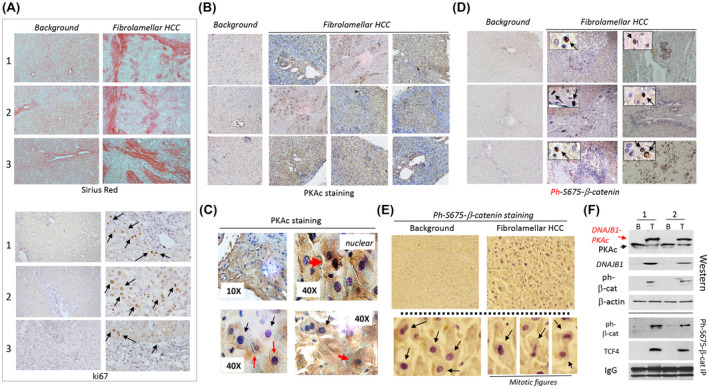
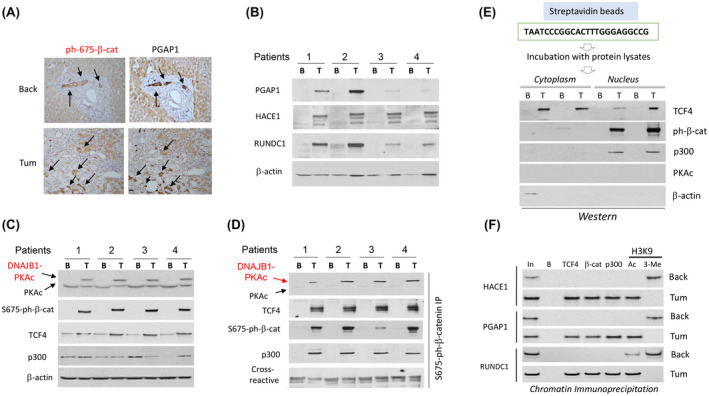
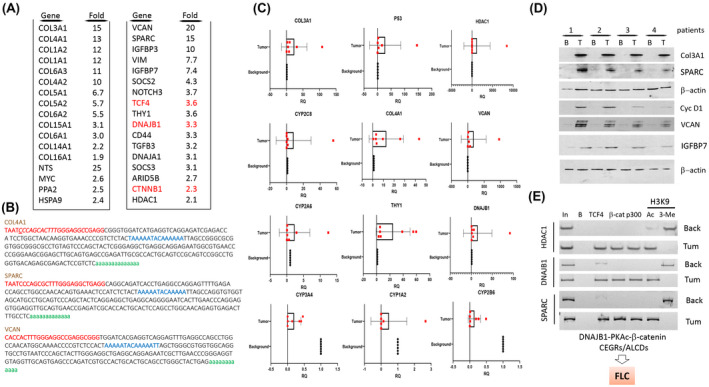
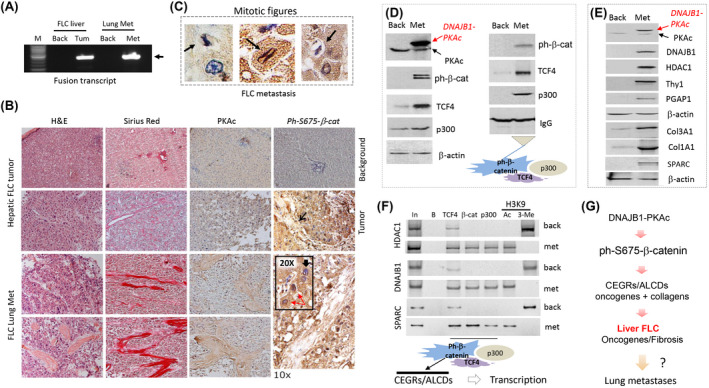
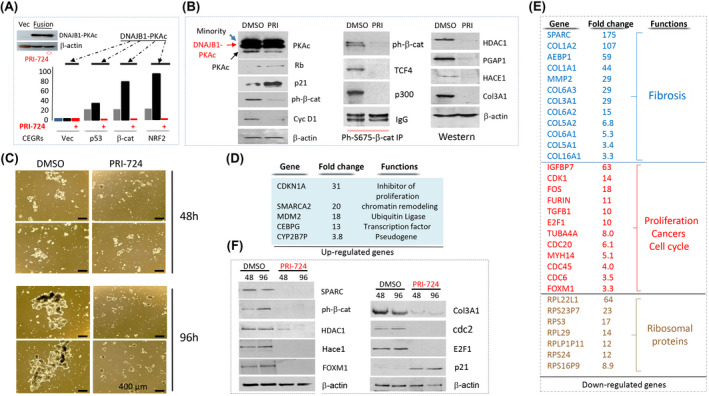
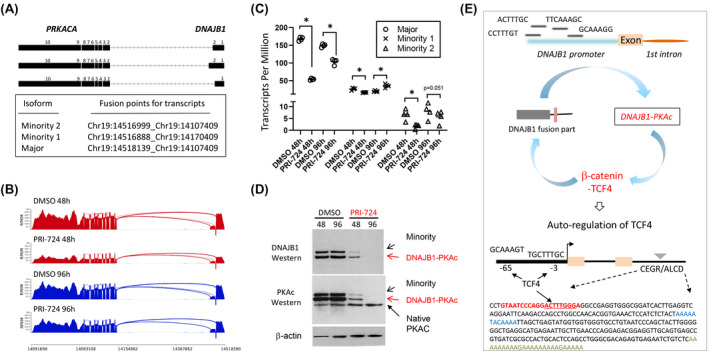
Fibrolamellar hepatocellular carcinoma (FLC) is a disease that occurs in children and young adults. The development of FLC is associated with creation of a fusion oncoprotein DNAJB1-PKAc kinase, which activates multiple cancer-associated pathways. The aim of this study was to examine the role of human genomic regions, called cancer-enhancing genomic regions or aggressive liver cancer domains (CEGRs/ALCDs), in the development of FLC. Previous studies revealed that CEGRs/ALCDs are located in multiple oncogenes and cancer-associated genes, regularly silenced in normal tissues. Using the regulatory element locus intersection (RELI) algorithm, we searched a large compendium of chromatin immunoprecipitation-sequencing (ChIP) data sets and found that CEGRs/ALCDs contain regulatory elements in several human cancers outside of pediatric hepatic neoplasms. The RELI algorithm further identified components of the β-catenin-TCF7L2/TCF4 pathway, which interacts with CEGRs/ALCDs in several human cancers. Particularly, the RELI algorithm found interactions of transcription factors and chromatin remodelers with many genes that are activated in patients with FLC. We found that these FLC-specific genes contain CEGRs/ALCDs, and that the driver of FLC, fusion oncoprotein DNAJB1-PKAc, phosphorylates β-catenin at Ser675, resulting in an increase of β-catenin-TCF7L2/TCF4 complexes. These complexes increase a large family of CEGR/ALCD-dependent collagens and oncogenes. The DNAJB1-PKAc-β-catenin-CEGR/ALCD pathway is preserved in lung metastasis. The inhibition of β-catenin in FLC organoids inhibited the expression of CEGRs/ALCDs-dependent collagens and oncogenes, preventing the formation of the organoid's structure. Conclusion: This study provides a rationale for the development of β-catenin-based therapy for patients with FLC.
© 2022 The Authors. Hepatology Communications published by Wiley Periodicals LLC on behalf of American Association for the Study of Liver Diseases.
Conflict of interest statement
LR owns stock in PhoenixSongs Biologicals.
Figures
Similar articles
-
Phosphorylation-Mediated Activation of β-Catenin-TCF4-CEGRs/ALCDs Pathway Is an Essential Event in Development of Aggressive Hepatoblastoma.Cancers (Basel). 2022 Dec 9;14(24):6062. doi: 10.3390/cancers14246062. Cancers (Basel). 2022. PMID: 36551548 Free PMC article.
-
β-catenin-cohesin ring-CEGRs/ALCDs axis activation contributes to the development of hepatoblastoma and fibrolamellar HCC.Mol Cancer Res. 2025 Jul 23. doi: 10.1158/1541-7786.MCR-25-0236. Online ahead of print. Mol Cancer Res. 2025. PMID: 40699205
-
BAP1 mutations define a homogeneous subgroup of hepatocellular carcinoma with fibrolamellar-like features and activated PKA.J Hepatol. 2020 May;72(5):924-936. doi: 10.1016/j.jhep.2019.12.006. Epub 2019 Dec 18. J Hepatol. 2020. PMID: 31862487
-
A framework for fibrolamellar carcinoma research and clinical trials.Nat Rev Gastroenterol Hepatol. 2022 May;19(5):328-342. doi: 10.1038/s41575-022-00580-3. Epub 2022 Feb 21. Nat Rev Gastroenterol Hepatol. 2022. PMID: 35190728 Free PMC article. Review.
-
How Do I Diagnose Fibrolamellar Carcinoma?Mod Pathol. 2025 Apr;38(4):100711. doi: 10.1016/j.modpat.2025.100711. Epub 2025 Jan 13. Mod Pathol. 2025. PMID: 39814265 Review.
Cited by
-
Combinations of PRI-724 Wnt/β-Catenin Pathway Inhibitor with Vismodegib, Erlotinib, or HS-173 Synergistically Inhibit Head and Neck Squamous Cancer Cells.Int J Mol Sci. 2023 Jun 21;24(13):10448. doi: 10.3390/ijms241310448. Int J Mol Sci. 2023. PMID: 37445628 Free PMC article.
-
Cellular origin and molecular mechanisms of lung metastases in patients with aggressive hepatoblastoma.Hepatol Commun. 2024 Jan 29;8(2):e0369. doi: 10.1097/HC9.0000000000000369. eCollection 2024 Feb 1. Hepatol Commun. 2024. PMID: 38285876 Free PMC article.
-
DNAJB1-PKAc Kinase Is Expressed in Young Patients with Pediatric Liver Cancers and Enhances Carcinogenic Pathways.Cancers (Basel). 2024 Dec 30;17(1):83. doi: 10.3390/cancers17010083. Cancers (Basel). 2024. PMID: 39796711 Free PMC article.
-
Phosphorylation-Mediated Activation of β-Catenin-TCF4-CEGRs/ALCDs Pathway Is an Essential Event in Development of Aggressive Hepatoblastoma.Cancers (Basel). 2022 Dec 9;14(24):6062. doi: 10.3390/cancers14246062. Cancers (Basel). 2022. PMID: 36551548 Free PMC article.
-
Inhibition of Histone Deacetylase Activity Increases Cisplatin Efficacy to Eliminate Metastatic Cells in Pediatric Liver Cancers.Cancers (Basel). 2024 Jun 22;16(13):2300. doi: 10.3390/cancers16132300. Cancers (Basel). 2024. PMID: 39001363 Free PMC article.
References
-
- Graham RP, Jin L, Knutson DL, Kloft‐Nelson SM, Greipp PT, Waldburger N, et al. DNAJB1‐PRKACA is specific for fibrolamellar carcinoma. Mod Pathol. 2015;28:822–9. - PubMed
-
- Engelholm LH, Riaz A, Serra D, Dagnæs‐Hansen F, Johansen JV, Santoni‐Rugiu E, et al. CRISPR/Cas9 engineering of adult mouse liver demonstrates that the Dnajb1‐Prkaca gene fusion is sufficient to induce tumors resembling fibrolamellar hepatocellular carcinoma. Gastroenterology. 2017;153:1662–73.e10. - PMC - PubMed
Publication types
MeSH terms
Substances
Supplementary concepts
Grants and funding
LinkOut - more resources
Full Text Sources
Medical
Miscellaneous
