Review
. 2022 Sep 27;16(9):13430-13467.
doi: 10.1021/acsnano.2c04756. Epub 2022 Aug 24.

Is Graphene Shortening the Path toward Spinal Cord Regeneration?

Affiliations
Review

Is Graphene Shortening the Path toward Spinal Cord Regeneration?

André F Girão et al. ACS Nano. .

Abstract

Along with the development of the next generation of biomedical platforms, the inclusion of graphene-based materials (GBMs) into therapeutics for spinal cord injury (SCI) has potential to nourish topmost neuroprotective and neuroregenerative strategies for enhancing neural structural and physiological recovery. In the context of SCI, contemplated as one of the most convoluted challenges of modern medicine, this review first provides an overview of its characteristics and pathophysiological features. Then, the most relevant ongoing clinical trials targeting SCI, including pharmaceutical, robotics/neuromodulation, and scaffolding approaches, are introduced and discussed in sequence with the most important insights brought by GBMs into each particular topic. The current role of these nanomaterials on restoring the spinal cord microenvironment after injury is critically contextualized, while proposing future concepts and desirable outputs for graphene-based technologies aiming to reach clinical significance for SCI.

Keywords: biomaterials; electrodes; glial reaction; graphene; nanocarriers; neural cells; neural stimulation; scaffolds; spinal cord injury; tissue engineering.


Conflict of interest statement

The authors declare no competing financial interest.

Figures

Figure 1
Figure 1
Spinal cord. Schematic overview of the spinal cord anatomy (left) and the areas of the body innervated by each spinal cord region (right): cervical (C, light orange), thoracic (T, yellow), lumbar (L, dark orange), and sacral (S, fuchsia). The figure was partly generated using and adapting Servier Medical Art templates “Neurology”, provided by Servier (https://smart.servier.com), under a Creative Commons Attribution 3.0 Unported License (https://creativecommons.org/licenses/by/3.0/). The section A1 highlights an axial MRI image of the intact human spinal cord at the fourth lumbar vertebral level. The directionally colored fractional anisotropy (left) reveals small axonal pathways including the anterior gray commissure and dorsal/ventral nerve rootlets (white arrowheads). The T2*-weighted gradient echo image demonstrates both ventral (motor) nuclei (red arrowheads), as well as dorsal (sensory) nuclei such as the nucleus proprius/substantia gelatinosa (yellow arrowheads). Adapted with permission from ref (27). Copyright 2018 Elsevier.
Figure 2
Figure 2
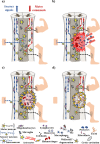
Pathophysiology of TSCI. (a) Spinal cord microenvironment before injury, including both sensory (left) and motor (right) neuronal pathways. Ascending tracks transport somatic sensory information including touch, pressure, temperature, and pain from receptors located in the skin, muscles, and internal organs through sensory neurons to the brain and upper segments of the spinal cord. Inversely, descending tracks conduct information from the cerebral cortex toward motor neurons to target peripheral effectors responsible for complex activities (e.g., movement of the upper and lower limbs). (b) Acute phase of TSCI. Trauma immediately provokes cell death and disruption of neuronal pathways, inducing the infiltration of inflammatory cells, hemorrhages, ischemia, and edema. (c) Subacute phase of TSCI. The inflammatory cascade aggravates cell death and demyelination, as M1 and M2 polarized cells trigger endogenous pro-inflammatory and pro-regenerative responses, respectively. (d) Intermediate and chronic phases of TSCI. Astrogliosis boosts the formation of the spinal injury scar, which plays simultaneously a protective and inhibitory role. At the later stages, the lesion is characterized by cystic cavitation and Wallerian degeneration. The figure was generated using and adapting the Servier Medical Art templates “Neurology”, provided by Servier (https://smart.servier.com), under a Creative Commons Attribution 3.0 Unported License (https://creativecommons.org/licenses/by/3.0/).
Figure 3
Figure 3
Standard clinical evolution of TSCI patients, going from diagnostic, through therapy to rehabilitation. The figure was partially generated using and adapting the Servier Medical Art templates “Neurology”, provided by Servier (https://smart.servier.com), under a Creative Commons Attribution 3.0 Unported License (https://creativecommons.org/licenses/by/3.0/). MRI data adapted with permission from ref (58). Copyright 2019 Elsevier.
Figure 4
Figure 4
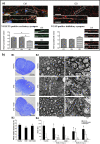
GBMs and neuronal cells. (a) Internalization of GO nanosheets by cortical neurons. Representative images of cultured neurons at 17 days in vitro (top) and the density of VGLUT1-positive excitatory synapses and VGAT-positive inhibitory synapses in untreated (N.T.), vehicle-treated (Ctrl), and GO-treated neurons (bottom). Neurons stained for β-III tubulin (gray), vesicular glutamate transporter (VGLUT1, green), and vesicular GABA transporter (VGAT, red). Nuclei were stained with DAPI. Scale bars = 5 μm. Adapted with permission from ref (105). Copyright 2016 American Chemical Society. (b) GQDs reduce demyelination and axonal damage in the spinal cord during autoimmune encephalomyelitis (EAE). Lumbosacral spinal cord samples were collected at day 14 (B1, B2, B4) or day 21 (B3, B4) from healthy (PBS-injected) and EAE rats treated or not with graphite-derived GQDs (10 mg/kg/day). Demyelination was assessed by Luxol fast blue staining (n = 5 rats per group, cumulative score) (B1, B2) or TEM (n = 3 rats per group; day 14 cumulative score 7.8 ± 2.9 vs 3.0 ± 2.0; day 21 cumulative score 17.0 ± 6.5 vs 5.5 ± 5.3 in control EAE vs GQDs treatment) (B3, B4). Representative micrographs are shown in (B1) and (B3; low magnification–left panel, high magnification–right panel), with white arrows, black arrow, and white arrowhead pointing at demyelination, axonal damage, and GQDs, respectively. The quantitative analysis of demyelination by Luxol fast blue staining and TEM is presented in (B2) and (B4), respectively (*p < 0.05 vs healthy control; #p < 0.05 vs EAE control). Adapted with permission from ref (115). Copyright 2019 Elsevier.
Figure 5
Figure 5
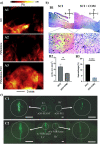
GBMs delivering biomolecules into the CNS. (a) Photoacoustic (PA) images of the cross-section of nude mice brain 8 h after tail vein injection of pure GO (A1), pirfenidone (A2) and pirfenidone-functionalized GO (FGO) (A3). Adapted with permission from ref (148). Copyright 2015 Elsevier. (b) Therapeutic effect of GO-PEG and GO-chitosan nanocomposites on SCI. (B1) Histological investigation of the spinal cord at 14 days postinjury by H&E staining at low magnification (4×), and high magnification (40×); higher magnification of the injury site obviously showed the cystic cavities (asterisks) and hemorrhage (arrowheads) in the SCI and treatment (SCI + COM) groups. (B2 and B3) Quantitative results for the cavity regions of sagittal segments and hemorrhage percentage at the lesion site in the spinal cord (*p < 0.05, ****p < 0.0001, n = 4 animals in each group). The scale bars are 1 mm (top) and 50 μm (zoom). Adapted with permission under a Creative Commons Attribution 3.0 Unported License from ref (149). Copyright 2021 Royal Society of Chemistry. (c) Frozen sections of C57BL/6 mice brains transfected with (C1) rGO- polyethylenimine-neurotensin/plasmid DNA (rGO-PEI-NT/pDNA) and rGO-PEI/pDNA, and (C2) rGO-PEI-NT with/without NIR laser irradiation. Scale bar = 600 μm. Adapted with permission from ref (154). Copyright 2016 Wiley-VCH.
Figure 6
Figure 6
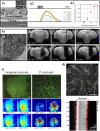
Graphene-based electrodes interfacing the CNS. (a) In vivo stimulation of cortical tissue by a 3D porous graphene electrode. (A1) Electrode morphology. Scale bars = 100 and 2 μm (inset). (A2) Stimulus evoking current (representing movement) response of the flex sensor in arbitrary units. (A3) Movement response versus stimulation amplitude. Adapted with permission under a Creative Commons Attribution 4.0 International License from ref (194). Copyright 2016 Springer Nature. (b) In vivo assessment of MRI artifacts after electrode implantation. (B1) Electrode morphology. Scale bars = 20 and 5 μm (inset). Representative three serial coronal scans from rostral (left) to caudal (right) of echo-planar images from rat brains with 3D microfibers graphene (B2) and PtIr (B3) bipolar microelectrodes (middle images depicting electrode implant sites). The numbers in each image denote the relative distance from bregma. Adapted with permission under a Creative Commons Attribution 4.0 International License from ref (201). Copyright 2020 Springer Nature. (c) Cortex electrical stimulation through microelectrocorticography electrodes and corresponding neural activity in GCaMP6f mice. (Top) Visualization of the fluorescence neural response after stimulation with a single graphene electrode site (marked with a red triangle) and a single Pt electrode site (marked with a red triangle). (Bottom) Visualization of the intensity of neural responses to 100 μA of electrical stimulation at times −130 to +670 ms of peak response with the graphene electrode array (left) and 500 μA of electrical stimulation at similar times with the Pt electrode array (right). Adapted with permission from ref (206). Copyright 2018 American Chemical Society. (d) Measurement of vascular responses to optogenetic photostimulation below graphene microelectrode arrays in Thy1-ChR2 mice. (Top) Location of diving arterioles for diameter measurements with 2-photon microscopy imaging. Yellow outlines indicate single graphene electrodes. Data were acquired after intravascular injection of FITC-dextran (2 MDa). Scale bar = 500 μm. (Bottom) Line-scan mode was used to measure time courses of single arteriole diameters. Blue arrows indicate delivery of 473 nm laser stimuli, and red lines indicate computed vessel borders used for estimation of diameter changes. Adapted with permission under a Creative Commons Attribution 4.0 International License from ref (209). Copyright 2018 Springer Nature.
Figure 7
Figure 7
Neural cells onto 2D graphene-based substrates. (a) Hippocampal neurons cultured onto 2D graphene-based substrates. Representative SEM micrographs highlighting neurons morphology after 10 days in vitro on control (glass), gold (Au), single-layer graphene (SLG), and multilayer graphene (MLG) substrates (left). Scale bars = 10 μm. Box plot summarizing the frequency values of the postsynaptic currents measured for the different substrates (right). Adapted with permission from ref (223). Copyright 2018, Springer Nature. (b) Primary mouse embryos hippocampal neurons interfacing 2D graphene- and PLL-based substrates. Immunofluorescence image of neurons grown on PLL-coated glass (glass + PLL), PLL and graphene-coated glass (Gr + PLL) and graphene-coated glass (Gr bare) at 5 days in vitro (top). Dapi (blue) and synapsin (green) labeling are superimposed. Scale bars = 100 μm. Quantitative analysis of neurons density as a function of the incubation time (bottom, left); the area fraction covered by neurons (bottom, center) and the area covered by individual neurons on pristine graphene, coated glass, and graphene samples (bottom, right). Reproduced with permission from ref (229). Copyright 2016 Elsevier.
Figure 8
Figure 8
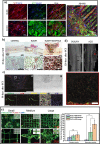
3D graphene-based scaffolds targeting TSCI. (a) Primary cortical cell growth and maturation after 8–10 days in vitro in 3D ordered graphene scaffolds (3D-OG) and 2D glass coverslip controls. Neurons were stained with β-III tubulin (TUJ1, red), astrocytes with GFAP (green), and cell nuclei with Hoechst (blue). On the right, it is possible to observe the geometric modulation of neuronal growth in vitro. The image acquired in reflection mode illustrating the 3D-OG structure was merged for proper visualization of the substrate. The part under the white line was the larger graphene skeleton supporting the whole structure, and the part above the line was the ordered graphene skeletons. Scale bars = 50 μm. Adapted with permission from ref (282). Copyright 2020 American Chemical Society. (b) 3D rGO porous scaffolds implanted at the C6 right rat hemicord at 10 days postinjury. Histological examination of the spinal cord tissue by conventional hematoxylin-van Giesson staining. Images at the bottom represent zoom-in details of areas marked with orange squares in top images. Spinal cords are oriented in all cases as indicated by the set of arrows: C–Caudal, D—Dorsal, Ro—Rostral, and V–Ventral. Scale bars = 1 mm (top) and 100 μm (bottom). Reproduced with permission from ref (283). Copyright 2015 Wiley-VCH. (c) Angiogenesis inside a 3D rGO porous scaffold at 30 days postinjury in a hemisection SCI model in rats. (A) Low-magnification view of the spinal tissue (top), blood vessels inside the scaffold structure marked with white asterisks. Zoom-in images (bottom) corresponding to the area indicated by the gray square in the top image. Mature blood vessels were detected by labeling of RECA-1 (green) and laminin from basal membranes (LAM, red). Cell nuclei were labeled with Hoechst (HOE). (B) The bright field (BF) image enables the visualization of the scaffold. Scale bars: 1 mm (top) and 100 μm (bottom). Reproduced with permission from ref (285). Copyright 2016 Elsevier. (d) Performance of a 3D rGO porous scaffold at 120 days postinjury in a hemisection SCI model in rats. MRI features of the rGO implants corresponding to coronal scans of hemisected rats without and with the rGO scaffold (top) and a representative confocal laser scanning microscopy image highlighting the impact of the scaffold on boosting neurites growth inside the scaffold (bottom). Labeling for β-III tubulin (red) and antipan-neuronal neurofilament (green) marked the cytoskeleton microtubules and neurofilaments of neuronal cells, respectively. Scale bar = 150 μm. Adapted with permission from ref (271). Copyright 2019 Elsevier. (e) PC-12 cells cultured on rGO microfibers with different diameters under electric stimulation after 14 days in vitro. Representative immunofluorescence images of the cells stained with β-III tubulin (green), F-actin (red), and DAPI (blue) at low (top) and high (bottom) magnification (left). Inset: Merged bright-field image. Scale bars: 150 μm. Quantitative analysis of average neurite numbers (right). Adapted with permission from ref (302). Copyright 2020 Wiley-VCH.

Similar articles

Cited by

References

    1. Novoselov K. S.; Geim A. K.; Morozov S. V.; Jiang D.; Zhang Y.; Dubonos S. V.; Grigorieva I. V.; Firsov A. A. Electric Field Effect in Atomically Thin Carbon Films. Science 2004, 306, 666.10.1126/science.1102896. - DOI - PubMed
    1. Girão A. F.; Serrano M. C.; Completo A.; Marques P. A. A. P. Do biomedical engineers dream of graphene sheets?. Biomater. Sci. 2019, 7, 1228–1239. 10.1039/C8BM01636D. - DOI - PubMed
    1. Geim A. K. Graphene: Status and Prospects. Science 2009, 324, 1530.10.1126/science.1158877. - DOI - PubMed
    1. Halim A.; Qu K.-Y.; Zhang X.-F.; Huang N.-P. Recent Advances in the Application of Two-Dimensional Nanomaterials for Neural Tissue Engineering and Regeneration. ACS Biomater. Sci. Eng. 2021, 7, 3503–3529. 10.1021/acsbiomaterials.1c00490. - DOI - PubMed
    1. Bierman-Duquette R. D.; Safarians G.; Huang J.; Rajput B.; Chen J. Y.; Wang Z. Z.; Seidlits S. K. Engineering Tissues of the Central Nervous System: Interfacing Conductive Biomaterials with Neural Stem/Progenitor Cells. Adv. Healthc. Mater. 2021, n/a, 2101577.10.1002/adhm.202101577. - DOI - PMC - PubMed

Publication types