. 2022 Oct 14;38(20):4771-4781.
doi: 10.1093/bioinformatics/btac578.

Predicting cross-tissue hormone-gene relations using balanced word embeddings

Affiliations

Predicting cross-tissue hormone-gene relations using balanced word embeddings

Aditya Jadhav et al. Bioinformatics. .

Abstract

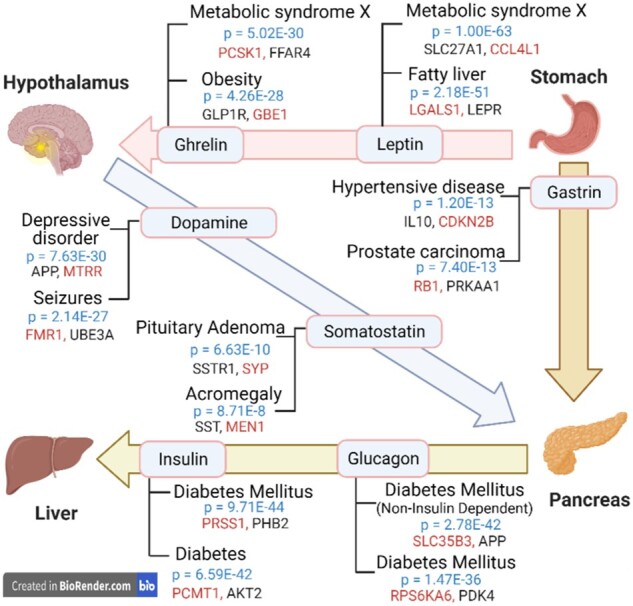
Motivation: Inter-organ/inter-tissue communication is central to multi-cellular organisms including humans, and mapping inter-tissue interactions can advance system-level whole-body modeling efforts. Large volumes of biomedical literature have fostered studies that map within-tissue or tissue-agnostic interactions, but literature-mining studies that infer inter-tissue relations, such as between hormones and genes are solely missing.

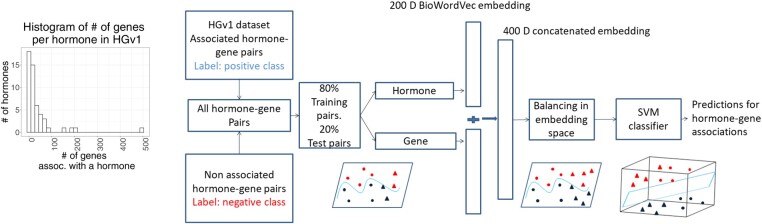
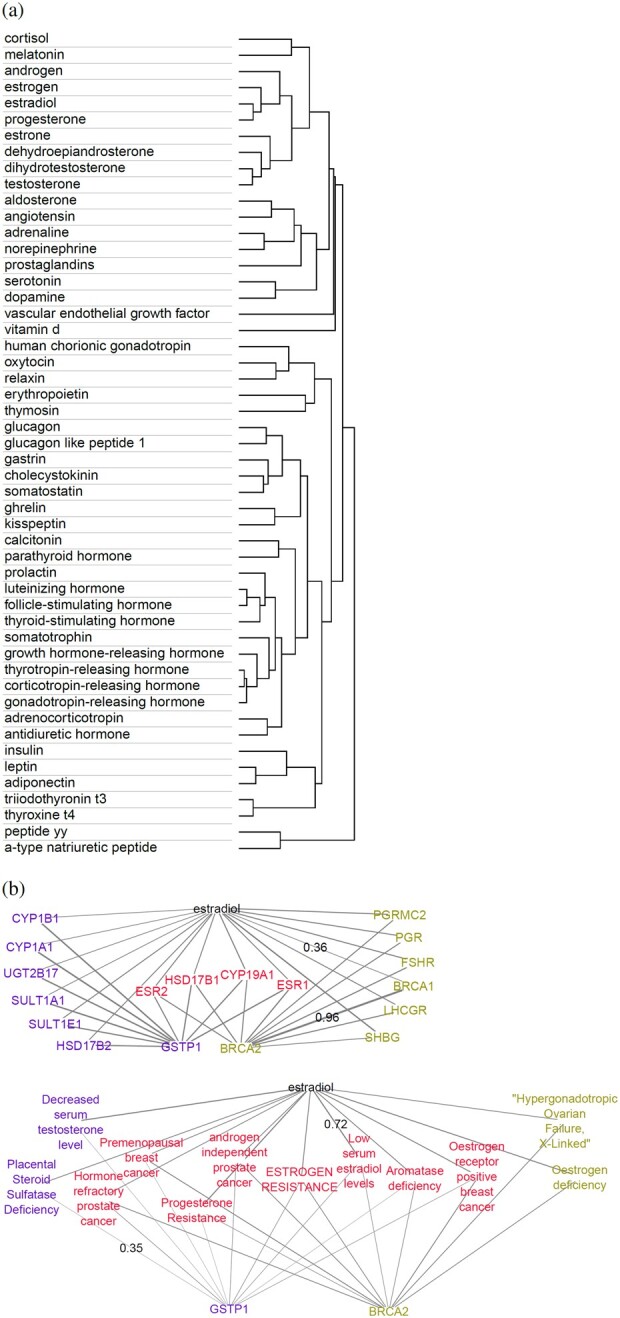
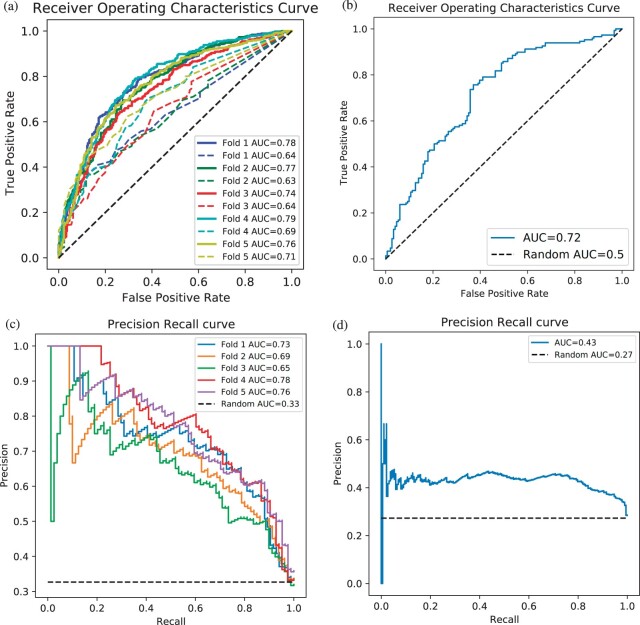
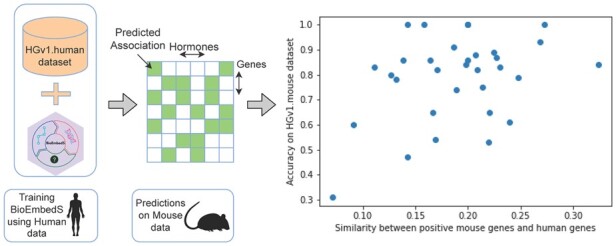
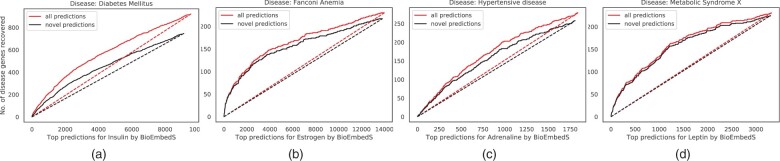
Results: We present a first study to predict from biomedical literature the hormone-gene associations mediating inter-tissue signaling in the human body. Our BioEmbedS* models use neural network-based Biomedical word Embeddings with a Support Vector Machine classifier to predict if a hormone-gene pair is associated or not, and whether an associated gene is involved in the hormone's production or response. Model training relies on our unified dataset Hormone-Gene version 1 of ground-truth associations between genes and endocrine hormones, which we compiled and carefully balanced in the embedded space to handle data disparities, such as between poorly- versus well-studied hormones. Our BioEmbedS model recapitulates known gene mediators of tissue-tissue signaling with 70.4% accuracy; predicts novel inter-tissue communication genes in humans, which are enriched for hormone-related disorders; and generalizes well to mouse, thereby holding promise for its extension to other multi-cellular organisms as well.

Availability and implementation: Freely available at https://cross-tissue-signaling.herokuapp.com are our model predictions & datasets; https://github.com/BIRDSgroup/BioEmbedS has all relevant code.

Supplementary information: Supplementary data are available at Bioinformatics online.


Figures

Fig. 1.
Fig. 1.
BioEmbedS model overview: our BioEmbedS model predicts if a hormone–gene pair is associated or not from D-dimensional word embedding vectors of the hormone name and the gene symbol. Our HGv1 dataset is crucial for systematic training/evaluation of our model, after its proper balancing to handle variability in available information for different hormones (see inset histogram; ‘assoc.’ stands for associated). In the toy-example shown, circles and triangles indicate hormone–gene pairs for two illustrative hormones; and below-the-boundary blue and above-the-boundary red symbols, respectively, denote the positive (associated) and negative (non-associated) genes for each hormone. The positive/negative classes are balanced across the two hormones, before separating them in a higher dimensional space using a SVM classifier. BioEmbedS-TS model has source and target genes for a hormone in place of positive and negative genes (A color version of this figure appears in the online version of this article.)
Fig. 2.
Fig. 2.
Similarity of hormone embeddings and hormone–gene context: (a; top) hierarchical clustering dendrogram of the 200D hormone embeddings using complete linkage method and one minus cosine similarity (cosine of the angle between two vectors) as the distance measure. (b; rest) For the predicted hormone–gene pair (estradiol—GSTP1, and estradiol—BRCA2), the gene symbols (middle) or disease terms (bottom) that exhibit cosine similarity of at least 0.35 with the predicted hormone or gene are shown. Cosine similarity is indicated proportionally by edge thickness, with maximum and minimum values shown alongside the corresponding edges
Fig. 3.
Fig. 3.
Performance of our BioEmbedS* models in different settings: (a) ROC curves of BioEmbedS (solid lines) and STRING (dashed lines) for hormone–gene predictions based on 5-fold CV. (b) ROC curve of BioEmbedS for unseen external hormones’ predictions. (c) PR curves of BioEmbedS-TS for source/target gene predictions based on 5-fold CV. (d) PR curve of BioEmbedS-TS for unseen external hormones’ predictions. AUC of a perfect classifier is one, and of a random classifier is 0.5 for ROC curves. Random classifiers are denoted by black dashed lines in these plots
Fig. 4.
Fig. 4.
Cross-species translatability of BioEmbedS: accuracy of our HGv1.human-trained BioEmbedS model on each hormone in the HGv1.mouse dataset is plotted against the Jaccard similarity between the known human and mouse gene symbols of the hormone (i.e. the hormone’s positive associated genes in the HGv1.human/mouse datasets, after converting gene symbols to lower-case)
Fig. 5.
Fig. 5.
Inter-tissue communication: example of a multi-tissue system with inter-tissue edges indicating hormonal signaling. BioEmbedS predictions for different hormones are enriched for the indicated diseases (top two are shown, along with disease enrichment P-values). Shown alongside each tissue–tissue link are examples of known disease genes that are also genes we predicted for a hormone (with darker-shade black marking the genes in HGv1 dataset, and lighter-shade red the novel out-of-HGv1 genes). The hormones shown may have other source→target tissue pairs besides the tissue pair shown here (A color version of this figure appears in the online version of this article.)
Fig. 6.
Fig. 6.
Disease enrichment in novel gene predictions: curves showing the number (no.) of known disease genes (as per DisGeNET; y-axis) recovered in top-k predicted genes (as per SVM score ranking; x-axis) of the corresponding hormone; focusing on all (lighter-shade red) versus novel (darker-shade black) predicted genes of the hormone. Our model (solid curves) performs better than chance recovery of disease genes by a random classifier (dashed lines). Only genes predicted for a hormone with SVM score>0 are considered here; all protein-coding genes are considered in Supplementary Figure S2 (A color version of this figure appears in the online version of this article.)

References

    1. Argilés J.M. et al. (2018) Inter-tissue communication in cancer cachexia. Nat. Rev. Endocrinol., 15, 9–20. - PubMed
    1. Armingol E. et al. (2021) Deciphering cell-cell interactions and communication from gene expression. Nat. Rev. Genet., 22, 71–88. - PMC - PubMed
    1. Bhasuran B., Natarajan J. (2018) Automatic extraction of gene-disease associations from literature using joint ensemble learning. PLoS One, 13, e0200699. - PMC - PubMed
    1. Bojanowski P. et al. (2017) Enriching word vectors with subword information. TACL, 5, 135–146.
    1. Braschi B. et al. (2019) Genenames.org: the HGNC and VGNC resources in 2019. Nucleic Acids Res., 47, D786–D792. - PMC - PubMed

Publication types