. 2022 Aug 24:11:e78385.
doi: 10.7554/eLife.78385.

An amphipathic helix in Brl1 is required for nuclear pore complex biogenesis in S. cerevisiae

Affiliations

An amphipathic helix in Brl1 is required for nuclear pore complex biogenesis in S. cerevisiae

Annemarie Kralt et al. Elife. .

Abstract

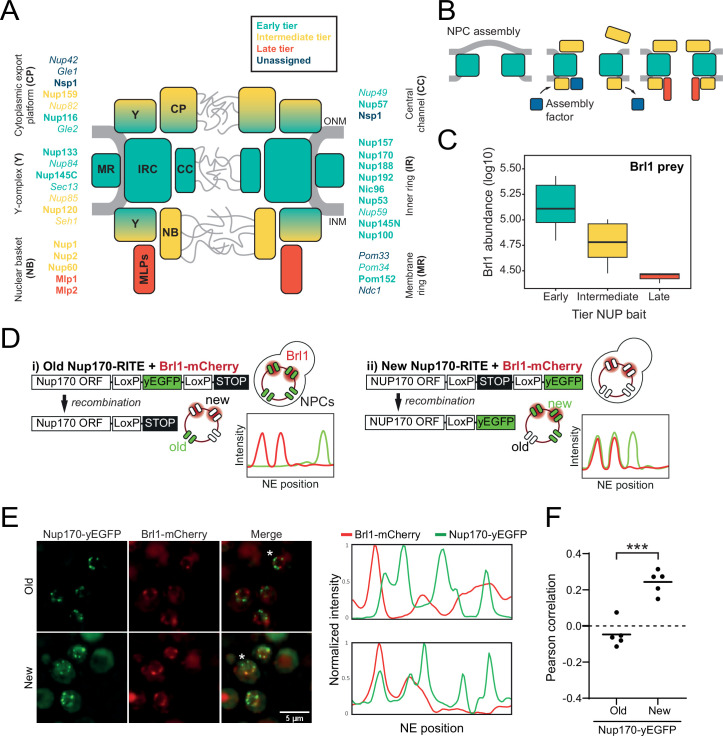
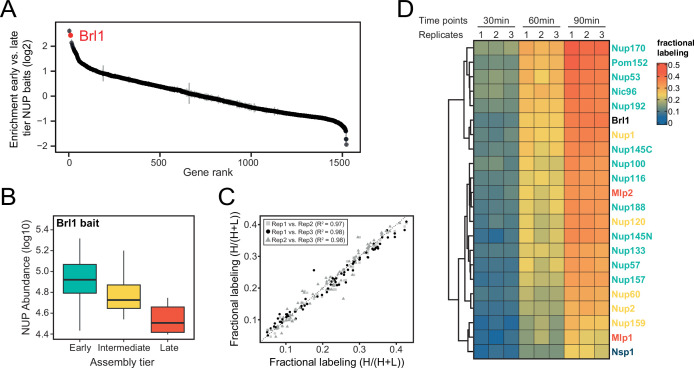
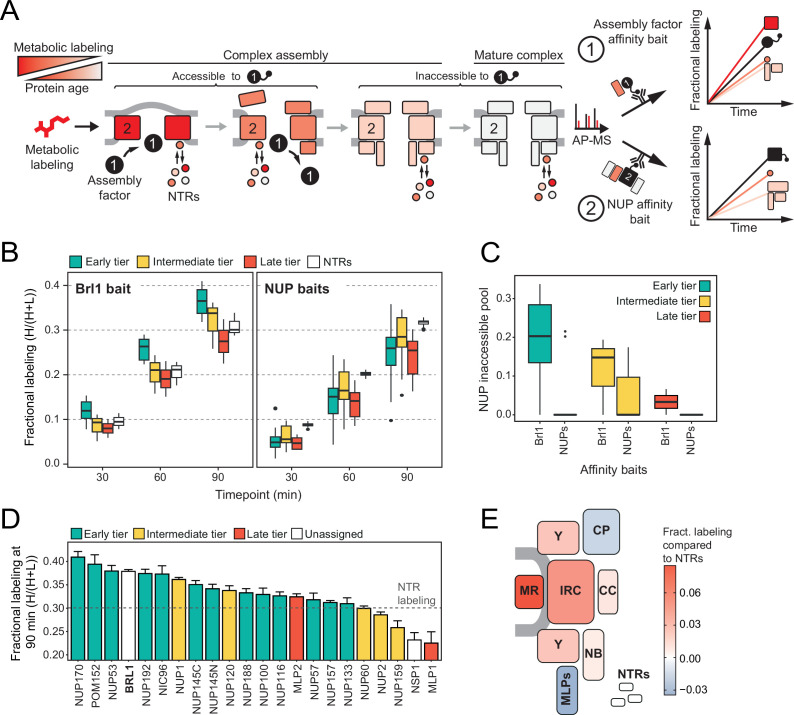
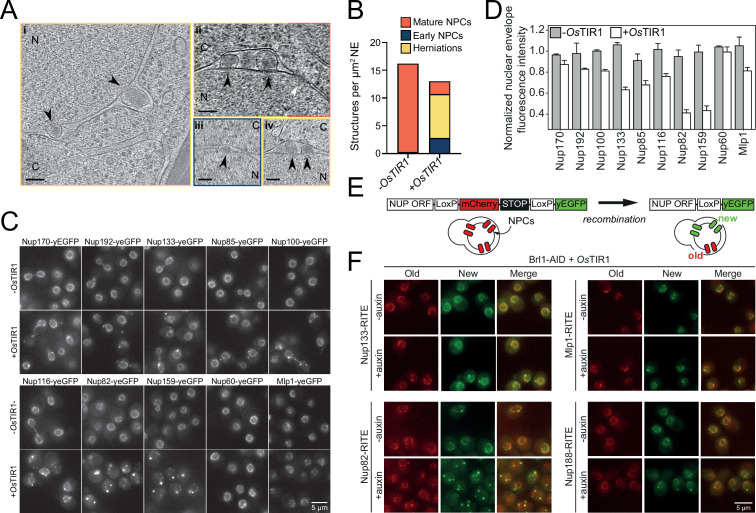
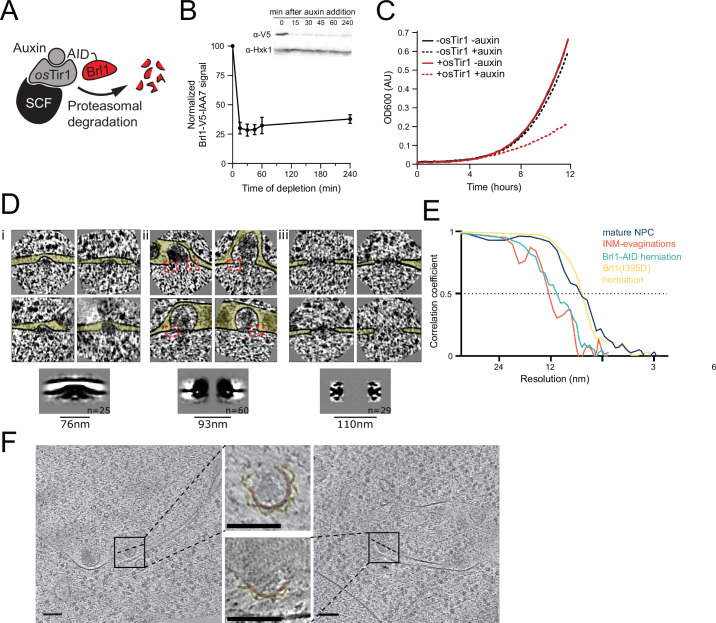
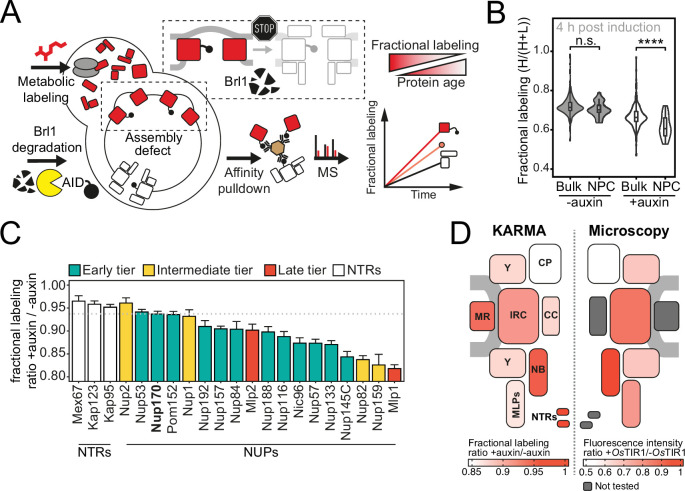
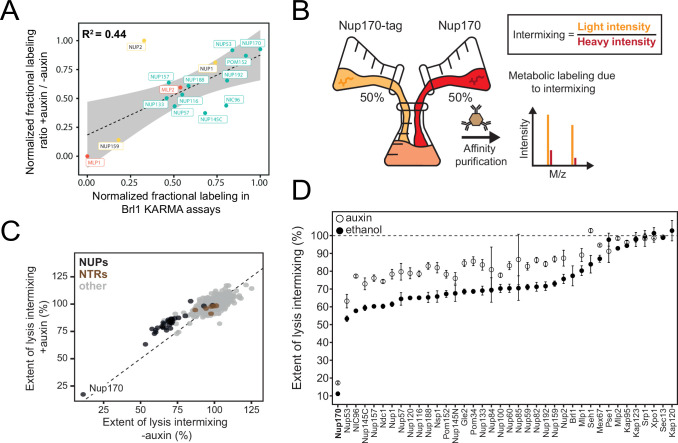
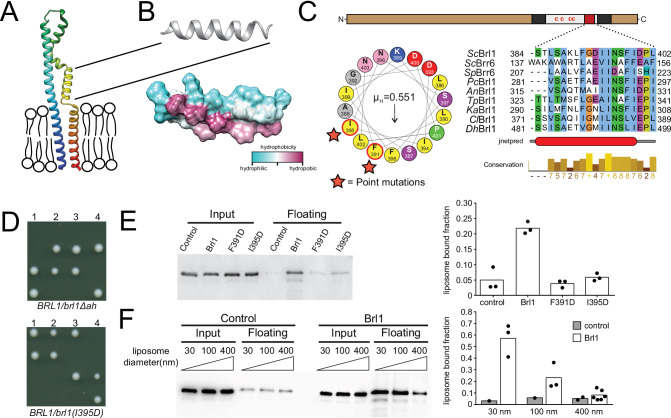
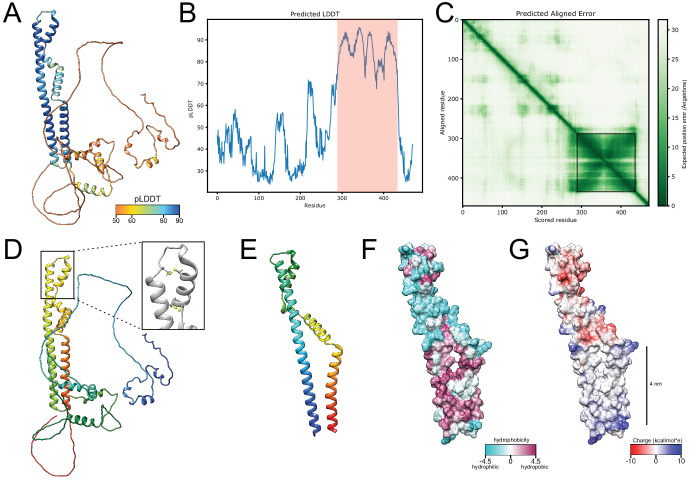
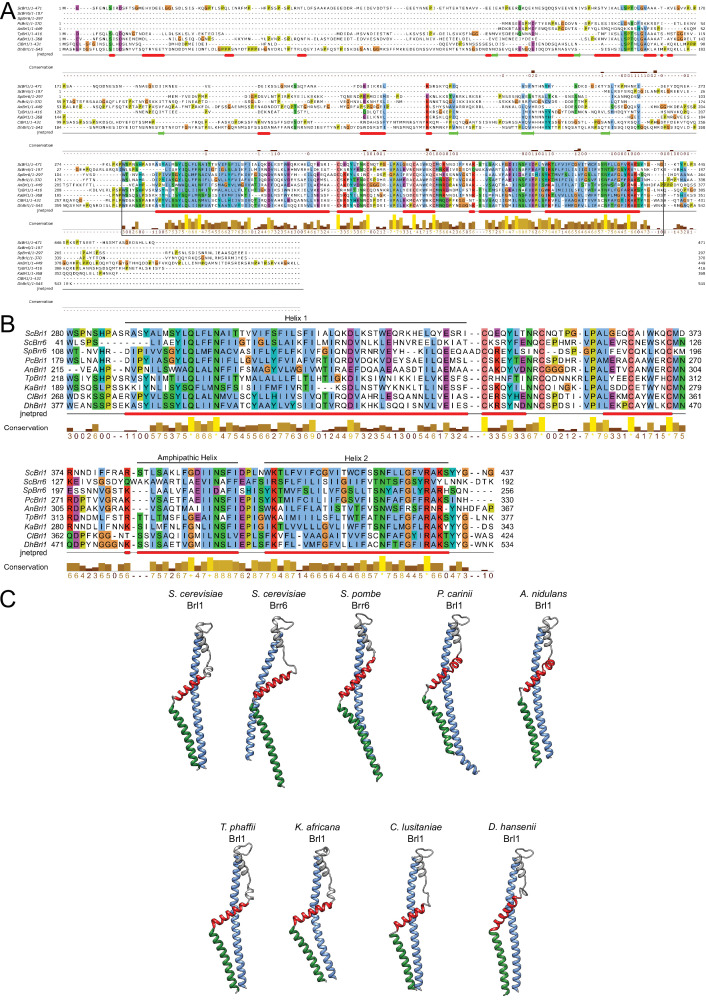
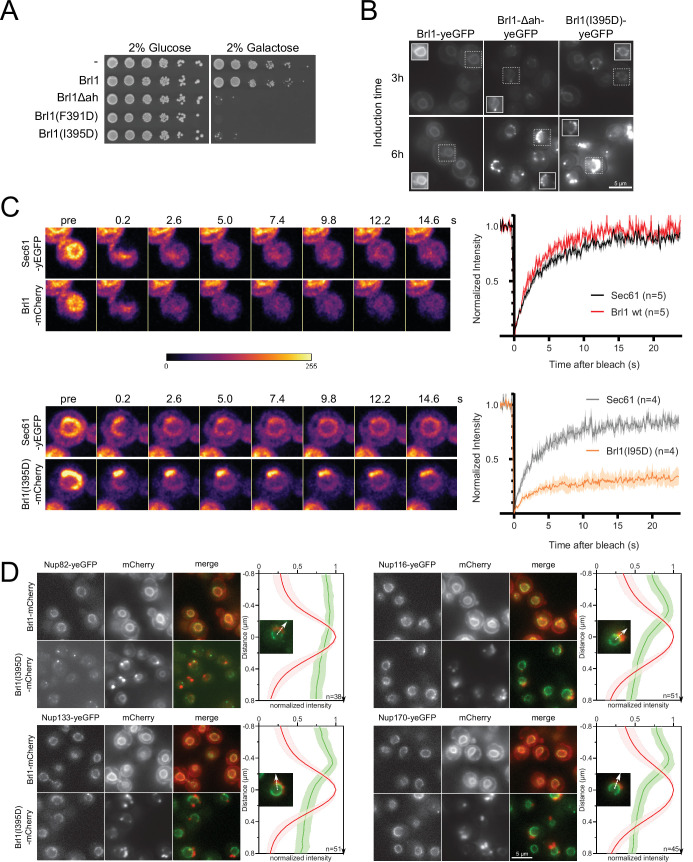
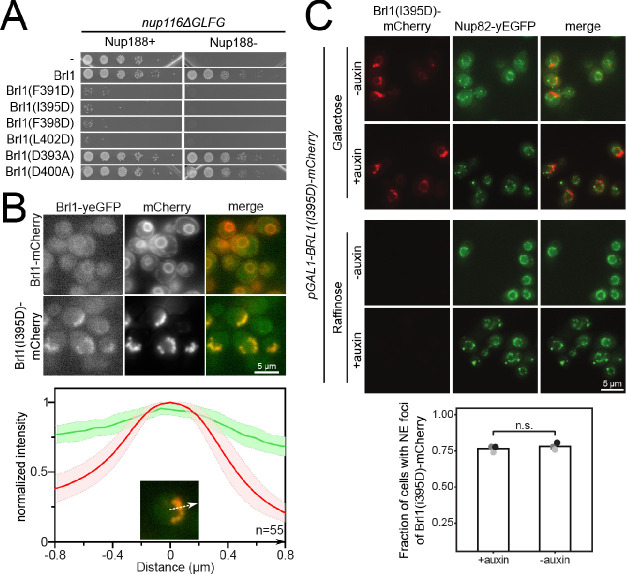
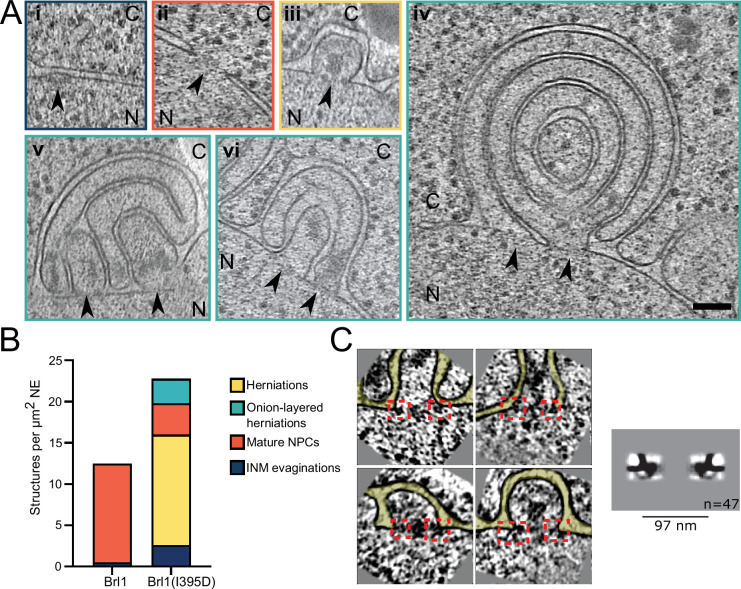
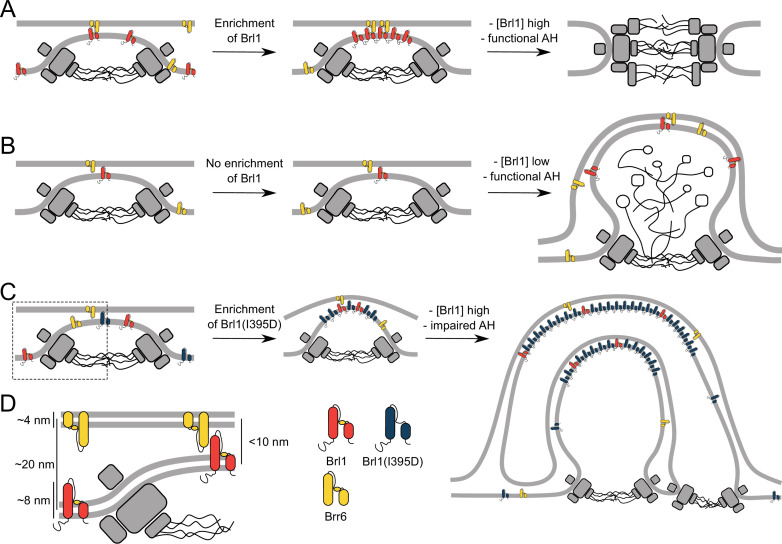
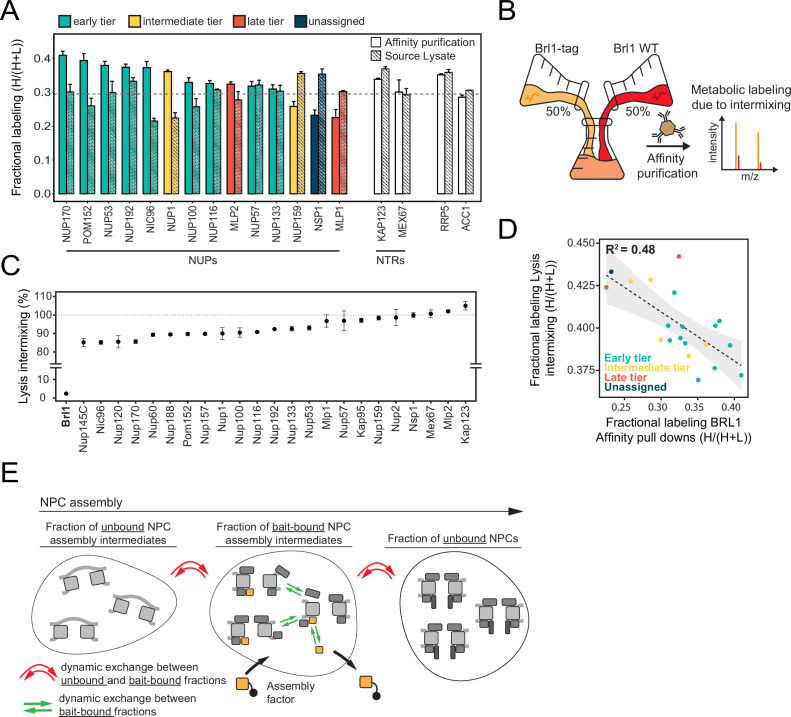
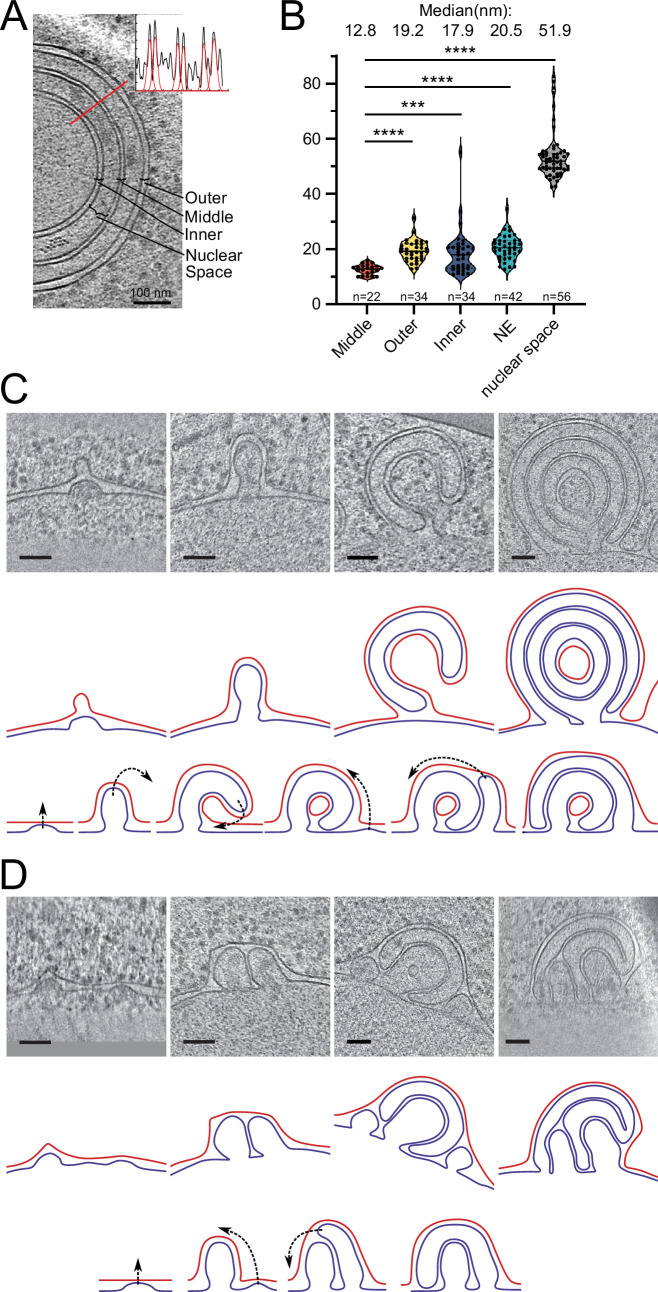
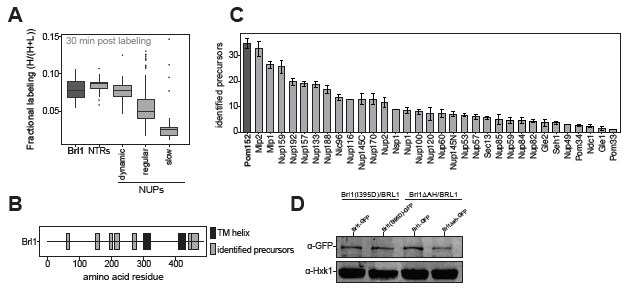
The nuclear pore complex (NPC) is the central portal for macromolecular exchange between the nucleus and cytoplasm. In all eukaryotes, NPCs assemble into an intact nuclear envelope (NE) during interphase, but the process of NPC biogenesis remains poorly characterized. Furthermore, little is known about how NPC assembly leads to the fusion of the outer and inner NE, and no factors have been identified that could trigger this event. Here, we characterize the transmembrane protein Brl1 as an NPC assembly factor required for NE fusion in budding yeast. Brl1 preferentially associates with NPC assembly intermediates and its depletion halts NPC biogenesis, leading to NE herniations that contain inner and outer ring nucleoporins but lack the cytoplasmic export platform. Furthermore, we identify an essential amphipathic helix in the luminal domain of Brl1 that mediates interactions with lipid bilayers. Mutations in this amphipathic helix lead to NPC assembly defects, and cryo-electron tomography analyses reveal multilayered herniations of the inner nuclear membrane with NPC-like structures at the neck, indicating a failure in NE fusion. Taken together, our results identify a role for Brl1 in NPC assembly and suggest a function of its amphipathic helix in mediating the fusion of the inner and outer nuclear membranes.

Keywords: S. cerevisiae; cell biology; membrane fusion; nuclear envelope; nuclear pore complex.


Conflict of interest statement

AK, MW, JF, AA, RM, ED, EN, FU, MT, WA, EO, OM, KW No competing interests declared

Figures

Figure 1.
Figure 1.. Brl1 preferentially binds young nuclear pore complexes (NPCs).
(A) Scheme of the NPC architecture. The colors indicate the assembly order as found in Onischenko et al., 2020. Nucleoporins (NUPs) that were reproducibly identified in Brl1 affinity purifications are shown in bold. (B) Schematic illustrating the transient binding of an NPC assembly factor during NPC assembly. (C) Enrichment of Brl1 in affinity pulldowns from Onischenko et al., 2020 using baits from the different assembly tiers. Early and intermediate tiers contain four different baits each; the late tier is represented by Mlp1 with three biological replicates for each bait. (D) Schematic representation of the recombination-induced tag exchange (RITE) strategy to visualize Brl1-mCherry co-localization with old or new NPCs marked by Nup170-yEGFP and the expected NE fluorescence intensity profiles. (E) Representative co-localization images of Brl1-mCherry with old or new Nup170-yEGFP marked NPCs using the RITE strategy described in (D). Cells were imaged ~30 min or ~5 hr after recombination induction, respectively. Fluorescence intensity profiles along the NE are displayed for cells denoted with an asterisk. (F) Pearson’s correlation between Nup170-yEGFP and Brl1-mCherry fluorescence intensity profiles along the NE in (E). Individual points reflect the average of a biological replicate with a minimum of 28 analyzed NE contours per condition. Two-tailed Student’s t-test (n = 5, p-value=0.00015).
Figure 1—figure supplement 1.
Figure 1—figure supplement 1.. Proteomic characterization of Brl1 nuclear pore complex (NPC) interactions.
(A) All 1500 proteins co-purified in affinity pulldowns with 10 different nucleoporin (NUP) baits (Onischenko et al., 2020) were ranked by their fold enrichment difference between early and late tier baits. Mean ± SEM of three biological replicates. (B) Log10 abundance of NUPs belonging to the different assembly tiers in Brl1 affinity pulldowns (APs). Values for three biological replicates. (C) Reproducibility of the fractional labeling in KARMA (Kinetic Analysis of Incorporation Rates in Macromolecular Assemblies) assays with Brl1. Individual points correspond to the fractional labeling of a protein. (D) Heatmap showing the fractional labeling of NUPs in KARMA assays with Brl1 bait.
Figure 2.
Figure 2.. Mapping Brl1 association with nuclear pore complex (NPC) assembly intermediates using KARMA (Kinetic Analysis of Incorporation Rates in Macromolecular Assemblies).
(A) Principles of KARMA: newly synthesized proteins are pulse-labeled followed by the affinity purification of the nucleoporin (NUP) complexes through a tagged NPC-binding protein. The extent of metabolic labeling is then quantified by mass spectrometry and corresponds to the average protein age in the affinity-purified fraction. An assembly factor selectively binds young NPCs, thus leading to high metabolic labeling rates for NUPs present in the intermediates (1). This is not the case for proteins that join after the assembly factor completely or partially dissociates or when the process is probed with an NUP bait (2). (B) Comparison of the labeling rates for NUPs and nuclear transport receptors (NTRs) in KARMA assays with Brl1 bait (left, this study) and with 10 different NUP baits (right, Onischenko et al., 2020). Median of three biological replicates. (C) Inaccessible pool of NUPs in KARMA assays with Brl1 compared to NUP baits (Onischenko et al., 2020), evaluated using a three-state kinetic state model (KSM) (Onischenko et al., 2020). (D) Barplot depicting the extent of metabolic labeling for different NUPs in KARMA assays with Brl1 bait after 90 min. The dotted line indicates the median NTR labeling. Median ± SD of three biological replicates. (E) Fractional labeling values from 2D averaged for NPC subcomplexes and offset by NTR labeling projected onto the NPC scheme.
Figure 3.
Figure 3.. Brl1 degradation interferes with nuclear pore complex (NPC) assembly.
(A) Tomographic slices of focused ion beam (FIB)-milled, 4–4.5 hr auxin-treated Brl1-AID cells showing the structures quantified in (B). Image frames colored according to the color code used in (B). Scale bar 100 nm; black arrows: herniations; white arrow: NPC; N: nucleus; C: cytoplasm; slice thickness i and iii: 1.4 nm; ii and iv: 2.8 nm. Panels i and ii were cropped from tomographic slices from the tomograms in Figure 3—videos 1 and 2. (B) Quantification of 27 tomograms (8.5 µm2 NE) and 51 (16.7 µm2 NE) for -OsTIR1 and +OsTIR1, respectively. (C) Example fluorescent micrographs of yEGFP-tagged nucleoporins (NUPs) in 4–4.5 hr auxin-treated Brl1-AID ± OsTIR1 cells. (D) Normalized fluorescence intensity signal in the nuclear envelope in ±OsTIR1 Brl1-AID cells treated with 500 µM auxin for 4–4.5 hr. Mean ± SEM of a minimum of two biological replicates. (E) Recombination-induced tag exchange (RITE) method is combined with a CRE-EBD recombinase to conditionally switch fluorescence tags upon β-estradiol addition. (F) NUP RITE fusion protein localization in the Brl1-AID background 3 hr after treating cells with auxin (+auxin) or ethanol (-auxin). Recombination was induced 30 min prior to auxin addition.
Figure 3—figure supplement 1.
Figure 3—figure supplement 1.. Characterization and subtomogram analysis of Brl1 depletion.
(A) Auxin-inducible degradation of Brl1 (Nishimura et al., 2009). Interaction between degron-tagged Brl1 and the E3 ubiquitin ligase SCF is mediated by the auxin-binding receptor OsTir1. (B) Depletion of Brl1-AID monitored by Western blotting. Brl1-V5-IAA7 was detected with an anti-V5 antibody, anti-hexokinase served as loading control. Mean ± SEM of three biological replicates. (C) Growth rate of Brl1-AID±OsTir1 cells incubated with 500 µM auxin or an equivalent amount of ethanol (-auxin). (D) Subtomograms and subtomogram averages of nuclear pore complexes (NPCs) and NPC-like structures in Brl1-depleted conditions; (i) inner nuclear membrane (INM) evaginations, (ii) nuclear envelope (NE) herniations, and (iii) mature NPCs. Diameter and number of particles are indicated. Cytoplasm is pointing up in all images. Box size of single herniations/NPCs is 270 nm. Red boxes indicate NPC-like densities at the neck of herniations. (E) Fourier shell correlation (FSC) curves for the subtomogram averages in D and Figure 7. FSC0.5 indicated as dotted line. (F) Tomographic slices of focused ion beam (FIB)-milled 4–4.5 hr auxin-treated Brl1-AID cells; slices through herniations show a luminal ring around the herniation, highlighted in yellow, NPC membrane in red; the rotation axis is indicated by a dashed line; scale bars: 100 nm; slice thickness: 1.4 nm.
Figure 4.
Figure 4.. Proteomic characterization of nuclear pore complex (NPC) assembly intermediates induced by Brl1 depletion.
(A) Depiction of the metabolic labeling assays to examine NPC assembly effects that occur upon Brl1 degradation. Newly synthesized proteins are pulse-labeled simultaneously with the auxin-induced depletion of Brl1. Mature NPCs and assembly intermediates are purified via affinity-tagged Nup170. Newly made nucleoporins (NUPs) that depend on Brl1 for their incorporation cannot be purified with Nup170, thus diminishing the extent of their metabolic labeling in Nup170 affinity pulldown (AP) after Brl1 depletion. (B) Fractional labeling of bulk proteins compared to NUPs in KARMA (Kinetic Analysis of Incorporation Rates in Macromolecular Assemblies) assays with affinity-tagged Nup170 in Brl1-AID cells treated with auxin (+auxin) or ethanol (-auxin) for 4 hr. Data points correspond to the median values in three biological replicates. Two-tailed Student’s t-test (p-value: n.s. >0.05 and ****<0.0001). (C) Fractional labeling ratio of NUPs (bars) and bulk proteins (dotted line) in Nup170 APs from Brl1-AID cells treated with auxin (+auxin) or ethanol (-auxin). Mean ± SEM of three biological replicates and three time points (4, 4.5, and 5 hr post treatment, n = 9). Mlp1 and Mlp2 are missing in one replicate of the 4.5 time point (n = 8). (D) Left: fractional labeling ratios from (C) averaged per subcomplex and projected onto the NPC schematic. Right: nuclear envelope fluorescence intensity signal ratio from Figure 3D averaged for NPC subcomplexes and projected onto the NPC schematic.
Figure 4—figure supplement 1.
Figure 4—figure supplement 1.. Exchange rates of nuclear pore complex (NPC) assembly intermediates in Brl1-depleted cells.
(A) Correlation between normalized nucleoporin (NUP) fractional labeling observed in Brl1 KARMA (Kinetic Analysis of Incorporation Rates in Macromolecular Assemblies) assays with the normalized fractional labeling ratios in Nup170 affinity pulldown (AP) from Brl1-AID cells with auxin or ethanol treatment. (B) Lysate intermixing assay to test the extent of dynamic exchange during the AP procedure. Brl1-AID cells are either treated with auxin or ethanol for 5 hr, then equal fractions of cell culture expressing tagged Nup170, grown in light lysine medium and wildtype culture grown in metabolic labeled medium were subjected to the AP procedure. (C) Intermixing of NUPs (black) and nuclear transport receptors (NTRs) (brown) along with other co-purified proteins (gray) with auxin (+auxin) or ethanol (-auxin) treatment. Values are normalized to the mean intermixing of all co-purified non-NUP proteins in a sample (=100%). Median of three biological replicates. (D) Intermixing extent for NUPs and NTRs in Nup170 APs in Brl1-AID cells treated with auxin (white) or ethanol (black). Normalized as in Figure 3C. Median ± SD of three biological replicates.
Figure 5.
Figure 5.. A conserved luminal amphipathic helix binds to membranes and is essential for Brl1 function.
(A) AlphaFold prediction for Brl1 (Jumper et al., 2021). Unstructured termini are not shown; blue: N-terminus; red: C-terminus. Transmembrane domain highlighted by the lipid bilayer. (B) Predicted amphipathic helix in ribbon and surface representation, colored based on hydrophobicity. (C) Upper panel: domain architecture of Brl1: extraluminal N- and C-terminus in brown, transmembrane domains in dark gray, amphipathic helix in red; left panel: helical wheel representation of the amphipathic helix of Brl1 and the hydrophobic moment determined with HeliQuest (Gautier et al., 2008). Point mutants are indicated by stars. Right panel: conservation and secondary structure prediction of the amphipathic helix in different fungi (full alignment in Figure 5—figure supplement 2A and B). Hydrophobic: blue; negative: magenta; polar: green; glycine: orange; proline: yellow; unconserved: white. Jnetpred4 secondary structure prediction (Drozdetskiy et al., 2015): helices are marked as red tubes. Sc: Saccharomyces cerevisiae; Sp: Schizosaccharomyces pombe; Pc: Pneumocystis carinii; An: Aspergillus nidulans; Tp: Tetrapisispora phaffii; Ka: Kazachstania africana; Cl: Clavispora lusitaniae; Dh: Debaryomyces hansenii. (D) Vertically oriented tetrad offspring of heterozygous Brl1 mutants carrying one allele lacking the amphipathic helix (brl1Δah) or a single-point mutation in the hydrophobic side of the helix (brl1(I395D)). (E) Membrane flotation assay with purified MBP-ahBrl1(377-406)-yEGFP fusion proteins and liposomes made of E. coli polar lipids extract. Control: MBP-yeGFP. Mean of three biological replicates, individual data points are indicated. (F) Membrane flotation assay with purified MBP-ahBrl1(377-406)-yEGFP fusion using liposomes of different sizes. Control: MBP-yeGFP. Mean of three or six biological replicates for MBP-ahBrl1(377-406)-yEGFP, individual data points are indicated.
Figure 5—figure supplement 1.
Figure 5—figure supplement 1.. AlphaFold structure prediction for Brl1.
(A) Predicted structure for full-length Brl1 using AlphaFold2, colored based on the predicted local distance difference test score (pLDDT). (B) pLDDT score for Brl1. High-confidence region shown in (E-G) and Figure 5 indicated by the red area. (C) Predicted aligned error for Brl1, dark green area indicates high inter-domain accuracy. High-accuracy region shown in (E-G) and Figure 5 is highlighted by the black frame. (D) Predicted structure for Brl1, colored in rainbow (red: C-terminus; blue: N-terminus); inset shows the position of the four cysteines in the luminal domain of Brl1. (E) Predicted structure for high-confidence region Brl1(289-434) in rainbow coloring (red: C-terminus; blue: N-terminus). (F, G) Surface representation of Brl1(289-434), colored by hydrophobicity (Kyte–Doolittle scale) (F) and charge (G).
Figure 5—figure supplement 2.
Figure 5—figure supplement 2.. Conservation and structure prediction of Brl1 homologues in different fungi.
(A) Sequence alignment of full-length Brl1 homologues, black box indicates the zoom-in in panel. (B) Hydrophobic: blue, negative: magenta, red: positive polar: green, glycine: orange, proline: yellow, unconserved: white. Jnetpred4 secondary structure prediction (Drozdetskiy et al., 2015): helices are marked as red tubes. Sc: Saccharomyces cerevisiae; Sp: Schizosaccharomyces pombe; Pc: Pneumocystis carinii; An: Aspergillus nidulans; Tp: Tetrapisispora phaffii; Ka: Kazachstania africana; Cl: Clavispora lusitaniae; Dh: Debaryomyces hansenii. (C) AlphaFold structure prediction for Brl1 homologues. The mostly unstructured N- and C-termini were removed for clarity. Blue: helix 1; red: amphipathic helix; green: helix 2 (regions also indicated in panel B).
Figure 6.
Figure 6.. Overexpression of Brl1(I395D) with an impaired amphipathic helix interferes with nuclear pore complex (NPC) assembly.
(A) Spotting assay of wildtype cells expressing Brl1, Brl1Δah, or Brl1(I395D) from the GAL1 promoter in glucose or galactose-containing medium. (B) Localization of yEGFP-tagged Brl1, Brl1Δah, or Brl1(I395D) from the GAL1 promoter in SD 2% galactose. Brightness contrast settings of nuclei in insets are adjusted differently. (C) Fluorescence recovery after photobleaching of Sec61-yEGFP, Brl1-mCherry and Brl1(I395D)-mCherry. Left panels: representative images of recovery; right: corresponding averaged recovery curves (n > 4). One representative experiment of three biological replicates is shown. Images are shown in pseudocolor. (D) Co-localization of mCherry-tagged Brl1 or Brl1(I395D) and yEGFP-tagged NUPs: mCherry channel is scaled differently between images. Maximum intensity plots of nucleoporins (NUPs) (green lines) relative to maximum Brl1(I395D)-mCherry signal in nuclear envelope (NE) foci (red line) from cytoplasm (bottom) to nucleoplasm (top). The arrows in the inset and the x-axis indicate the direction of measurement. Average and standard deviation of more than 38 line plots with n > 31 values averaged for each point. A representative image used for the analysis is shown for each condition in the inset.
Figure 6—figure supplement 1.
Figure 6—figure supplement 1.. Luminal amphipathic helix (AH) of Brl1 is involved in nuclear pore complex (NPC) biogenesis.
(A) Spotting assay of fivefold serial dilutions of nup116ΔGLFG PMET3-NUP188 cells expressing various ahBrl1 domain mutants from the GAL1 promoter. (B) Co-localization of mCherry-tagged Brl1 or Brl1(I395D) expressed from a galactose-inducible promoter with endogenously tagged Brl1-yEGFP. Lower panel: maximum intensity plots of Brl1 (green line) relative to maximum Brl1(I395D)-mCherry signal in nuclear envelope (NE) foci (red line) from nucleoplasm (left) to cytoplasm (right). Average and standard deviation for 55 line plots, every point is an average of n > 30 values. A representative image used for analysis is shown in the inset. The arrows in the inset and the x-axis indicate the direction of measurement. (C) Brl1(I395D)-mCherry under the control of a galactose promoter was overexpressed by switching cells to a medium containing 2% galactose simultaneously with the auxin-induced degradation of endogenous Brl1 (+auxin) or the treatment with ethanol (-auxin). Cells were imaged 6 hr after induction. Lower panel: quantification of the fraction of cells with at least one NE focus of Brl1(I395D) in cells overexpressing Brl1(I395D)-mCherry. Three biological replicates (points) with a minimum of 637 cells per replicate and their mean (bar) are shown. Two-tailed Student’s t-test (n = 3, p-value = n.s.).
Figure 7.
Figure 7.. Brl1(I395D) overexpression leads to the formation of multilayered nuclear envelope (NE) herniations.
(A) Tomographic slices of the nuclear pore complex (NPC)-like structures quantified in (B), observed in focused ion beam (FIB)-milled cells overexpressing Brl1(I395D), scale bar: 100 nm. N: nucleus, C: cytoplasm, slice thickness: 2.1 nm, arrows indicate NPC-like structures. Image frames colored according to the color code used in (B). Panels iv and vi are tomographic slices from the tomogram in Figure 7—video 1. (B) Quantification of observed structures in Brl1(I395D) cells and control condition; 17 (5.1 µm2 NE) and 50 (9.8 µm2 NE) tomograms were quantified for cells overexpressing Brl1 or Brl1(I395D), respectively. (C) Single subtomograms and the subtomogram average of 47 herniations in Brl1(I395D) overexpressing cells; box size of subtomograms is 270 nm; cytoplasm is at the top in each image. Red boxes indicate NPC-like densities at the neck of herniations.
Figure 8.
Figure 8.. The role of Brl1 during nuclear pore complex (NPC) assembly.
(A) Brl1 (red) enriches on the inside of NPC maturation intermediates and promotes inner nuclear membrane–outer nuclear membrane (INM-ONM) fusion through the membrane-binding amphipathic helix (AH) motif and likely in cooperation with Brr6 (yellow). (B) If Brl1 cannot reach the critical concentration required to promote membrane fusion, unresolved nuclear envelope (NE) herniations, filled with electron-dense material, appear. (C) Overexpressed Brl1(I395D) with a perturbed AH (blue) concentrates at the NPC assembly site. It remodels the NE membranes and leads to expanded multilayered herniations but ultimately fails to induce membrane fusion. (D) Brl1 at the INM can only physically interact with Brr6 or Brl1 at the ONM when the NE leaflets approach as it is the case at NPC assembly sites. Dimensions based on our cryo-electron tomography (cryo-ET) data (Figure 3—figure supplement 1D), structure prediction (Figure 5—figure supplement 1), and measurements of the NE (Appendix 1—figure 2B).
Appendix 1—figure 1.
Appendix 1—figure 1.. Control of protein labeling in KARMA (Kinetic Analysis of Incorporation Rates in Macromolecular Assemblies) assays.
(A) Fractional labeling of nucleoporins (NUPs) and nuclear transport receptors (NTRs) in KARMA assays with Brl1 bait and the respective source lysate, 90 min after labeling onset. Median ± SD of three biological replicates. (B) Experiment to test the intermixing dynamics. Equal fractions of an unlabeled Brl1 affinity-tagged strain and a wildtype culture grown in metabolically labeled medium were subjected to the affinity purification procedure. (C) Percentage of intermixing for NUPs and NTRs normalized to the mean of all co-purified proteins with Brl1 bait. Median ± SD of three biological replicates. (D) Correlation of NUPs between fractional labeling in the intermixing experiment and in KARMA assay with Brl1 bait. Coloring according to the assembly tier. Median of three biological replicates each. (E) During complex assembly, proteins can dynamically exchange within the bait-bound fraction (green arrows) or between the bait-bound and unbound fractions (red arrows). The metabolic labeling in KARMA assays is only sensitive to dynamic exchange between bait-bound fractions and unbound fractions, whereas in the lysate intermixing assays both forms of exchange contribute to the observed labeling.
Appendix 1—figure 2.
Appendix 1—figure 2.. Potential maturation processes of onion-like herniations.
(A) Tomographic slice of an onion-like herniation and an example line plot with fitted Gaussians measured at the indicated red line. Brackets indicate how the distances were classified for the plot in B. (B) Violin plot with individual points of membrane–membrane distances. Mann–Whitney test, ****p-value<0.0001; ***p-value=0.0001. (C) Mode 1 for maturation of onion-like herniations. Top panel: tomographic slices of several stages of herniations in Brl1(I395D) overexpressing cells (nucleus always in the bottom); middle panel: membrane segmentation of the herniations of the upper panel. Inner nuclear membrane (INM): blue; outer nuclear membrane (ONM): red; ONM in the center of the very right panel was classified as ONM based on the presence of ribosomes and wider membrane spacing. Lower panel: schematic of how the onion-like herniations mature. (D) Same as (C) but for mode 2 of the maturation process of onion-like herniations. Scale bar: 100 nm. Slice thickness: 1.4 nm.
Author response image 1.

Similar articles

Cited by

References

    1. Akey CW, Singh D, Ouch C, Echeverria I, Nudelman I, Varberg JM, Yu Z, Fang F, Shi Y, Wang J, Salzberg D, Song K, Xu C, Gumbart JC, Suslov S, Unruh J, Jaspersen SL, Chait BT, Sali A, Fernandez-Martinez J, Ludtke SJ, Villa E, Rout MP. Comprehensive structure and functional adaptations of the yeast nuclear pore complex. Cell. 2022;185:361–378. doi: 10.1016/j.cell.2021.12.015. - DOI - PMC - PubMed
    1. Alber F, Dokudovskaya S, Veenhoff LM, Zhang W, Kipper J, Devos D, Suprapto A, Karni-Schmidt O, Williams R, Chait BT, Rout MP, Sali A. Determining the architectures of macromolecular assemblies. Nature. 2007;450:683–694. doi: 10.1038/nature06404. - DOI - PubMed
    1. Allegretti M, Zimmerli CE, Rantos V, Wilfling F, Ronchi P, Fung HKH, Lee C-W, Hagen W, Turoňová B, Karius K, Börmel M, Zhang X, Müller CW, Schwab Y, Mahamid J, Pfander B, Kosinski J, Beck M. In-cell architecture of the nuclear pore and snapshots of its turnover. Nature. 2020;586:796–800. doi: 10.1038/s41586-020-2670-5. - DOI - PubMed
    1. Bancaud A, Huet S, Rabut G, Ellenberg J. Fluorescence perturbation techniques to study mobility and molecular dynamics of proteins in live cells: FRAP, photoactivation, photoconversion, and FLIP. Cold Spring Harbor Protocols. 2010;2010:top90. doi: 10.1101/pdb.top90. - DOI - PubMed
    1. Bevis BJ, Glick BS. Rapidly maturing variants of the Discosoma red fluorescent protein (DsRed) Nature Biotechnology. 2002;20:83–87. doi: 10.1038/nbt0102-83. - DOI - PubMed

Publication types

MeSH terms

Substances