. 2022 Nov 2;12(11):2586-2605.
doi: 10.1158/2159-8290.CD-22-0200.

Proteogenomic Markers of Chemotherapy Resistance and Response in Triple-Negative Breast Cancer

Affiliations

Proteogenomic Markers of Chemotherapy Resistance and Response in Triple-Negative Breast Cancer

Meenakshi Anurag et al. Cancer Discov. .

Abstract

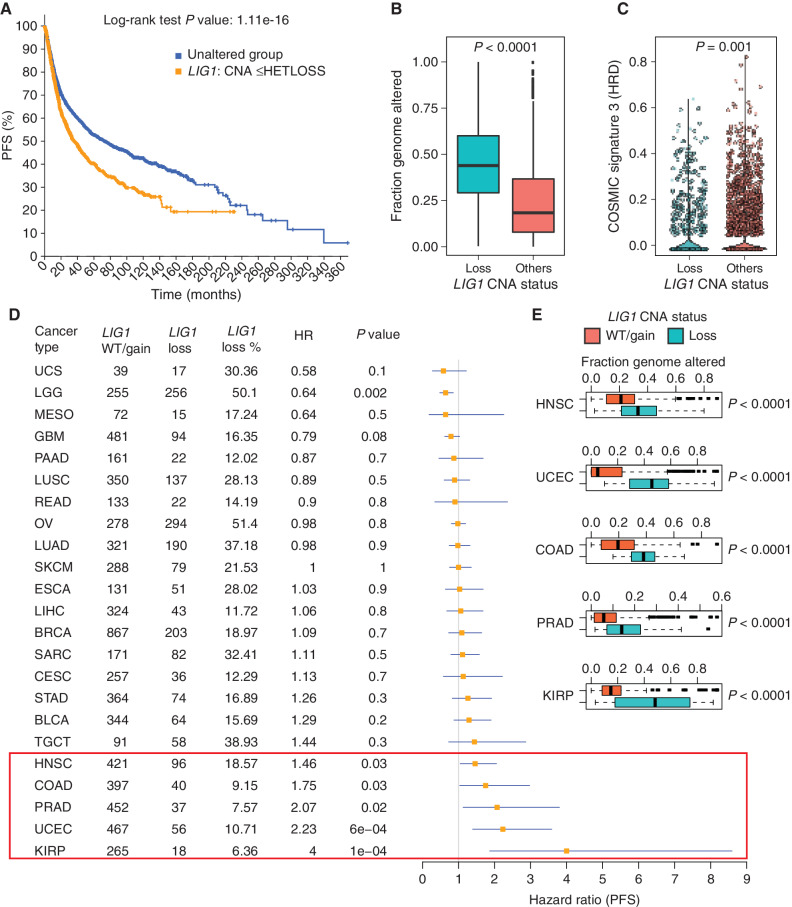
Microscaled proteogenomics was deployed to probe the molecular basis for differential response to neoadjuvant carboplatin and docetaxel combination chemotherapy for triple-negative breast cancer (TNBC). Proteomic analyses of pretreatment patient biopsies uniquely revealed metabolic pathways, including oxidative phosphorylation, adipogenesis, and fatty acid metabolism, that were associated with resistance. Both proteomics and transcriptomics revealed that sensitivity was marked by elevation of DNA repair, E2F targets, G2-M checkpoint, interferon-gamma signaling, and immune-checkpoint components. Proteogenomic analyses of somatic copy-number aberrations identified a resistance-associated 19q13.31-33 deletion where LIG1, POLD1, and XRCC1 are located. In orthogonal datasets, LIG1 (DNA ligase I) gene deletion and/or low mRNA expression levels were associated with lack of pathologic complete response, higher chromosomal instability index (CIN), and poor prognosis in TNBC, as well as carboplatin-selective resistance in TNBC preclinical models. Hemizygous loss of LIG1 was also associated with higher CIN and poor prognosis in other cancer types, demonstrating broader clinical implications.

Significance: Proteogenomic analysis of triple-negative breast tumors revealed a complex landscape of chemotherapy response associations, including a 19q13.31-33 somatic deletion encoding genes serving lagging-strand DNA synthesis (LIG1, POLD1, and XRCC1), that correlate with lack of pathologic response, carboplatin-selective resistance, and, in pan-cancer studies, poor prognosis and CIN. This article is highlighted in the In This Issue feature, p. 2483.


Figures

Figure 1. TNBC patient sample overview. A, REMARK diagram showing pre- and on-treatment sample accrual schema from patients with TNBC enrolled in two clinical trials [NCT02544987 (BCM) and NCT201404107 (WashU)] and treated with carboplatin and docetaxel in the neoadjuvant setting. *, <45% samples were later excluded from the analysis based on evidence from data quality control. B, Overview of available omics datasets from 59 patients (22 tumors with pCR and 37 tumors without pCR). Pathogenic BRCA1/2 and PALB2 mutation status, RCB, and patient race are indicated via color-coded annotation tracks. C, Venn diagram showing the overlap of gene IDs detected across multiple analytes and omics data profiled. SCNA, somatic copy-number alteration. D, Hallmark metabolism pathways are induced by chemotherapy exclusively at the protein level. Scatter plot shows signed −log10 FDR from GSEA using the signed (by direction of change) −log10 P values from paired Wilcoxon signed rank tests comparing RNA (x-axis) and protein levels (y-axis) for on-treatment (cycle 1, day 3) samples to matching baseline samples (n = 14).E, MSigDB Hallmark metabolism pathways are elevated in baseline non-pCR tumors at the protein level, whereas immune and cell-cycle pathways are elevated in baseline pCR tumors at both RNA and protein levels. Scatter plot shows the signed −log10 FDR values from GSEA using ranked lists of signed (by direction of change) −log10 P values from Wilcoxon rank sum tests comparing RNA (x-axis) and protein (y-axis) levels in non-pCR tumors to pCR tumors. F, Cell-cycle kinase targets and PTM-SigDB phosphosites associated with genotoxic stress are enriched in pCR tumors relative to non-pCR tumors at baseline. Volcano plot shows results from PTM-SEA using the signed −log10 P values from Wilcoxon rank sum tests comparing phosphosite levels in non-pCR tumors to pCR tumors. Red and blue dots indicate significant (FDR <0.05) posttranslational modification signatures.
Figure 1.
TNBC patient sample overview. A, REMARK diagram showing pre- and on-treatment sample accrual schema from patients with TNBC enrolled in two clinical trials [NCT02544987 (BCM) and NCT201404107 (WashU)] and treated with carboplatin and docetaxel in the neoadjuvant setting. *, <45% samples were later excluded from the analysis based on evidence from data quality control. B, Overview of available omics datasets from 59 patients (22 tumors with pCR and 37 tumors without pCR). Pathogenic BRCA1/2 and PALB2 mutation status, RCB, and patient race are indicated via color-coded annotation tracks. C, Venn diagram showing the overlap of gene IDs detected across multiple analytes and omics data profiled. SCNA, somatic copy-number alteration. D, Hallmark metabolism pathways are induced by chemotherapy exclusively at the protein level. Scatter plot shows signed −log10 FDR from GSEA using the signed (by direction of change) −log10P values from paired Wilcoxon signed rank tests comparing RNA (x-axis) and protein levels (y-axis) for on-treatment (cycle 1, day 3) samples to matching baseline samples (n = 14).E, MSigDB Hallmark metabolism pathways are elevated in baseline non-pCR tumors at the protein level, whereas immune and cell-cycle pathways are elevated in baseline pCR tumors at both RNA and protein levels. Scatter plot shows the signed −log10 FDR values from GSEA using ranked lists of signed (by direction of change) −log10P values from Wilcoxon rank sum tests comparing RNA (x-axis) and protein (y-axis) levels in non-pCR tumors to pCR tumors. F, Cell-cycle kinase targets and PTM-SigDB phosphosites associated with genotoxic stress are enriched in pCR tumors relative to non-pCR tumors at baseline. Volcano plot shows results from PTM-SEA using the signed −log10P values from Wilcoxon rank sum tests comparing phosphosite levels in non-pCR tumors to pCR tumors. Red and blue dots indicate significant (FDR <0.05) posttranslational modification signatures.
Figure 2. Proteogenomic features associated with the immune microenvironment are elevated in pCR tumors relative to non-pCR tumors. A, Heat map shows protein-based Hallmark ssGSEA scores, protein-based immune modulator scores, RNA-based immune profiles, and proteogenomic features for immune-checkpoint genes that are targets of FDA-approved inhibitors. Within each group (pCR and non-pCR), samples are ordered by increasing immune stimulatory score. *, P < 0.05 by the Wilcoxon rank sum test comparing non-pCR with pCR tumors. NA, not available. B, The protein-based immune stimulatory score is significantly higher in pCR tumors than in non-pCR tumors (P = 0.01, Wilcoxon rank sum test). Box plots show interquartile range (IQR) with the median marked in the center. Whiskers indicate 1.5× IQR. C, The immune stimulatory score is negatively correlated to CIN (Spearman rho = −0.612, P = 6.2e−6). The scatter plot shows immune stimulatory score on the x-axis and CIN on the y-axis.D and E, Scatter plots showing the Pearson correlation between PD-L1 IHC levels with PD-L1 protein (D) and phosphoprotein levels (E). pCR cases are shown in green and non-pCR in orange.
Figure 2.
Proteogenomic features associated with the immune microenvironment are elevated in pCR tumors relative to non-pCR tumors. A, Heat map shows protein-based Hallmark ssGSEA scores, protein-based immune modulator scores, RNA-based immune profiles, and proteogenomic features for immune-checkpoint genes that are targets of FDA-approved inhibitors. Within each group (pCR and non-pCR), samples are ordered by increasing immune stimulatory score. *, P < 0.05 by the Wilcoxon rank sum test comparing non-pCR with pCR tumors. NA, not available. B, The protein-based immune stimulatory score is significantly higher in pCR tumors than in non-pCR tumors (P = 0.01, Wilcoxon rank sum test). Box plots show interquartile range (IQR) with the median marked in the center. Whiskers indicate 1.5× IQR. C, The immune stimulatory score is negatively correlated to CIN (Spearman rho = −0.612, P = 6.2e−6). The scatter plot shows immune stimulatory score on the x-axis and CIN on the y-axis.D and E, Scatter plots showing the Pearson correlation between PD-L1 IHC levels with PD-L1 protein (D) and phosphoprotein levels (E). pCR cases are shown in green and non-pCR in orange.
Figure 3. Proteogenomic features associated with the lack of pCR in TNBC tumors. A, Heat map showing ssGSEA normalized enrichment score for metabolic Hallmark pathways that are significantly higher in non-pCR cases, arranged by RCB 0 (pCR) and RCB I/II/III (non-pCR). Shown are the four pathways that showed significant enrichment at either the RNA or protein level in Fig. 1E. Single-sample pathway enrichment scores were assessed at the level of mRNA (yellow), protein (blue), and phosphoprotein (red). The Wilcoxon rank sum test was used to compare scores for non-pCR vs. pCR scores; *, P < 0.05. NA, not available. B, Membership of differentially regulated proteins to pathways highlighted in A. Proteins (rows) belonging to a given pathway (columns) are shown in light green. The differential expression (DE) at protein and mRNA levels for each gene along with mRNA–protein correlation scores are shown as signed −log10 P value (signedp). C, A multiomics metabolic gene signature derived for genes that are correlated at mRNA and protein levels was further investigated in patients treated with carboplatin and paclitaxel in the BrighTNess clinical trial (treatment arms A and B) for which RNA-seq data were available. The mean mRNA expression score for this signature was significantly higher in higher RCB tumors.
Figure 3.
Proteogenomic features associated with the lack of pCR in TNBC tumors. A, Heat map showing ssGSEA normalized enrichment score for metabolic Hallmark pathways that are significantly higher in non-pCR cases, arranged by RCB 0 (pCR) and RCB I/II/III (non-pCR). Shown are the four pathways that showed significant enrichment at either the RNA or protein level in Fig. 1E. Single-sample pathway enrichment scores were assessed at the level of mRNA (yellow), protein (blue), and phosphoprotein (red). The Wilcoxon rank sum test was used to compare scores for non-pCR vs. pCR scores; *, P < 0.05. NA, not available. B, Membership of differentially regulated proteins to pathways highlighted in A. Proteins (rows) belonging to a given pathway (columns) are shown in light green. The differential expression (DE) at protein and mRNA levels for each gene along with mRNA–protein correlation scores are shown as signed −log10P value (signedp). C, A multiomics metabolic gene signature derived for genes that are correlated at mRNA and protein levels was further investigated in patients treated with carboplatin and paclitaxel in the BrighTNess clinical trial (treatment arms A and B) for which RNA-seq data were available. The mean mRNA expression score for this signature was significantly higher in higher RCB tumors.
Figure 4. Discovery of DNA repair and replication components enriched in non-pCR TNBC tumors. A, Cytobands enriched in genes differentially expressed between non-pCR and pCR for both mRNA and protein. To identify upregulated or downregulated features overrepresented in certain cytobands within the chromosome, GSEA was used to identify regions from chromosomal location databases enriched with differential genes [GSEA input was ranked expression list (signed −log10 P value) from Wilcoxon rank sum tests]. Overrepresented cytobands that were either enriched or depleted using differentially expressed mRNA and protein are indicated in B, and the overlapping sets were used for further analysis. B, Plot showing significantly enriched or depleted cytobands obtained by running differential mRNA and protein ranked lists through GSEA. NES, normalized enrichment score. Genes downregulated in non-pCR samples corresponding to cytoband 19q13.31–33 are indicated in C. C, Venn diagram showing differential (non-pCR vs. pCR) mRNA and proteins located on cytoband 19q13.3. D, Overrepresentation analysis (ORA) shows that differential 19q13.31–33 genes are enriched with Hallmark DNA repair pathway genes. Downregulation of these DNA repair genes at the mRNA and protein levels in non-pCR cases is shown in the bar chart on the right as signed −log10 P values from Wilcoxon rank sum tests. E, Box plot comparing RNA expression of DNA repair genes located on 19q13.31–33 in the previously published BrighTNess clinical trial (treatment arms A and B), in which patients were treated with carboplatin and paclitaxel. The Wilcoxon rank sum test was used to compare residual disease (RD) cases with pCR cases. F, Forest plot showing hazard ratios (HR) and P values for metastasis-free survival associated with LIG1, POLD1, XRCC1, and ERCC2. HR is based on categorizing samples using a median expression cutoff for each gene in the Hatzis dataset.
Figure 4.
Discovery of DNA repair and replication components enriched in non-pCR TNBC tumors. A, Cytobands enriched in genes differentially expressed between non-pCR and pCR for both mRNA and protein. To identify upregulated or downregulated features overrepresented in certain cytobands within the chromosome, GSEA was used to identify regions from chromosomal location databases enriched with differential genes [GSEA input was ranked expression list (signed −log10P value) from Wilcoxon rank sum tests]. Overrepresented cytobands that were either enriched or depleted using differentially expressed mRNA and protein are indicated in B, and the overlapping sets were used for further analysis. B, Plot showing significantly enriched or depleted cytobands obtained by running differential mRNA and protein ranked lists through GSEA. NES, normalized enrichment score. Genes downregulated in non-pCR samples corresponding to cytoband 19q13.31–33 are indicated in C. C, Venn diagram showing differential (non-pCR vs. pCR) mRNA and proteins located on cytoband 19q13.3. D, Overrepresentation analysis (ORA) shows that differential 19q13.31–33 genes are enriched with Hallmark DNA repair pathway genes. Downregulation of these DNA repair genes at the mRNA and protein levels in non-pCR cases is shown in the bar chart on the right as signed −log10P values from Wilcoxon rank sum tests. E, Box plot comparing RNA expression of DNA repair genes located on 19q13.31–33 in the previously published BrighTNess clinical trial (treatment arms A and B), in which patients were treated with carboplatin and paclitaxel. The Wilcoxon rank sum test was used to compare residual disease (RD) cases with pCR cases. F, Forest plot showing hazard ratios (HR) and P values for metastasis-free survival associated with LIG1, POLD1, XRCC1, and ERCC2. HR is based on categorizing samples using a median expression cutoff for each gene in the Hatzis dataset.
Figure 5. Proteogenomic features associated with LIG1. Heat map showing copy number, mRNA, and protein levels of LIG1, which are significantly (Wilcoxon rank sum test) lower (blue) in non-pCR tumors. Corresponding box plots show that tumors with low-level copy loss of LIG1 (GISTIC = −1, likely single copy-number loss) display significantly higher chromosomal instability and MGPS and significantly lower signature 3 (COSMIC mutational signature associated with HRD) than tumors that are wild-type (WT) or show gain of CNA (GISTIC ≥0). Wilcoxon rank sum tests and t tests were used to compare LIG1-loss cases with LIG1-intact (WT/gain) cases. HR, homologous recombination; MSI, microsatellite instability; NA, not available.
Figure 5.
Proteogenomic features associated with LIG1. Heat map showing copy number, mRNA, and protein levels of LIG1, which are significantly (Wilcoxon rank sum test) lower (blue) in non-pCR tumors. Corresponding box plots show that tumors with low-level copy loss of LIG1 (GISTIC = −1, likely single copy-number loss) display significantly higher chromosomal instability and MGPS and significantly lower signature 3 (COSMIC mutational signature associated with HRD) than tumors that are wild-type (WT) or show gain of CNA (GISTIC ≥0). Wilcoxon rank sum tests and t tests were used to compare LIG1-loss cases with LIG1-intact (WT/gain) cases. HR, homologous recombination; MSI, microsatellite instability; NA, not available.
Figure 6. LIG1 association with advanced TNBC disease in preclinical models. A, Proteogenomic status of LIG1, POLD1, and XRCC1 in three PDX models derived from longitudinal biopsies from the same TNBC patient prior to any treatment (WHIM68), at the time of surgery after completing 5 months of neoadjuvant carboplatin and docetaxel (WHIM74), and from a liver metastasis one year after treatment initiation (WHIM75). Mutation and copy-number data were derived from WES and RNA from RNA-seq, and protein data were obtained from TMT proteomics generated by this current study. Bottom, representative western blots from three biological repeats for LIG1, POLD1, and XRCC1 protein levels. GAPDH was used as a loading control. B, Tumor volume was measured in three PDX models. Black and red lines indicate changes in tumor volume in PDXs treated with vehicle and carboplatin, respectively. WHIM68, with highest LIG1 protein levels, was most sensitive to carboplatin, whereas WHIM74 and 75, which displayed progressive LIG1 loss at the copy number, mRNA, and protein levels, were insensitive to carboplatin treatment. P values derived from a general linear model within each PDX were computed using estimated mean log2 fold changes in tumor volume at day 28 vs. day 0 for each treatment arm. C, Boxplots showing LIG1 mRNA levels in TNBCs PDXs categorized into complete response (CR) and non-CR groups. After 4 weeks of carboplatin treatment, CR was defined as PDXs with nonpalpable tumors, and non-CR was defined as PDXs with residual tumors with measurable dimensions. The Wilcoxon rank sum test was used to compare the two groups. D, Association between LIG1 copy-number loss and treatment response in patient-derived xenograft organoids (PDXO) obtained from the BCaPE database. Carboplatin and docetaxel are highlighted in red.
Figure 6.
LIG1 association with advanced TNBC disease in preclinical models. A, Proteogenomic status of LIG1, POLD1, and XRCC1 in three PDX models derived from longitudinal biopsies from the same patient with TNBC prior to any treatment (WHIM68), at the time of surgery after completing 5 months of neoadjuvant carboplatin and docetaxel (WHIM74), and from a liver metastasis 1 year after treatment initiation (WHIM75). Mutation and copy-number data were derived from WES and RNA from RNA-seq, and protein data were obtained from TMT proteomics generated by this current study. Bottom, representative western blots from three biological repeats for LIG1, POLD1, and XRCC1 protein levels. GAPDH was used as a loading control. WT, wild-type. *, stop codon. B, Tumor volume was measured in three PDX models. Black and red lines indicate changes in tumor volume in PDXs treated with vehicle and carboplatin, respectively. WHIM68, with the highest LIG1 protein levels, was most sensitive to carboplatin, whereas WHIM74 and 75, which displayed progressive LIG1 loss at the copy-number, mRNA, and protein levels, were insensitive to carboplatin treatment. P values derived from a general linear model within each PDX were computed using estimated mean log2 fold changes in tumor volume at day 28 versus day 0 for each treatment arm.C, Box plots showing LIG1 mRNA levels in TNBC PDXs categorized into CR and non-CR groups. After 4 weeks of carboplatin treatment, CR was defined as PDXs with nonpalpable tumors, and non-CR was defined as PDXs with residual tumors with measurable dimensions. The Wilcoxon rank sum test was used to compare the two groups. RSEM, expected counts from RNA-seq by expectation-maximization. D, Association between LIG1 copy-number loss and treatment response in PDX organoids (PDXO) obtained from the BCaPE database. Carboplatin and docetaxel are highlighted in red.
Figure 7. Pan-cancer analysis of LIG1 loss. A, Kaplan–Meier curve showing significantly reduced (log-rank P value) PFS for tumors with single-copy loss of LIG1 (HETLOSS, GISTIC ≤−1, indicated in orange) in the TCGA pan-cancer cohort. B, Box plot showing higher fraction genome altered (FGA) in tumors with LIG1 copy-number-loss tumors (shown in teal) relative to tumors that were LIG1 wild-type or displayed LIG1 gain (shown in orange). C, Violin plot showing significantly lower (Wilcoxon rank sum test) COSMIC signature 3 scores in LIG1-loss tumors (shown in teal). D, Forest plot showing the impact of LIG1 copy-number loss on PFS by cancer type along with LIG1 wild-type (WT)/gain/loss frequency, HR, and corresponding P value. BLCA, bladder urothelial carcinoma; BRCA, breast invasive carcinoma; CESC, cervical squamous cell carcinoma and endocervical adenocarcinoma; COAD, colon adenocarcinoma; ESCA, esophageal carcinoma; GBM, glioblastoma multiforme; HNSC, head and neck squamous cell carcinoma; KIRP, kidney renal papillary cell carcinoma; LGG, brain lower grade glioma; LIHC, liver hepatocellular carcinoma; LUAD, lung adenocarcinoma; LUSC, lung squamous cell carcinoma; MESO, mesothelioma; OV, ovarian serous cystadenocarcinoma; PAAD, pancreatic adenocarcinoma; PRAD, prostate adenocarcinoma; SARC, sarcoma; SKCM, skin cutaneous melanoma; STAD, stomach adenocarcinoma; TGCT, testicular germ cell tumors; UCEC, uterine corpus endometrial carcinoma; UCS, uterine carcinosarcoma. E, Box plot showing significantly higher (by Wilcoxon rank sum test) FGA (representing chromosomal instability) in tumors that had LIG1 copy-number loss versus tumors with either wild-type LIG1 or LIG1 copy-number gain. Shown are the only five cancers (HNSC, UCEC, COAD, PRAD, and KIRP) that displayed a significant association between LIG1 loss and adverse prognosis.
Figure 7.
Pan-cancer analysis of LIG1 loss. A, Kaplan–Meier curve showing significantly reduced (log-rank P value) PFS for tumors with single-copy loss of LIG1 (HETLOSS, GISTIC ≤−1, indicated in orange) in the TCGA pan-cancer cohort. B, Box plot showing higher fraction genome altered (FGA) in tumors with LIG1 copy-number-loss tumors (shown in teal) relative to tumors that were LIG1 wild-type or displayed LIG1 gain (shown in orange). C, Violin plot showing significantly lower (Wilcoxon rank sum test) COSMIC signature 3 scores in LIG1-loss tumors (shown in teal). D, Forest plot showing the impact of LIG1 copy-number loss on PFS by cancer type along with LIG1 wild-type (WT)/gain/loss frequency, HR, and corresponding P value. BLCA, bladder urothelial carcinoma; BRCA, breast invasive carcinoma; CESC, cervical squamous cell carcinoma and endocervical adenocarcinoma; COAD, colon adenocarcinoma; ESCA, esophageal carcinoma; GBM, glioblastoma multiforme; HNSC, head and neck squamous cell carcinoma; KIRP, kidney renal papillary cell carcinoma; LGG, brain lower grade glioma; LIHC, liver hepatocellular carcinoma; LUAD, lung adenocarcinoma; LUSC, lung squamous cell carcinoma; MESO, mesothelioma; OV, ovarian serous cystadenocarcinoma; PAAD, pancreatic adenocarcinoma; PRAD, prostate adenocarcinoma; SARC, sarcoma; SKCM, skin cutaneous melanoma; STAD, stomach adenocarcinoma; TGCT, testicular germ cell tumors; UCEC, uterine corpus endometrial carcinoma; UCS, uterine carcinosarcoma. E, Box plot showing significantly higher (by Wilcoxon rank sum test) FGA (representing chromosomal instability) in tumors that had LIG1 copy-number loss versus tumors with either wild-type LIG1 or LIG1 copy-number gain. Shown are the only five cancers (HNSC, UCEC, COAD, PRAD, and KIRP) that displayed a significant association between LIG1 loss and adverse prognosis.

References

    1. Dent R, Trudeau M, Pritchard KI, Hanna WM, Kahn HK, Sawka CA, et al. . Triple-negative breast cancer: clinical features and patterns of recurrence. Clin Cancer Res 2007;13:4429–34. - PubMed
    1. Rottenberg S, Jaspers JE, Kersbergen A, van der Burg E, Nygren AO, Zander SA, et al. . High sensitivity of BRCA1-deficient mammary tumors to the PARP inhibitor AZD2281 alone and in combination with platinum drugs. Proc Natl Acad Sci U S A 2008;105:17079–84. - PMC - PubMed
    1. Staaf J, Glodzik D, Bosch A, Vallon-Christersson J, Reutersward C, Hakkinen J, et al. . Whole-genome sequencing of triple-negative breast cancers in a population-based clinical study. Nat Med 2019;25:1526–33. - PMC - PubMed
    1. Symmans WF, Wei C, Gould R, Yu X, Zhang Y, Liu M, et al. . Long-term prognostic risk after neoadjuvant chemotherapy associated with residual cancer burden and breast cancer subtype. J Clin Oncol 2017;35:1049–60. - PMC - PubMed
    1. Masuda N, Lee SJ, Ohtani S, Im YH, Lee ES, Yokota I, et al. . Adjuvant capecitabine for breast cancer after preoperative chemotherapy. N Engl J Med 2017;376:2147–59. - PubMed

Publication types

MeSH terms

Substances