. 2022 Dec;251(12):2001-2014.
doi: 10.1002/dvdy.529. Epub 2022 Aug 30.

Cellular basis of differential endochondral growth in Lake Malawi cichlids

Affiliations

Cellular basis of differential endochondral growth in Lake Malawi cichlids

Savannah Johnson et al. Dev Dyn. 2022 Dec.

Abstract

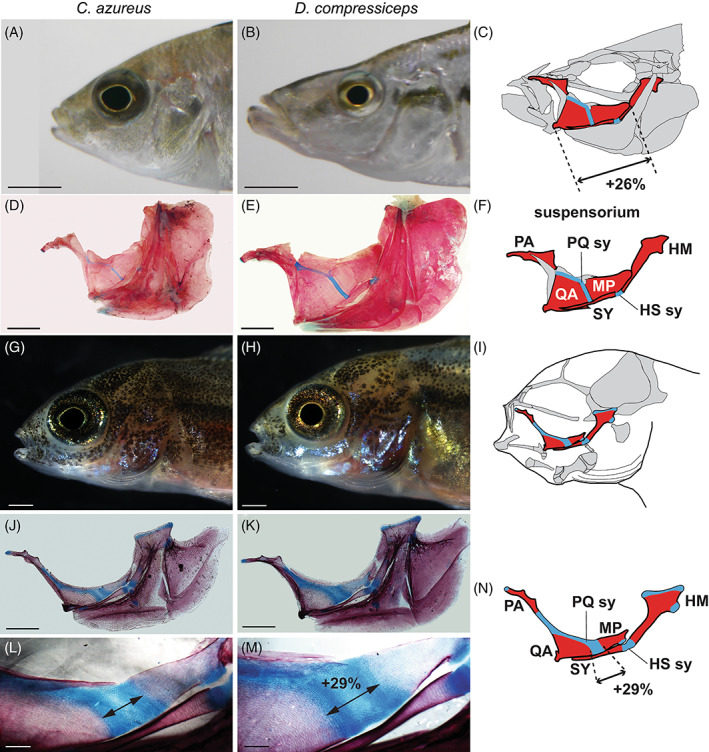
Background: The shape and size of skeletal elements is determined by embryonic patterning mechanisms as well as localized growth and remodeling during post-embryonic development. Differential growth between endochondral growth plates underlies many aspects of morphological diversity in tetrapods but has not been investigated in ray-finned fishes. We examined endochondral growth rates in the craniofacial skeletons of two cichlid species from Lake Malawi that acquire species-specific morphological differences during postembryonic development and quantified cellular mechanisms underlying differential growth both within and between species.

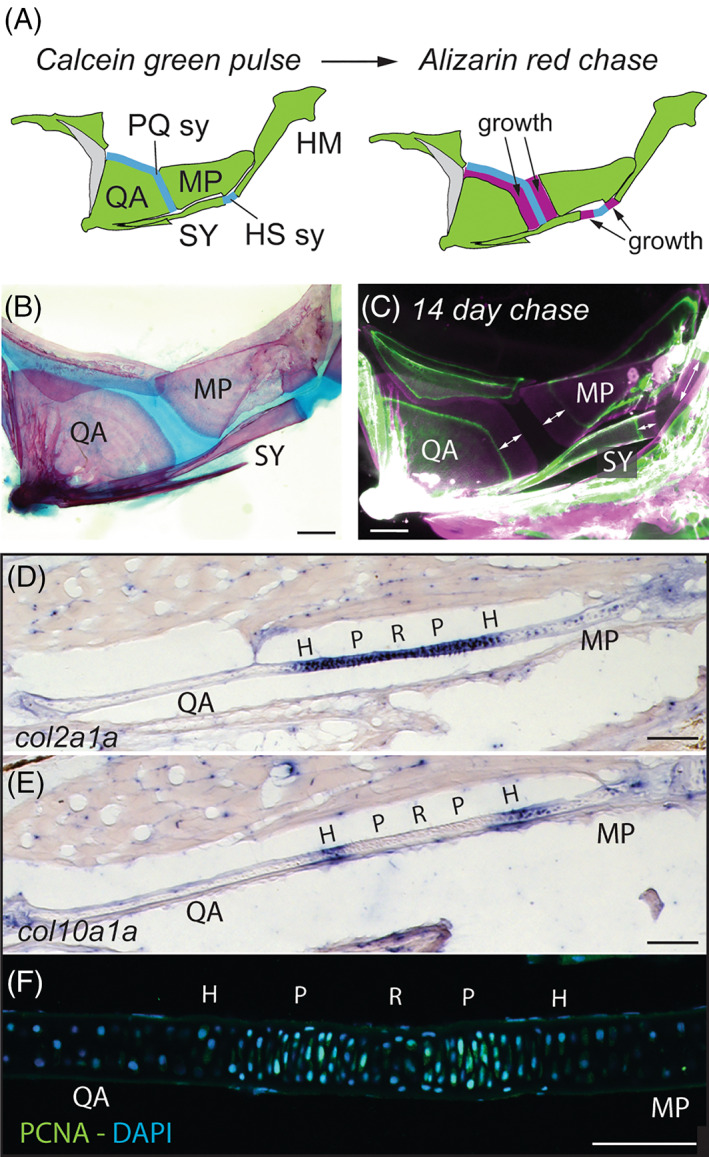
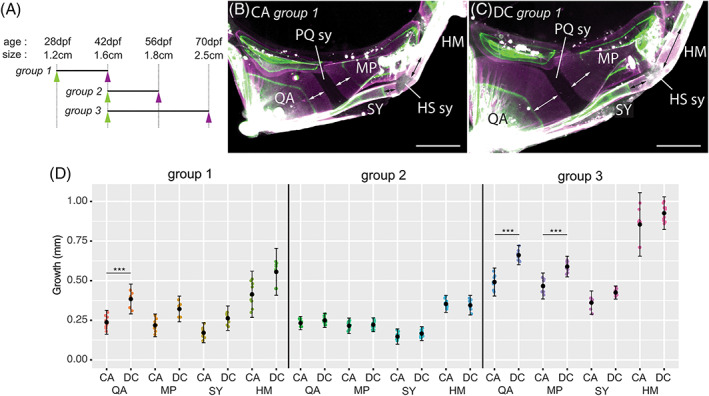
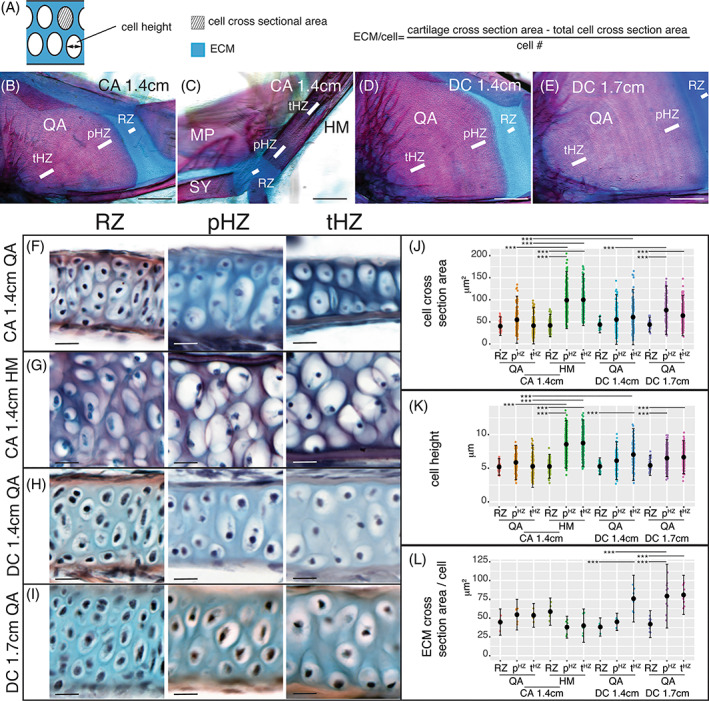
Results: Cichlid endochondral growth rates vary greatly (50%-60%) between different growth zones within a species, between different stages for the same growth zone, and between homologous growth zones in different species. Differences in cell proliferation and/or cell enlargement underlie much of this differential growth, albeit in different proportions. Strikingly, differences in extracellular matrix production do not correlate with growth rate differences.

Conclusions: Differential endochondral growth drives many aspects of craniofacial morphological diversity in cichlids. Cellular proliferation and enlargement, but not extracellular matrix deposition, underlie this differential growth and this appears conserved in Osteichthyes. Cell enlargement is observed in some but not all cichlid growth zones and the degree to which it occurs resembles slower growing mammalian growth plates.

Keywords: cartilage; chondrocyte; craniofacial; hypertrophy; skeleton; teleosts.


Figures

FIGURE 1
FIGURE 1
Adult bone size parallels larval synchondrosis size in the cichlid suspensorium. A‐C: Adult head morphology in Copadichromis azureus (CA, A) and Dimidiochromis compressiceps (DC, B), and underlying skeletal morphology in DC (C). (C) Adult suspensorium size is 26% greater in DC than in CA as measured between the jaw joint and the posterior‐most MP. Scale bar: 0.5 cm. D‐F: Adult CA (D) and DC (E) suspensorium skeletons and bone nomenclature (F). Bone stained red, cartilage stained blue. Scale bar: 0.5 cm. G‐I: Larval head morphology in CA (G) and DC (H), and underlying skeletal morphology (I). Scale bar: 0.5 mm. J‐N: Larval CA (J, L) and DC (K, M) suspensorium skeletons and bone nomenclature (N). Double arrows indicate PQ synchondrosis width in CA (L) and DC (M). PQ synchondrosis width is 29% greater in DC than in CA at 9CFRE stage. Bone stained red, cartilage stained blue. Scale bars: 0.5 mm (J, K) and 0.1 mm (L, M). Anterior is to the left and dorsal to the top in all figure panels. Panels D‐E are reproduced from under the Creative Commons Attribution License 4.0. Abbreviations: HM, hyomandibular; HS sy, hyosymplectic synchondrosis; MP, metapterygoid; PA, palatine; PQ sy, palatoquadrate synchondrosis; QA, quadrate; SY, symplectic.
FIGURE 2
FIGURE 2
The cichlid palatoquadrate synchondrosis is a bidirectional endochondral growth zone. A: Pulse‐chase illustration: bone is first stained green by calcein green pulse (left), followed by a red stain during alizarin red chase (right). Bone deposited between pulse and chase is stained red alone. B: Alizarin red and alcian blue stain of 1.4 cm (TrL) CA suspensorium bones in red and cartilage in blue. Scale bar: 0.25 mm. C: Suspensorium of CA individual pulsed with calcein green at 1 cm (TrL) and chased with alizarin red 14 days later. Bone deposited between pulse and chase is stained in red alone and indicated by double arrows. Scale bar: 0.25 mm. D‐E: In situ hybridization for col2a1a (D) and col10a1a (E) on serial frontal cryosections of CA suspensorium. (D) Col2a1a labels undifferentiated chondrocytes of the resting and proliferative zones of the PQ synchondrosis. (E) Col10a1a labels prehypertrophic chondrocytes. Scale bar: 75 μm. F: Proliferating cell immunostaining in PQ synchondrosis with anti‐PCNA (green) antibody, DAPI stains nuclei blue. Dense PCNA‐label identifies proliferative zone chondrocytes. Scale bar: 75 μm. Anterior is to the left and dorsal to the top in all figure panels. Abbreviations: H, hypertrophic zone; HM, hyomandibular; HS sy, hyosymplectic synchondrosis; MP, metapterygoid; P, proliferative zone; PQ sy, palatoquadrate synchondrosis; QA, quadrate; R, resting zone; SY, symplectic.
FIGURE 3
FIGURE 3
Differential growth of suspensorium bones within and between species and stages. A: Calcein‐green pulse and alizarin red chase time‐tables for groups 1, 2 and 3. B‐C: Representative results of group 1 pulse‐chase in CA (B) and DC (C). Bone deposited between pulse and chase is stained in red alone and indicated by double arrows. D: Bone growth assayed by pulse‐chase stain in groups 1‐3. (***) indicates statistical significance (P < 0.001, THSD test). Anterior is to the left and dorsal to the top in all figure panels. Abbreviations: HM, hyomandibular; HS sy, hyosymplectic synchondrosis; MP, metapterygoid; PQ sy, palatoquadrate synchondrosis; QA, quadrate; SY, symplectic. Scale bar: 0.25 mm
FIGURE 4
FIGURE 4
Quantification of chondrocyte size and ECM content in DC and CA endochondral growth zones. A: Chondrocyte parameters measured on histological sections. B‐E: QA (B, D‐E) and HM (C) section planes and areas shown in histological sections below. Scale bar: 0.25 mm. F‐I: histological sections through the RZ, pHZ and tHZ of the CA QA (F) and HM (G) at 1.4 cm (TrL), and the DC QA at 1.4 cm (H) and 1.7 cm (I, TrL). Scale bar: 10 μm. J‐L: cell parameter quantification in the RZ, pHZ and tHZ of the CA QA and HM at 1.4 cm (TrL), and the DC QA at 1.4 cm and 1.7 cm (TrL). (J) cell cross‐sectional area quantification. (K) cell height quantification. (L) ECM cross‐sectional area per cell. (***) indicates statistical significance (P < 0.001, THSD test). Abbreviations: ECM, extracellular matrix; HM, hyomandibular; MP, metapterygoid; pHZ, prehypertrophic zone; QA, quadrate; RZ, resting zone; SY, symplectic; tHZ, terminal hypertrophic zone.
FIGURE 5
FIGURE 5
Quantification of chondrocyte proliferation in DC and CA endochondral growth zones. A‐L: Anti‐CldU immunostaining of CldU‐labeled cells in: QA of CA 1.4 cm (Trunk Length, TrL, A‐C), HM of CA 1.4 cm (TrL, D‐F), QA of DC 1.4 cm (TrL, G‐I) and QA of DC 1.7 cm (TrL, J‐L). A‐C: Labeled QA of CA 1.4 cm at 1‐ (A) and 5‐days (B) post CldU incubation and corresponding data quantification (C). D‐F: Labeled HM of CA 1.4 cm at 1‐ (D) and 5‐days (E) post CldU incubation and corresponding data quantification (F). G‐I: Labeled QA of DC 1.4 cm at 1‐ (G) and 5‐days (H) post CldU incubation and corresponding data quantification (I). J‐L: Labeled QA of DC 1.7 cm at 1‐ (J) and 5‐days (K) post CldU incubation and corresponding data quantification (L). M: quantification of labeling indexes in the PZ of 1.4 cm (TrL) CA QA and HM, and of the 1.4 and 1.7 cm (TrL) DC QA. Error bars represent SD. (***) indicates statistical significance (P < 0.05, Wilcoxon rank‐sum test). Abbreviations: HM, hyomandibular; HZ, hypertrophic zone; PZ, proliferative zone; QA, quadrate; RZ, resting zone. Scale bar: 20 μm.

Similar articles

Cited by

References

    1. Hunziker EB. Mechanism of longitudinal bone‐growth and its regulation by growth‐plate chondrocytes. Microsc Res Tech. 1994;28(6):505‐519. doi:10.1002/jemt.1070280606 - DOI - PubMed
    1. Kronenberg HM. Developmental regulation of the growth plate. Nature. 2003;423(6937):332‐336. doi:10.1038/nature01657 - DOI - PubMed
    1. Farnum C. Postnatal Growth of Fins and Limbs through Endochondral Ossification. Chicago: University of Chicago Press; 2007:118‐151.
    1. Hunziker EB, Schenk RK. Physiological mechanisms adopted by chondrocytes in regulating longitudinal bone‐growth in rats. J Phys Lond. 1989;414:55‐71. doi:10.1113/jphysiol.1989.sp017676 - DOI - PMC - PubMed
    1. Breur GJ, Turgai J, Vanenkevort BA, Farnum CE, Wilsman NJ. Stereological and serial section analysis of chondrocytic enlargement in the proximal tibial growth‐plate of the rat. Anat Rec. 1994;239(3):255‐268. doi:10.1002/ar.1092390304 - DOI - PubMed

Publication types