. 2022 Oct;118(4):336-368.
doi: 10.1111/mmi.14969. Epub 2022 Aug 24.

Roles of RodZ and class A PBP1b in the assembly and regulation of the peripheral peptidoglycan elongasome in ovoid-shaped cells of Streptococcus pneumoniae D39

Affiliations

Roles of RodZ and class A PBP1b in the assembly and regulation of the peripheral peptidoglycan elongasome in ovoid-shaped cells of Streptococcus pneumoniae D39

Melissa M Lamanna et al. Mol Microbiol. 2022 Oct.

Abstract

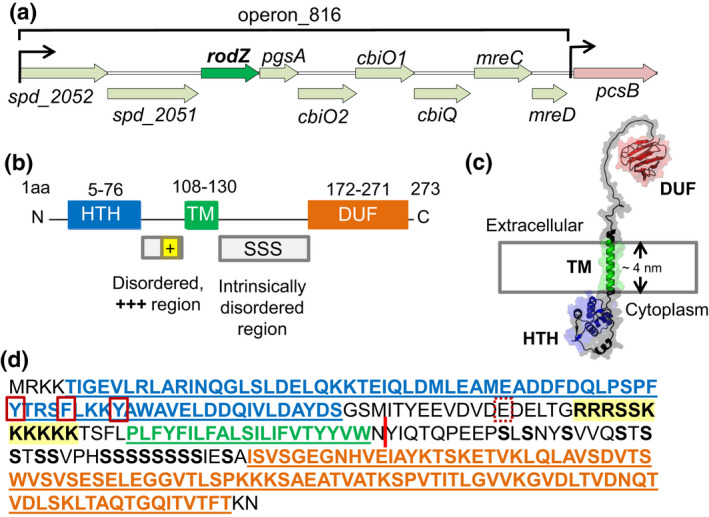
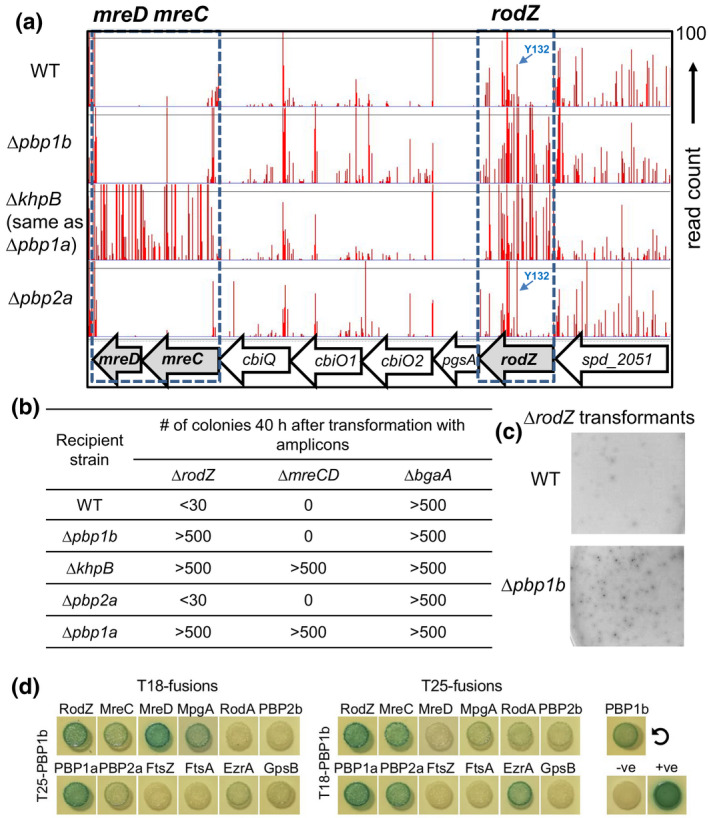
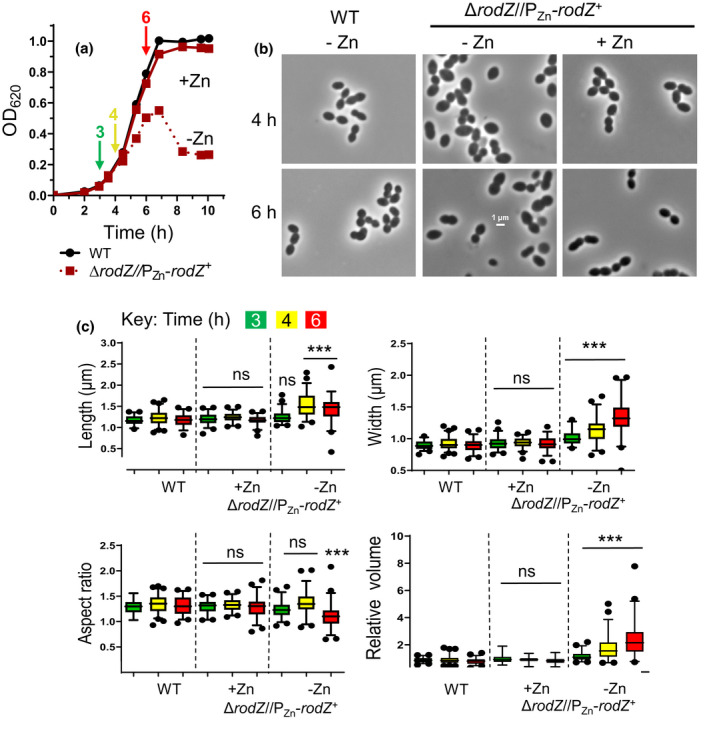
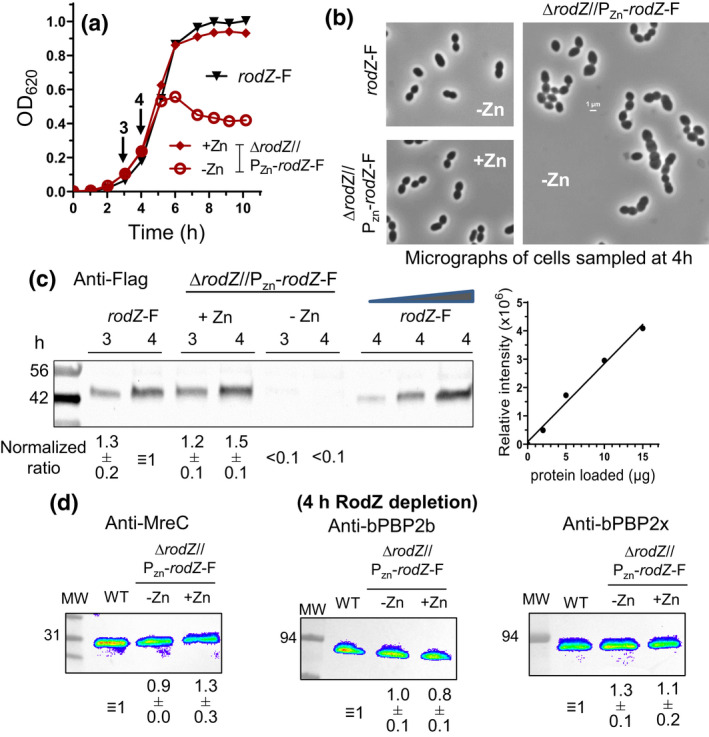
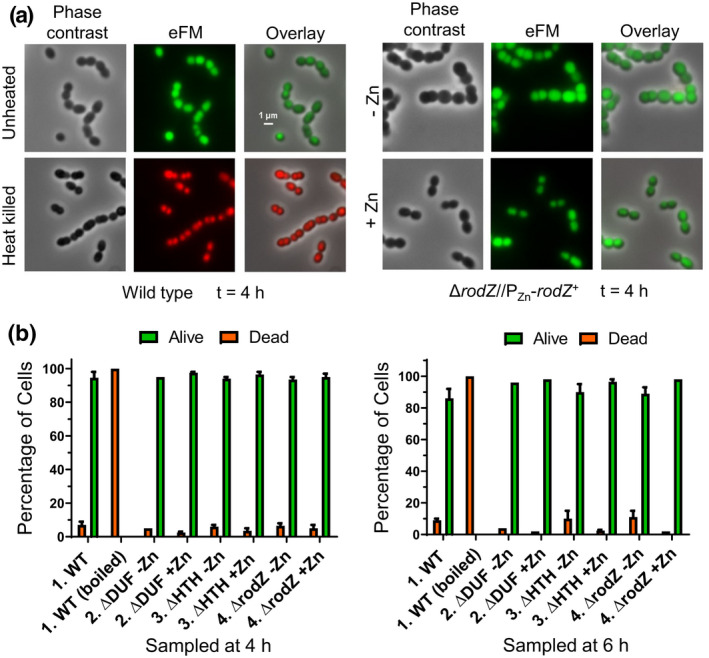
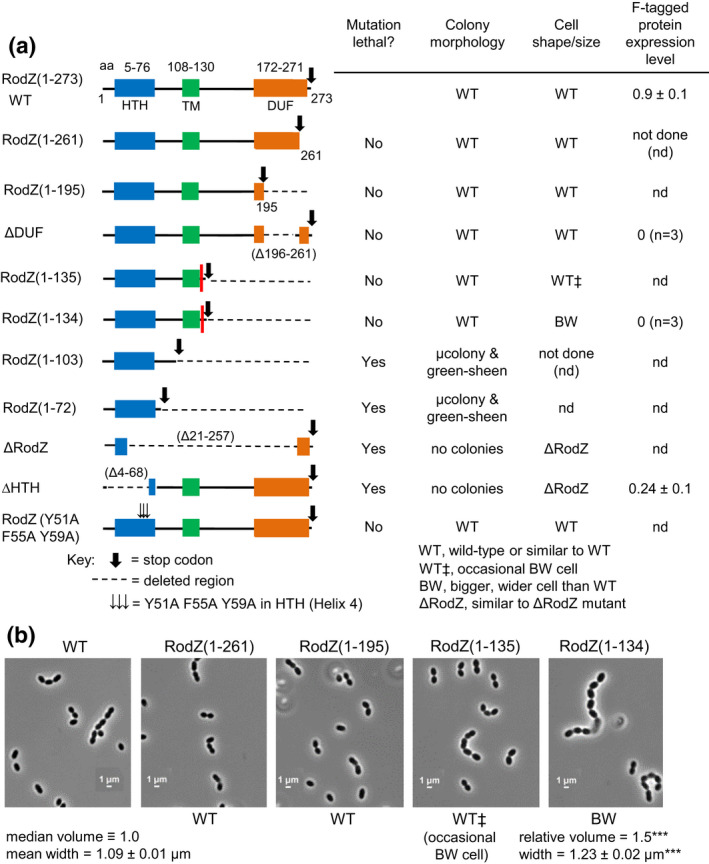
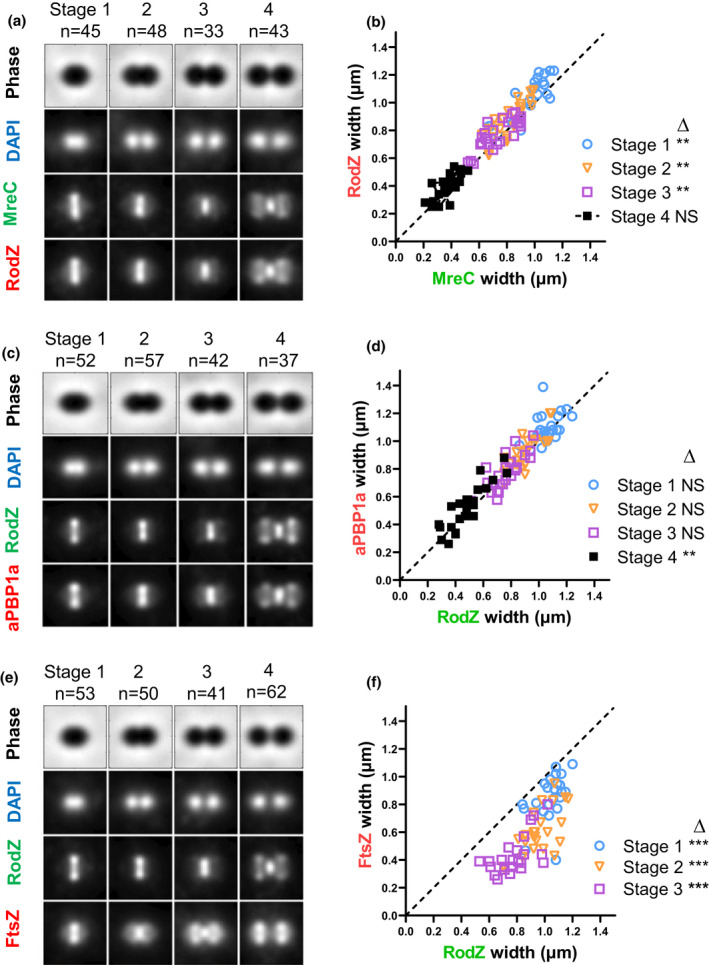
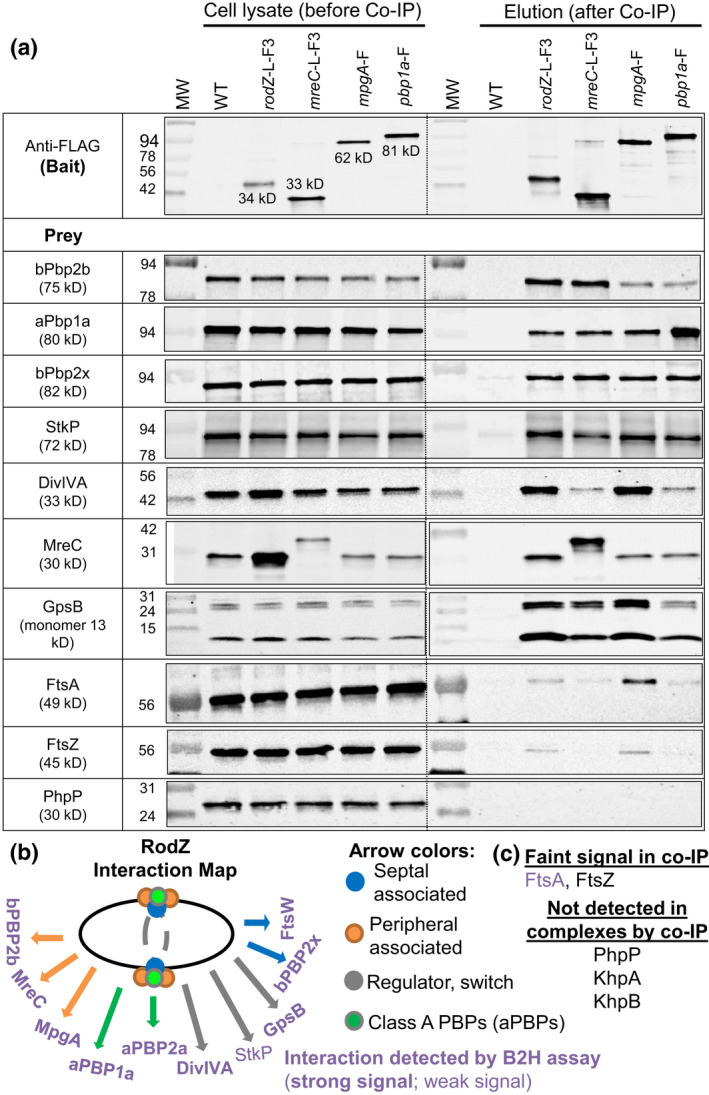
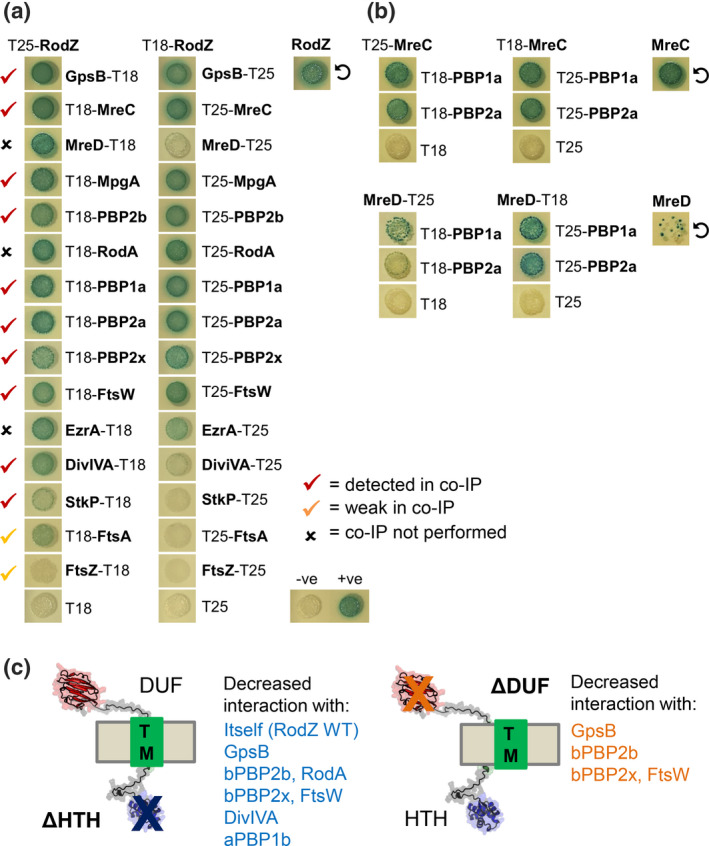
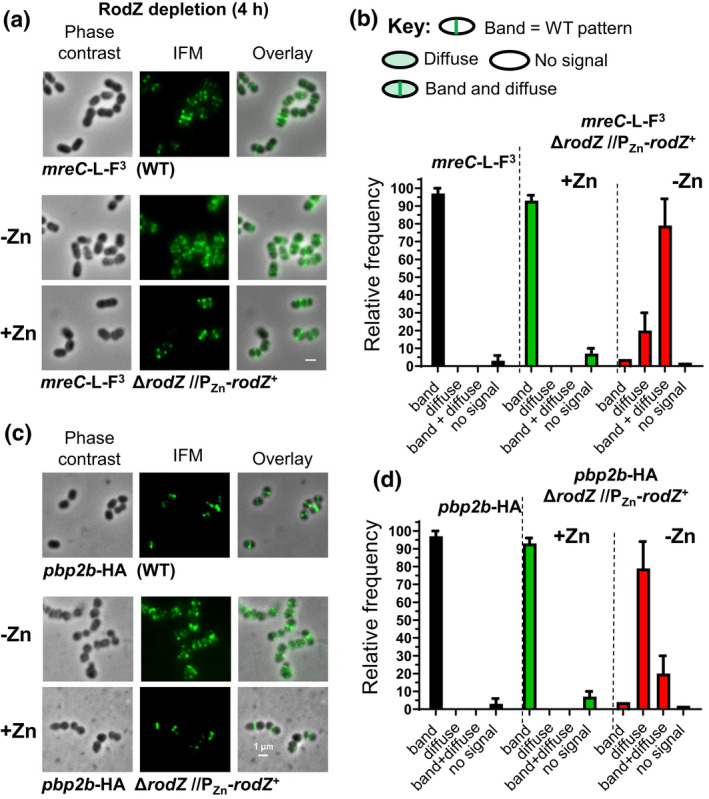
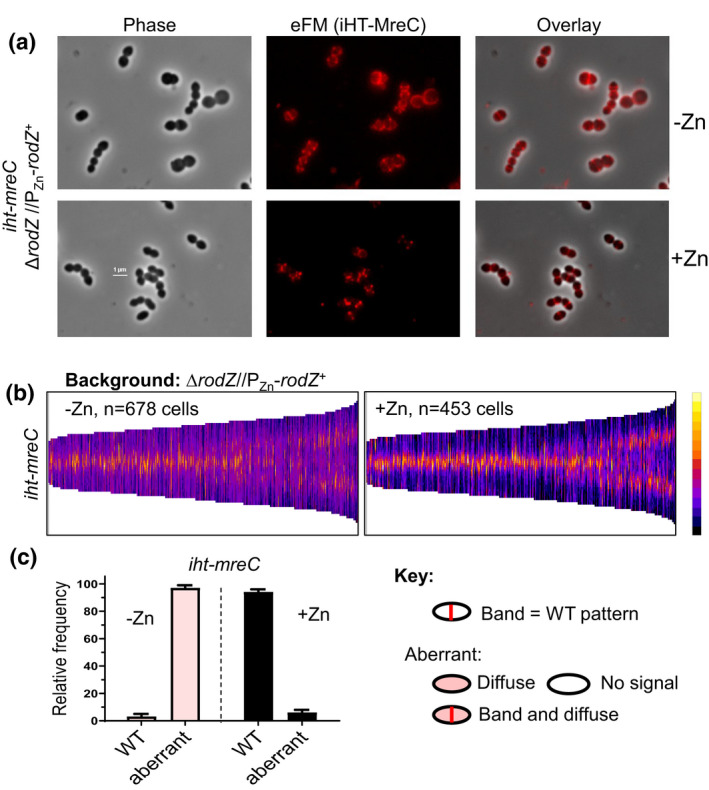
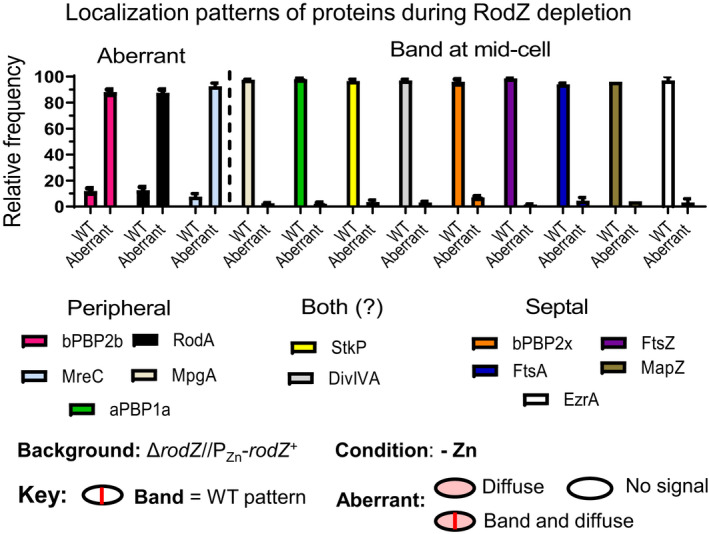
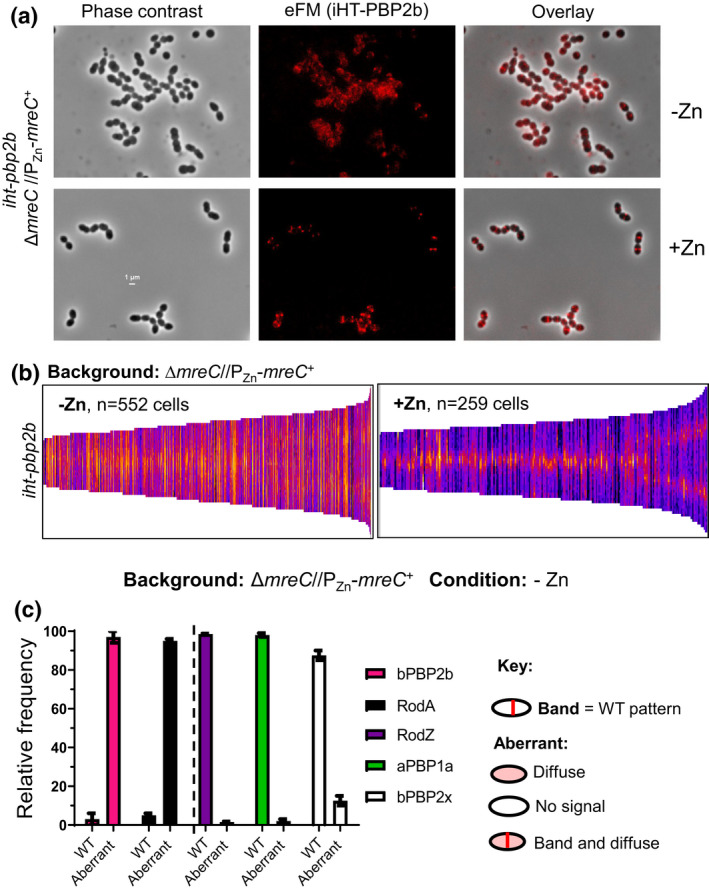
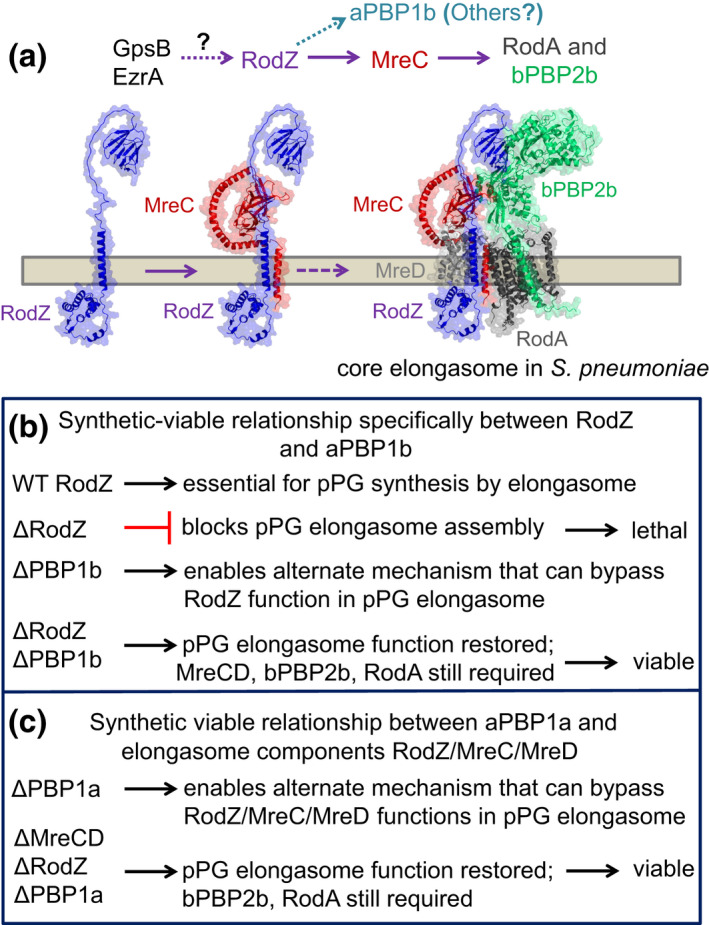
RodZ of rod-shaped bacteria functions to link MreB filaments to the Rod peptidoglycan (PG) synthase complex that moves circumferentially perpendicular to the long cell axis, creating hoop-like sidewall PG. Ovoid-shaped bacteria, such as Streptococcus pneumoniae (pneumococcus; Spn) that lack MreB, use a different modality for peripheral PG elongation that emanates from the midcell of dividing cells. Yet, S. pneumoniae encodes a RodZ homolog similar to RodZ in rod-shaped bacteria. We show here that the helix-turn-helix and transmembrane domains of RodZ(Spn) are essential for growth at 37°C. ΔrodZ mutations are suppressed by Δpbp1a, mpgA(Y488D), and ΔkhpA mutations that suppress ΔmreC, but not ΔcozE. Consistent with a role in PG elongation, RodZ(Spn) co-localizes with MreC and aPBP1a throughout the cell cycle and forms complexes and interacts with PG elongasome proteins and regulators. Depletion of RodZ(Spn) results in aberrantly shaped, non-growing cells and mislocalization of elongasome proteins MreC, PBP2b, and RodA. Moreover, Tn-seq reveals that RodZ(Spn), but not MreCD(Spn), displays a specific synthetic-viable genetic relationship with aPBP1b, whose function is unknown. We conclude that RodZ(Spn) acts as a scaffolding protein required for elongasome assembly and function and that aPBP1b, like aPBP1a, plays a role in elongasome regulation and possibly peripheral PG synthesis.

Keywords: class A PBP function and regulation; elongasome assembly; peptidoglycan synthesis; synthetic-viable genetic relationships.


Conflict of interest statement

The authors declare that they have no conflicts of interests.

Figures

FIGURE 1
FIGURE 1
Location and domains of RodZ(Spn). (a) rodZ (spd_2050) is predicted to be a member of operon_816 in the Spn D39 chromosome (Slager et al., 2018). Operon_816 consists of spd_2052 (putative zinc protease), spd_2051 (putative M16 family peptidase), rodZ, pgsA (CDP‐diacylglycerol‐glycerol‐3‐phosphate 3‐phosphatidyltransferase), cbiO2, cbiO1, cbiQ (putative ATPase and transmembrane components of a cobalt ABC transporters), mreC, and mreD. (b) 2D protein structure of RodZ(Spn). Black line indicates residues that are not part of known domains. The intracellular helix‐turn‐helix (HTH) domain, transmembrane (TM), and extracellular domain of unknown function (DUF 4115) are depicted as blue, green, and orange, respectively, and intrinsically disordered regions are represented as gray boxes. The HTH and DUF domains are predicted to be in alpha helices and beta sheets, respectively, by AlphaFold2 (Jumper et al., 2021). TM domain was determined with TMHMM server. The positively charged juxta‐membrane region of the intracellular linker is shown as a yellow box (+++). SSS symbolizes multiple serine residues in the extracellular linker. (c). Predicted 3D structure of RodZ(Spn) generated using the AlphaFold2 webserver. (d) Amino acid sequence of RodZ(Spn). Color coding is as described in (b), except that the multiple serine residues are bolded and the positive juxta‐membrane is both bolded and highlighted in yellow. Y51 and F55 within helix 4 of the HTH domain (red boxes) correspond to the positions of aromatic amino acids that interact with MreB in E. coli (see Figure S1) (van den Ent et al., 2010). E89 (dotted box) corresponds to the position of S85 in RodZ(Bsu) that may be phosphorylated (Sun & Garner, 2020). The red bar between N131 and Y132 marks the first TA site in a TAT (Y132) codon with a Tn‐mariner insertion recovered by Tn‐seq of the WT strain (Figure 2). The junction of the Tn insertion creates a TAA stop codon, indicating that RodZ(M1‐N131) is viable.
FIGURE 2
FIGURE 2
Tn‐seq analysis reveals suppression of ∆rodZ, but not ∆mreCD, lethality by ∆pbp1b deletion. (a) Tn‐seq transposon insertion profile for the genome region covering spd_2051, rodZ, pgsA, cbiO2, cbiO1, cbiQ, mreC, and mreD of mini‐mariner Malgellan6 transposon (Tn) into the genomes of WT (D39 ∆cps rpsL1, IU1824), ∆pbp1b (IU14697), ∆khpB (IU10592), or ∆pbp2a (IU13256) strains. In vitro transposition reactions, containing purified genomic DNA, Magellan6 plasmid DNA, and purified MarC9 mariner transposase, transformation, harvesting of transposon‐inserted mutants, NextSeq 75 high‐output sequencing, and analysis were performed as described in Experimental procedures. (b) Transformation assay confirming that Δpbp1b suppresses RodZ, but not MreCD, essentiality. Results were obtained 40 h after transformation of WT, ∆pbp1b, ∆khpB, ∆pbp2a, or ∆pbp1a (IU6741) strains with linearized ∆rodZ::Pcaad9, ∆mreCD<>aad9, or positive control ∆bgaA::Pc‐erm amplicons. Numbers of transformants were normalized to correspond to 1 ml of transformation mixture. Similar results were obtained in two or more independent experiments. Similar results were obtained after 24 h of incubation, except that colonies ∆rodZpbp1b transformants were fainter in appearance than at 40 h, and <10 ∆rodZ colonies were obtained in the WT and ∆pbp2a backgrounds (data not shown). (c) Appearance of colonies of the WT or ∆pbp1b strain 40 h after transformation with the ∆rodZ::Pcaad9 amplicon. (d) aPBP1b interacts with RodZ, MreC, MreD, EzrA, MpgA, aPBP1a, and aPBP2a as well as with itself (circular arrow) in B2H assays. Agar plates were photographed after 40 h at 30°C. B2H assays were performed as described in Experimental procedures.
FIGURE 3
FIGURE 3
Depletion of RodZ results in cell rounding, indicative of a defect in peripheral PG synthesis. (a). Representative growth curves of IU1824 (WT) and depletion/complementation strain IU12738 (ΔrodZ//PZnrodZ +) with or lacking Zn inducer (0.4 mM ZnCl2 + 0.04 mM MnSO4). IU1824 or IU12738 was grown overnight in BHI broth at 37°C lacking or with Zn inducer, respectively. Samples were re‐suspended in fresh BHI ± Zn inducer to an OD620 ≈ 0.003. Arrows indicate times (3, 4, and 6 h) at which samples were taken for phase‐contrast microscopy. (b) Representative micrographs of IU1824 (WT) and IU12738 (ΔrodZ//PZnrodZ +) grown in the presence or absence of Zn inducer and sampled after 4 or 6 h. all images are at the same magnification (scale bar = 1 μm). (c) Box‐and‐whiskers plots (5 to 95 percentile) of cell length, width, aspect ratio, and relative volume measured for IU1824 grown in the absence of Zn inducer, and IU12738 grown in the presence or absence of Zn inducer for 3, 4, and 6 h. for each time point, ≈50–80 cells per sample were measured, and statistical analysis was conducted using the non‐parametric, one‐way ANOVA Kruskal–Wallis test in GraphPad prism. Statistical comparisons were carried out for IU12738 grown in the presence or absence of Zn inducer compared with the WT control at the respective time points. ***, p < 0.001; ns, non‐significant. Results shown are representative from one of at least three independent biological replicates.
FIGURE 4
FIGURE 4
RodZ levels decrease to an undetectable level upon depletion for 3 h. (a) Representative growth curves of rodZ‐FLAG (IU14594) and depletion strain ΔrodZ//PZn‐ rodZ‐FLAG (IU10947) with or lacking Zn inducer (0.4 mM ZnCl2 + 0.04 mM MnSO4), where “F” is used as an abbreviation for the FLAG tag. IU14594 or IU10947 was grown overnight in BHI lacking or with Zn inducer, respectively, and diluted into BHI with no Zn for IU14594, and into BHI with or lacking Zn for IU10947. Cultures were sampled at 3 or 4 h for Western analysis (arrows). (b) Representative micrographs of IU14594 (rodZ‐F; −Zn) and IU 10947 (ΔrodZ//PZn‐rodZ‐F; +Zn or −Zn) sampled at 4 h. scale bar = 1 μm (all images are at the same magnification). (c) Representative quantitative Western blot showing RodZ‐F amount expressed from the native chromosomal site in IU14594 or from the ectopic site in the presence or absence of Zn inducer in IU10947 (ΔrodZ//PZn‐ rodZ +‐F) sampled at 3 and 4 h. 10 μg of crude cell lysates were loaded in the left 6 lanes, and 2, 5, or 15 μg were loaded in the right three lanes to generate a standard curve for quantitation. SDS‐PAGE and western blotting were carried out as described in Experimental procedures using Licor IR Dye800 CW secondary antibody detected with an Azure Biosystem 600. Signals obtained with anti‐FLAG antibody were normalized for total protein in each lane using Totalstain Q‐NC (Azure Scientific). Normalized ratios indicate RodZ‐F protein amounts (mean ± SEM) from 3 or 4 h samples for IU10947 relative to IU14594 at 4 h. (D) MreC, bPBP2b, and bPBP2x protein levels are not altered by RodZ depletion. Protein samples were obtained from IU14594 (rodZ‐F WT), or IU10947 (ΔrodZ//PZn‐ rodZ‐F) grown in the presence or absence of Zn inducer for 4 h. 3 μg of crude cell lysates were loaded in each lane. SDS‐PAGE and Western blotting were carried out with primary antibodies to MreC, bPBP2b, or bPBP2x. Chemiluminescence signals obtained with secondary HRP‐conjugated antibodies were detected using an IVIS imaging system. Ratios indicate protein amounts (average ± SEM) in IU10947 (ΔrodZ//PZn‐ rodZ +‐F) relative to those in IU14594 (WT) from two independent biological replicates.
FIGURE 5
FIGURE 5
Cells depleted of RodZ(Spn) for 6 h remain viable. (a) Representative phase‐contrast and 2D epifluorescence microscopy (eFM) images of cells of WT (IU1824; left panels) or the ΔrodZ//PZnrodZ + merodiploid strain (IU12738; right panels) depleted for RodZ (−Zn) or replete with RodZ (+Zn) for 4 h and stained for live (green) and dead (red; indicative of membrane permeability) cells. Cells were grown as described in Figure 3a and stained with the live‐dead BacLight bacterial viability kit (Syto9 and propidium iodide) as described in Experimental procedures. Most exponentially growing WT cells are alive (green), while WT cells heat‐killed by boiling for 5 min at 95°C are dead (red). RodZ depleted (−Zn) or RodZ replete (+Zn) cells are mostly alive (green) at 4 h. All images are at the same magnification (scale bar = 1 μm). (b) Quantitation of the percentage of live or dead WT (IU1824) cells growing exponentially (−Zn) or boiled (control), and rodZ(ΔDUF)//PZn‐rodZ (IU12699), rodZ (ΔHTH)//PZn‐rodZ (IU12696), or ΔrodZ//PZn‐rodZ (IU12738) cells grown in the presence (+Zn; RodZ+) or absence (−Zn; mutant RodZ and/or RodZ depleted) of inducer (0.4 mM ZnCl2 + 0.04 mM MnSO4) for 4 or 6 h. Two hundred cells were examined and scored for each sample. Except for the boiled control cells, most cells remained viable. Data are averaged (± SEM) from 2 independent experiments, except for the 6 h time points of IU12699 and IU12738, which are from a single experiment.
FIGURE 6
FIGURE 6
Amino acids 1–131 of RodZ are required for growth of Spn. (a) Amplicons harboring rodZ truncation or codon‐changing alleles were transformed into merodiploid strain IU12515 (ΔrodZ::Pc [kan‐rpsL +] //PZnrodZ + ) to replace the Janus cassette (ΔrodZ::Pc [kan‐rpsL +]) as described in experimental procedures and Table 2. Effects of RodZ truncations were determined by transformation assays on TSAII‐blood agar plates with or lacking Zn inducer (0.4 mM ZnCl2 + 0.04 mM MnSO4). Colony numbers, sizes, and morphologies were evaluated compared with rodZ + transformants after 20–24 h incubation at 37°C (see legend to Table 1 for experimental details). “μcolonies” (micro colonies) were barely visible by eye, but observed using a low power microscope. “Green‐sheen” refers to a shiny green pattern observed on top of the blood agar that may be due to partial hemolysis. Similar results were obtained in two independent transformation experiments (Table 2). The red bar between N131 and Y132 in the RodZ(1–135) and RodZ(1–134) entries marks the first TA site with a TnMariner insertion recovered by Tn‐seq of the WT strain (see Figure 2). Cell shapes and sizes were determined for WT and merodiploid mutants depleted for RodZ (see Figures 3 and S7; panel (b), below; Figures S8 and S9). Relative amounts of corresponding truncated RodZ proteins fused to a C‐terminus FLAG tag were determined by quantitative western blotting probed with anti‐FLAG antibody as described in Experimental procedures. Proteins samples were obtained from strains IU14594 (rodZ‐F at native chromosomal locus), IU13457 (rodZ‐F//PZnrodZ +), IU13655 (rodZ(ΔDUF)F//PZnrodZ +), IU13660 ((rodZ(1–134)F//PZnrodZ +), and IU13705 (rodZ(ΔHTH)F//PZnrodZ +) (see Table S1). Strains were grown in BHI broth +Zn inducer overnight, followed by growth for 4 h in BHI media lacking or containing Zn inducer as described in Figure 3. Values in the last column are amounts of truncated F‐tagged RodZ variants grown −Zn relative to the amount of RodZ‐F in IU14594. Although IU13655 (rodZ(ΔDUF)F//PZnrodZ +) and IU13660 ((rodZ(1–134)F//PZnrodZ +) were viable −Zn inducer, RodZ(ΔDUF)F and RodZ(1–134)F proteins were not detected in samples grown ± Zn, consistent with cleavage of the FLAG tag off the truncated RodZ variants lacking the C‐terminal DUF domain. (b) Representative micrographs of IU1824 (WT parent), and rodZ truncation mutants IU12794 (rodZ[1–261]//PZnrodZ +), IU12797 (rodZ[1–195]//PZnrodZ +), IU12799 (rodZ(1–135)//PZnrodZ +), and IU12803 (rodZ(1–134)//PZnrodZ +), which grow in the absence of Zn inducer. Cells were imaged during exponential growth at an OD620 ≈ 0.1–0.15 after ≈2.5–3.0 h of growth. Representative growth curves of truncated RodZ variants are shown in Figure S9d. Shapes and sizes were categorized as described for panel (a), above. Only the RodZ(M1‐Q134) mutant showed significant changes in relative median cell volume and average width (± SEM) compared with WT (n = 50 cells for each strain). ***, p < 0.001 by the non‐parametric, one‐way ANOVA Kruskal–Wallis test in GraphPad Prism. RodZ(M1‐T135) mutant cells resembled WT, except for an occasional bigger, wider cell.
FIGURE 7
FIGURE 7
RodZ localizes with MreC and aPBP1a of the peripheral PG synthesis machine. (a) Composite image displaying localization patterns of MreC and RodZ through four stages of pneumococcal growth and division. Images were obtained by dual‐labeling immunofluorescence microscopy (IFM). To construct composite images, n > 30 cells from each division stage were averaged and quantified as described in Experimental procedures. (a) IU7113 (mreC‐L‐F3 rodZ‐Myc) IFM was probed with DAPI (DNA) and anti‐FLAG and anti‐Myc antibodies as detailed in Experimental procedures. (b) Scatter plot of the paired widths of RodZ compared with MreC constructed using the IMA‐GUI program described in Experimental procedures. The dotted line intercepts the origin with slope = 1 and indicates the expected distribution if RodZ and MreC widths are identical. Differences between paired widths were calculated for cells at each division stage, and one‐sample student's t‐tests were performed to determine whether mean differences in widths were significantly different from the null hypothesis value of zero (NS, not significant; **, p < 0.01) (Tsui et al., 2014). (c) Composite image of RodZ and aPBP1a localization in IFM of IU7515 (pbp1a‐L‐F3 rodZ‐Myc) probed with DAPI and anti‐Myc and anti‐FLAG antibodies. (d) Scatter plot of paired width analysis of aPBP1a compared with RodZ. (e) Composite image of RodZ and FtsZ localization in IFM of IU7072 (rodZ‐L‐F3 ftsZ‐Myc) probed with DAPI and anti‐FLAG and anti‐Myc antibodies. (f) Scatter plot of paired width analysis of FtsZ compared with RodZ. ***p value <0.001. Data were obtained from two independent experiments for each comparison.
FIGURE 8
FIGURE 8
RodZ, MreC, MpgA (formerly MltG), and aPbp1a are in complexes with components of the peripheral and septal PG machines, class a PBPs, and cellular regulators StkP, GpsB, and DivIVA. Co‐IP experiments using non‐FLAG‐tagged WT strain (IU1945) or FLAG‐tagged strains RodZ‐L‐F3 (IU6291), MreC‐L‐F3 (IU4970), MpgA‐F (IU7403), or PBP1a‐F (IU5840) as bait were probed with native antibodies to detect prey proteins bPBP2b, aPBP1a, bPBP2x, StkP, DivIVA, MreC, GpsB, FtsA, FtsZ and PhpP as described in Experimental procedures. Prey proteins were detected in all cell lysates (input; left lanes). In elution output samples (right lanes), prey proteins are undetectable for the WT non‐FLAG‐tagged control strain but are present in different relative amounts in samples of the FLAG‐tagged strains. The top blot was probed with anti‐FLAG primary antibody for detection bait proteins. For most blots, 4 μl (4–6 μg) of each lysate sample (input) were loaded on the left lanes, while 15 μl of each elution output sample (after mixing 1:1 2× Laemmli buffer) were loaded on the right lanes. For detection of GpsB, 6 μl (6 μg) of lysate sample and 25 μl of output were loaded. Two bands are detected with anti‐GpsB antibody in the input and output samples, possibly due to failure of heating to reverse cross‐linking of GpsB monomers. The bottom band corresponds to GpsB monomer (≈13 kDa), whereas the top band is likely a GpsB dimer (≈26 kDa). Bands detected with anti‐MreC or anti‐aPBP1a in MreC‐L‐F3 or Pbp1a‐F strains were F‐tagged bait proteins. For detection of MreC‐L‐F3 or Pbp1a‐F in output elution samples, 3 μl of samples were loaded to each lane. The relative amount of MreC was 5–9‐fold higher in the input lysate of rodZ‐L‐F3‐Pc erm (IU4970; MreC row) compared with that from the untagged WT strain (shown in adjacent lane) or lysate obtained from the markerless rodZ‐F strain (IU14594, data not shown), suggesting that the Pc promoter present in the rodZ‐L‐F3‐Pc erm construct leads to overexpression of downstream genes, including mreC. Nevertheless, the Co‐IP results using the rodZ‐F markerless strain lacking an antibiotic‐resistance cassette (IU14594) were similar to those for the rodZ‐L‐F3‐Pc‐ erm strain (IU4970) (data not shown). Co‐IP experiments were performed 2–6 times with similar results (see Table 3 for quantitation). (b) Interaction map of RodZ in cells detected by co‐IP. (c) Proteins that were weakly or not detected in complex with RodZ by co‐IP.
FIGURE 9
FIGURE 9
RodZ interacts with numerous cell elongation and division proteins as well as with itself in B2H assays. (a) RodZ interacts with GpsB, MreC, MreD, MpgA, bPBP2b, RodA, aPBP1a, aPBP2a, bPBP2x, FtsW, EzrA, and DivIVA in both directions, and with StkP and FtsA with a lower signal and only in one direction. Also, RodZ self‐interaction is shown (circular arrow). B2H assays were performed as described in Experimental procedures. Agar plates were photographed after 40 h at 30°C. See Figure S15 for earlier time points at 24, 30, and 36 h. Control experiments showed that all tested proteins exhibited self‐interaction, indicative of functional intactness for interaction (data not shown). (b) MreC and MreD interact with aPBP1a and aPBP2a and also self‐interact (circular arrows). Agar plates were photographed after 40 h at 30°C. The punctate appearance of the spot showing MreD self‐interaction is likely due to high toxicity of the S. pneumoniae mreD hybrid constructs in E. coli. (c) Summary of decreased interactions of Spn RodZ(ΔHTH) and RodZ(ΔDUF) compared with RodZ WT with certain PG synthesis and division proteins in B2H assays. Data are shown in Figure S15.
FIGURE 10
FIGURE 10
Depletion of RodZ leads to the mislocalization of MreC and bPBP2b detected by immunofluorescence microscopy (IFM). Representative images showing localization of MreC (a) or bPbp2b (c) after depletion of RodZ for 4 h of growth, which reduced RodZ to an undetectable amount (Figure 3c). Phase contrast and 2D IFM was performed as described in experimental procedures using antibody to the FLAG or HA tags. Strains used: (a) WT IU14458 (mreC‐L‐F3) and merodiploid strain IU14158 (mreC‐L‐F3 ΔrodZ//PZn ‐rodZ +); (c): WT IU14455 (pbp2B‐HA) and merodiploid strain IU14131 (pbp2B‐HA ΔrodZ//PZn ‐rodZ +). Quantification of localization patterns of MreC (b) and bPBP2b (d) observed at 4 h in the WT and after RodZ depletion. For each sample and condition, 100 cells were manually examined and scored according to the key. Data are averaged (± SEM) from 2 independent experiments.
FIGURE 11
FIGURE 11
Depletion of RodZ leads to the mislocalization of MreC detected by 2D‐eFM. IU16920 (iht‐mreC ΔrodZ//PZnrodZ +; where iht refers to the i‐tag‐HaloTag (Perez et al., 2019)) was grown overnight in the presence of Zn inducer (0.4 mM ZnCl2 + 0.04 mM MnSO4) and diluted into fresh medium to OD620 ≈ 0.003 containing (complementation) or lacking (depletion) Zn inducer. At 4 h, localization of iHT‐MreC was determined following saturation labeling of the iHT domain with HT‐TMR ligand by 2D epifluorescence microscopy (eFM) as described in experimental procedures. (a) Representative micrographs showing iHT‐MreC localization. (b) Demographs displaying fluorescence intensity of iHT‐MreC localization in the absence (−Zn; RodZ depletion) or presence (+Zn; RodZ present) of inducer. N, number of cells aligned and displayed in each demograph. Microscopy and demographs are representative of three independent biological replicates. (c) Bar graph displaying iHT‐MreC localization patterns. For each sample and condition, 100 cells were manually examined and scored according to the key. Data are averaged (± SEM) from two independent experiments.
FIGURE 12
FIGURE 12
Summary of localization patterns of PG synthesis and division proteins after RodZ depletion (−Zn) for 4 h. Among the peripheral PG synthesis machine components, the morphogenic protein MreC and the PG synthase components bPBP2b (TPase) and RodA (GTase) require RodZ for localization, while the localization of MpgA (formerly MltG(Spn) muramidase and Class A PBP1a was unchanged by RodZ depletion. MreC, bPBP2b, and RodA localized normally in the presence of Zn inducer (Figures 10, 11, and S22). Localization of other cell division and PG synthesis proteins (bPBP2x, FtsZ, FtsA, MapZ, EzrA, StkP and DivIVA) were unaffected by RodZ depletion. Representative micrographs of localization studies are shown in Figures 10, 11, S18, S19, S20, and S22. Hundred cells were scored by eye within a given field in each experiment using the indicated key. Data are averaged (± SEM) from two or more independent experiments of each strain. Strains used: IU16058 (iht‐pbp2b), IU16060 (iht‐rodA), IU16920 (iht‐mreC), IU14433 (gfp‐mpgA), IU14496 (pbp1a‐FLAG), IU14160 (stkP‐FLAG2), IU12993 (ftsZ‐sfgfp), IU13061 (divIVA‐gfp), IU13062 (gfp‐mapZ), IU13058 (ezrA‐sfgfp), IU13000 (isfgfp‐pbp2x), and IU17022 (FLAG‐ftsA) in the ΔrodZ//PZnrodZ + background (see Table S1), which was depleted for RodZ as in Figure 3.
FIGURE 13
FIGURE 13
Depletion of MreC leads to mislocalization of bPBP2b and RodA, but not RodZ. For localization of bPBP2b, IU16281 (iht‐pbp2b ΔmreC //PZn ‐mreC +) was grown overnight in the presence of Zn inducer (0.4 mMCl2 Zn + 0.04 mM MnSO4) and diluted into fresh medium containing (complementation) or lacking (depletion) Zn inducer to OD620 ≈ 0.003. After 4 h, iHT‐PBP2b was labeled with a saturating concentration of a HT‐TMR ligand, and localized in cells by 2D epifluorescence microscopy (eFM) as described in Experimental procedures. (a) Representative micrographs of iHT‐PBP2b localization under MreC complementation or depletion conditions. (b) Demographs displaying fluorescence intensity of iHT‐PBP2b localization upon MreC depletion (−Zn) or in the presence of MreC (+Zn) for the number of cells (n) aligned and displayed in each demograph. Microscopy and demographs are representative of three independent biological replicates. (c) Bar graph displaying localization patterns of bPBP2b, RodA, RodZ, aPBP1a, and bPBP2x after MreC depletion (−Zn). For each sample and condition, 100 cells were manually examined and scored according to the key. Data are averaged (± SEM) from two independent experiments. Strains used: IU16281 (iht‐pbp2b), IU16283 (iht‐rodA), IU14598 (rodZ‐FLAG), IU15901 (pbp1a‐FLAG), and IU16326 (iht‐pbp2x) in the ΔmreC//PZnmreC + background (see Table S1). Representative micrographs of proteins other than bPBP2b are in Figures S21, S25, and S26.
FIGURE 14
FIGURE 14
Models of (a) the assembly hierarchy of the pPG core elongasome mediated by RodZ(Spn) and (b and c) bypass pPG synthesis to account for the synthetic‐viable genetic relationships between Class A PBPs and pPG elongasome components in S. pneumoniae. (a) Results presented here establish RodZ(Spn) as an essential scaffolding protein required for the assembly and function of the pPG elongasome. The assembly hierarchy is based on RodZ depletion experiments, protein interaction assays, and genetic relationships described in Results. Depletion of RodZ leads to mislocalization of bPBP2b, RodA, and MreC, which are members of the core pPG elongasome, but not aPBP1a, StkP, FtsA, PBP2x, or MpgA (formerly MltG(Spn)). In turn, depletion of MreC leads to mislocalization of bPBP2b and RodA, but not RodZ or bPBP2x. Hence, depletion of RodZ results in incomplete assembly of the pPG elongasome. Structures of pneumococcal RodZ:MreC, RodZ:MreC:MreD, bPBP2b:RodA, and bPBP2b:RodZ complexes were predicted by AlphaFold‐Multimer (Evans et al., 2021) and aligned by PyMOL, version 2.0 (Schrödinger, LLC) into a model of the core elongasome in S. pneumoniae. Synthetic‐viable genetic relationship between RodZ(Spn) and aPBP1b and interaction experiments described in results implicate aPBP1b in pPG elongasome regulation and possibly in pPG synthesis. Interaction experiments show that RodZ(Spn) interacts with GpsB and EzrA, which have been proposed to play roles in the interface between cell division and PG synthesis in S. pneumoniae (Cleverley et al., ; Perez, Villicana, et al., ; Rued et al., 2017). See text for additional details. (b) Δpbp1b suppresses ΔrodZ, but not ΔmreCD, and MreCD, bPBP2b, and RodA are still required for viability. (c) Δpbp1a suppresses ΔrodZ, ΔmreC, or ΔmreCD, and bPBP2b and RodA are still required for viability. A favored model postulates that some form of pPG synthesis is required for pneumococcal viability because of the proposed role of pPG synthesis in positioning future equatorial Z‐rings in daughter cells. When functions of the WT RodZ‐MreCD‐bPBP2b‐RodA core elongasome (panel (a), above) are impaired, failsafe mechanisms bypass or modulate the function of the pPG elongasome as indicated and restore division and growth. See text for additional details and alternative models for these synthetic‐viable phenotypes.

Similar articles

Cited by

References

    1. Aaron, M. , Charbon, G. , Lam, H. , Schwarz, H. , Vollmer, W. & Jacobs‐Wagner, C. (2007) The tubulin homologue FtsZ contributes to cell elongation by guiding cell wall precursor synthesis in Caulobacter crescentus . Molecular Microbiology, 64, 938–952. - PubMed
    1. Ago, R. & Shiomi, D. (2019) RodZ: a key‐player in cell elongation and cell division in Escherichia coli . AIMS Microbiology, 5, 358–367. - PMC - PubMed
    1. Alyahya, S.A. , Alexander, R. , Costa, T. , Henriques, A.O. , Emonet, T. & Jacobs‐Wagner, C. (2009) RodZ, a component of the bacterial core morphogenic apparatus. Proceedings of the National Academy of Sciences of the United States of America, 106, 1239–1244. - PMC - PubMed
    1. Aravind, L. , Anantharaman, V. , Balaji, S. , Babu, M.M. & Iyer, L.M. (2005) The many faces of the helix‐turn‐helix domain: transcription regulation and beyond. FEMS Microbiology Reviews, 29, 231–262. - PubMed
    1. Barendt, S.M. , Land, A.D. , Sham, L.T. , Ng, W.L. , Tsui, H.C. , Arnold, R.J. et al. (2009) Influences of capsule on cell shape and chain formation of wild‐type and pcsB mutants of serotype 2 Streptococcus pneumoniae . Journal of Bacteriology, 191, 3024–3040. - PMC - PubMed

Publication types

MeSH terms

LinkOut - more resources