. 2022 Nov 1;33(13):ar118.
doi: 10.1091/mbc.E22-05-0182. Epub 2022 Aug 24.

Postmitotic centriole disengagement and maturation leads to centrosome amplification in polyploid trophoblast giant cells

Affiliations

Postmitotic centriole disengagement and maturation leads to centrosome amplification in polyploid trophoblast giant cells

Garrison Buss et al. Mol Biol Cell. .

Abstract

DNA replication is normally coupled with centriole duplication in the cell cycle. Trophoblast giant cells (TGCs) of the placenta undergo endocycles resulting in polyploidy but their centriole state is not known. We used a cell culture model for TGC differentiation to examine centriole and centrosome number and properties. Before differentiation, trophoblast stem cells (TSCs) have either two centrioles before duplication or four centrioles after. We find that the average nuclear area increases approximately eight-fold over differentiation, but most TGCs do not have more than four centrioles. However, these centrioles become disengaged, acquire centrosome proteins, and can nucleate microtubules. In addition, some TGCs undergo further duplication and disengagement of centrioles, resulting in substantially higher numbers. Live imaging revealed that disengagement and separation are centriole autonomous and can occur asynchronously. Centriole amplification, when present, occurs by the standard mechanism of one centriole generating one procentriole. PLK4 inhibition blocks centriole formation in differentiating TGCs but does not affect endocycle progression. In summary, centrioles in TGC endocycles undergo disengagement and conversion to centrosomes. This increases centrosome number but to a limited extent compared with DNA reduplication.


Figures
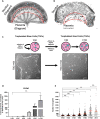
FIGURE 1:
FIGURE 1:
TSCs can be propagated and differentiated into TGCs in vitro: (A) Diagram of the developing mouse placenta, decidua, and vasculature (light gray) with nuclei (dark gray); the layer of TGCs outlined in red. Graphic was created with Biorender.com. (B) Wide-field image of a tissue section of conceptus at e9.5 stained with DAPI; layer of TGCs, characterized by large nuclei, is outlined in red. Scale bar = 100 µm. (C) Schematic of TGC differentiation time course for detailed protocol; see Materials and Methods. TSCs were differentiated into TGCs for up to 10 d, with a time point collected every 2 d. The t = 0 d time point was collected at the beginning of differentiation; thus cells at t = 0 d are also considered to be TSCs. Note that TGC differentiation is an asynchronous process, and there may be TGCs with large nuclei present at the beginning of differentiation, as indicated in the schematic. Phase images of TSCs (left) and TGCs (right) show clear morphological differences of the two cultures. Scale bar = 50 µm. (D) To validate TGC differentiation over the time course, expression of TGC-specific lactogen Prl3d1 was evaluated by quantitative real-time PCR. Data were collected in four independent experiments. A Gapdh probe was used to normalize samples; expression is relative to time t = 0 d. **p value ≤ 0.01. (E) Quantification of nuclear area throughout TGC differentiation shows a gradual increase in the size of nuclei. Graph shows average nuclear area (mean plus SEM) measured during in vitro differentiation time course. Data were collected in three independent experiments. ****p value ≤ 0.0001, n.s., not significant.
FIGURE 2:
FIGURE 2:
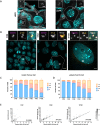
Increase in centriole number and centrosome number during TGC differentiation. (A) Confocal microscopy images of tissue sections of a mouse conceptus (e9.5) transgenic for eGFP-centrin2/Arl13b-mCherry. Sections correspond to the TGC layer described in Figure 1A. DAPI (cyan) was used to visualize nuclei, and the native eGFP-centrin2 fluorescence to visualize centrioles (white). TGCs were identified by nuclear size relative to adjoining cells. Scale bars overview, 10 µm; inset 2 µm. (B) Microscopic images of differentiating TGCs at t = 0, 6, and 10 d. Cells were fixed and labeled with antibodies to mark the centrosome (γ-tubulin, yellow) and centrioles (centrin, magenta). DAPI (cyan) was used to visualize nuclei. Centrioles from cells indicated with dashed lines are shown at higher magnification in insets. The t = 10 d images are from a large TGC whose boundary is beyond shown field of view. Scale bars overview, 10 µm; inset 2 µm. (C) Quantification of centriole number throughout TGC differentiation as measured by centrin immunofluorescence shows an increase in centriole number as cells differentiate. The percent of cells with the indicated centriole numbers was calculated in three independent experiments. For each experiment, a minimum of 60 cells per condition were counted; bars represent the mean percent of cells. Error bars represent the SEM. (D) Quantification of centrosome number throughout TGC differentiation time course, as marked by γ-tubulin immunofluorescence. The percent of cells with the indicated centriole numbers was calculated in three independent experiments. For each experiment, a minimum of 60 cells per condition were counted; bars represent the mean percent of cells. Error bars represent the SEM. (E) Correlation of centriole and centrosome number per cell as identified by centrin and γ-tubulin immunofluorescence, respectively, at the beginning of differentiation (t = 0 d), middle of differentiation (t = 6 d), and end of differentiation (t = 10 d) from the data in C and D; shading opacity of each point is 5%.
FIGURE 3:
FIGURE 3:
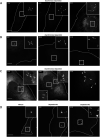
Centriole disengagement in postmitotic TGCs. (A–D) Differentiating TGCs, with centrioles marked by eGFP-centrin2, demonstrating synchronous or asynchronous separation and disengagement of duplicated centrioles. Scale bars = 10 µm. (A) Still frames from Supplemental Video S1 demonstrating synchronous separation of both centriole pairs. Panel 1 shows engaged configuration of centrioles that persists for ∼14 h before disengaging and separating both pairs of centrioles in panel 2 “Full Separation.” Panel 3 shows the same four centrioles nearly 30 h later while the cell has dramatically enlarged both its nucleus and its cytoplasm. Insets are shown at 3× magnification. (B) Still frames from Supplemental Video S2 demonstrating asynchronous separation of a single centriole pair. Panel 2 “Asynchronous Separation” demonstrates a single pair of centrioles (“3–4”) undergoing disengagement and separation while the other pair (“1–2”) remains tightly associated. Panel 3 shows the same cell with centrioles 3 and 4 remaining separated and centrioles 1 and 2 remaining associated hours later. Insets are shown at 3× magnification. (C) Still frames from Supplemental Video S3 demonstrating partial centriole separation for a pair of engaged centrioles in a cell with supernumerary centrioles. Panel 2 “Asynchronous Separation” demonstrates a single pair of centrioles (“5–6”) undergoing disengagement and separation while the other pairs (“1–4; 7 and 8”) remain associated. Panel 3 shows the same cell 1 d later with most centrioles separated throughout the cell (arrowheads). Insets are shown at 2× magnification. (D) Still frames from Supplemental Video S4 demonstrating duplication, disengagement, and separation after a mitotic event. Panels show a TSC undergoing mitosis (first panel, “Mitosis”), disengaging and separating centrioles (“Separation #1”), duplicating, disengaging, and separating centrioles again (“Separation #2”) without passing through a second mitosis. Insets are shown at 3× magnification.
FIGURE 4:
FIGURE 4:
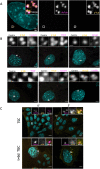
Amplified centrioles in TGCs acquire microtubule nucleation competence. (A) Expansionmicroscopy (physical expansion factor ∼3.5×) images of a t = 10 d TGC. Expanded TGCs were stained with antibodies to mark the centrioles (acetylated tubulin) and PCM (γ-tubulin) and were counterstained with DAPI, to mark nuclei. Scale bars = 10 µm, inset = 2 µm (expansion). (B) Immunofluorescence images of t = 10 d TGCs showing localization of various centrosome proteins in TGCs with amplified centrosomes. Cells were fixed and labeled with antibodies to label structural, PCM, and appendage proteins as indicated above each panel. Scale bar = 10 µm, inset = 1 µm. (C) Immunofluorescence images showing TSCs (top) and TGCs (bottom) in a microtubule regrowth experiment. First panel shows cells just before washout (0 min). Second and third panels show cells shortly after washout (5 and 20 min). Cells were fixed and labeled with antibodies to mark microtubules (α-tubulin, yellow), centrioles (centrin, magenta), and nuclei (DAPI, cyan). (A–C) Scale bars = 10 µm; insets in C are shown at 7× magnification.
FIGURE 5:
FIGURE 5:
Increase in TGC centriole number during differentiation is dependent on PLK4 activity. (A) Schematic of experimental design. TSCs were seeded 24 h before differentiation, as indicated by TSC proliferation. TGC differentiation was conducted in the presence of centrinone-B or an equivalent volume of DMSO as a control for up to 6 d. An untreated control was also included. To label nuclei that are actively replicating DNA in S-phase, TGCs were incubated with 10 µM 5-ethynyl-2´-deoxyuridine (EdU) at 5 d for 24 h. (B) Immunofluorescence of representative images of TGCs at t = 6 d. Centrioles were labeled with centrin (yellow) antibody, and nuclei that entered S-phase were labeled for EdU incorporation using Click-it Chemistry (magenta). Scale bars = 10 µm, inset = 2 µm. (C) Violin plot of centriole number in cells for t = 6 d during drug treatments and control conditions. Solid red lines indicate median. (D) Quantification of nuclear area for t = 6 d during drug treatments and control conditions. Red horizontal lines represent the mean. Each dot represents a single cell mean (in red). (E) Quantification of the EdU status for populations of cells at t = 6 d during drug treatments and control conditions. Results shown are for three independent experiments. At least 50 cells quantified per experiment for untreated, DMSO, and centrinone-B treatments; error bars are SEM. ****p value ≤ 0.0001, n.s., not significant.
FIGURE 6:
FIGURE 6:
Model of centriole and centrosome amplification in endocycling murine TGCs. Cartoon diagram showing (left) the centriole duplication cycle in a TSC, with either two disengaged centrioles (G1) or two pairs of engaged centrioles (G2) (magenta barrels), and their associated PCM (yellow dots). (Right) TGCs during differentiation with a variable number of centrosomes and centrioles. The centrioles in most TGCs undergo disengagement and separation, which can be synchronous or asynchronous, and acquire PCM, such that they form single-centriole centrosomes. Some TGCs undergo additional centriole/centrosome amplification that also ultimately resolves to single-centriole centrosomes. Graphic was created with Biorender.com.

References

    1. Balczon R, Bao L, Zimmer WE, Brown K, Zinkowski RP, Brinkley BR (1995). Dissociation of centrosome replication events from cycles of DNA synthesis and mitotic division in hydroxyurea-arrested Chinese hamster ovary cells. J Cell Biol 130, 105–115. - PMC - PubMed
    1. Bangs FK, Schrode N, Hadjantonakis AK, Anderson KV (2015). Lineage specificity of primary cilia in the mouse embryo. Nat Cell Biol 17, 113–122. - PMC - PubMed
    1. Basto R, Brunk K, Vinadogrova T, Peel N, Franz A, Khodjakov A, Raff JW (2008). Centrosome amplification can initiate tumorigenesis in flies. Cell 133, 1032–1042. - PMC - PubMed
    1. Carney EW, Prideaux V, Lye SJ, Rossant J (1993). Progressive expression of trophoblast-specific genes during formation of mouse trophoblast giant cells in vitro. Mol Reprod Dev 34, 357–368. - PubMed
    1. Carvalho AF, Klisch K, Miglino MA, Pereira FTV, Bevilacqua E (2006). Binucleate trophoblast giant cells in the water buffalo (Bubalus bubalis) placenta. J Morphol 267, 50–56. - PubMed

Publication types

Substances

LinkOut - more resources