. 2022 Aug 26;8(34):eabp9011.
doi: 10.1126/sciadv.abp9011. Epub 2022 Aug 24.

Mechanistic insights into intramembrane proteolysis by E. coli site-2 protease homolog RseP

Affiliations

Mechanistic insights into intramembrane proteolysis by E. coli site-2 protease homolog RseP

Yuki Imaizumi et al. Sci Adv. .

Abstract

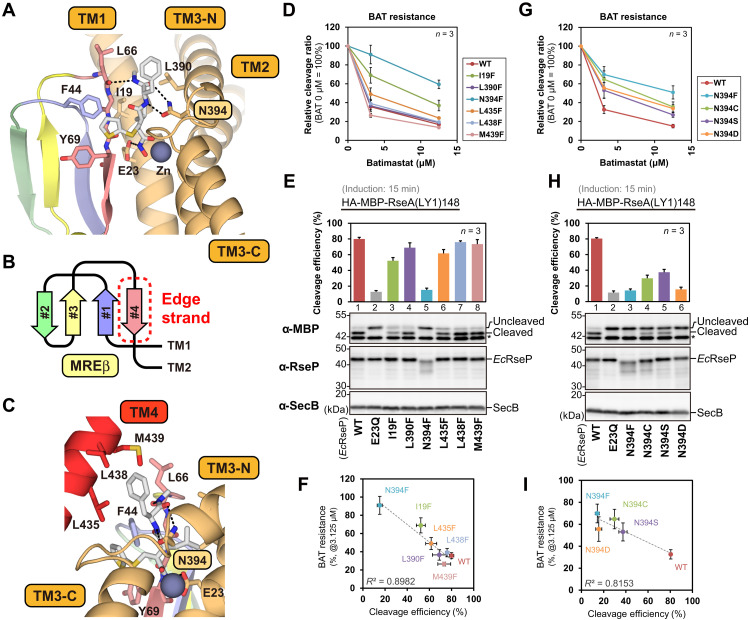
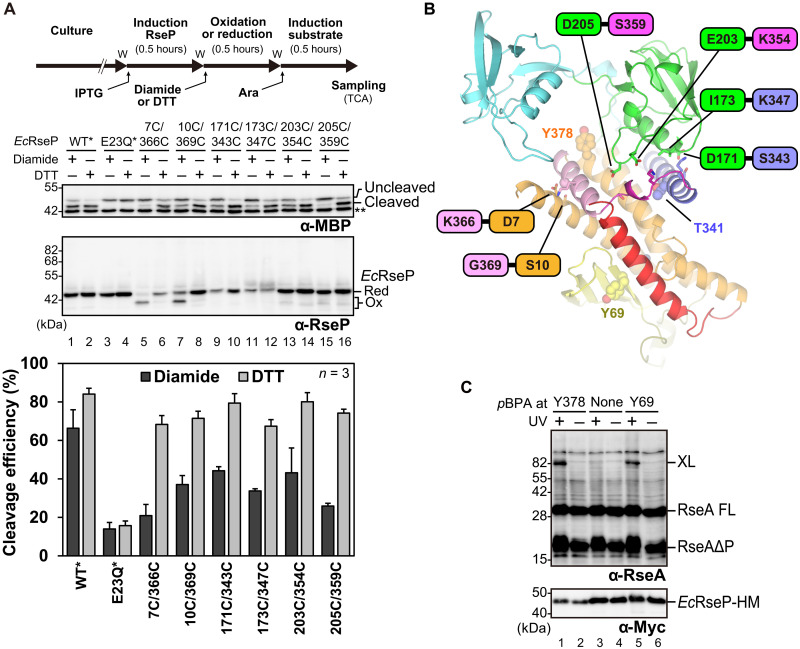
Site-2 proteases are a conserved family of intramembrane proteases that cleave transmembrane substrates to regulate signal transduction and maintain proteostasis. Here, we elucidated crystal structures of inhibitor-bound forms of bacterial site-2 proteases including Escherichia coli RseP. Structure-based chemical modification and cross-linking experiments indicated that the RseP domains surrounding the active center undergo conformational changes to expose the substrate-binding site, suggesting that RseP has a gating mechanism to regulate substrate entry. Furthermore, mutational analysis suggests that a conserved electrostatic linkage between the transmembrane and peripheral membrane-associated domains mediates the conformational changes. In vivo cleavage assays also support that the substrate transmembrane helix is unwound by strand addition to the intramembrane β sheet of RseP and is clamped by a conserved asparagine residue at the active center for efficient cleavage. This mechanism underlying the substrate binding, i.e., unwinding and clamping, appears common across distinct families of intramembrane proteases that cleave transmembrane segments.


Figures

Fig. 1.
Fig. 1.. Domain organization of the S2P family members and involvement of RseP in the E. coli extracytoplasmic stress response.
The topology diagrams for (A) EcRseP and KkRseP of group I, (B) human S2P (HsS2P) of group I, and (C) MjS2P of group III, respectively. The three TM helices colored orange constitute a conserved catalytic core region. The group I S2Ps have a different number of PDZ domains. HsS2P contains a Cys-rich region inserted into the PDZ domain. The group III S2Ps (e.g., MjS2P) have a cystathionine-β-synthase (CBS) domain but no PDZ domain. Crystallographic analysis of MjS2P suggests that TM1, TM5, and TM6 (light magenta) serve as the substrate entry gate where the close proximity between TM1 and TM6 forms a gate-closed state (26). TM1 and TM6 in MjS2P are less or not conserved in HsS2P and RsePs. (D) Extracytoplasmic stress causes accumulation of unfolded or denatured outer membrane proteins (OMPs) in the periplasm, together with dissociation of RseB from RseA. DegS, the E. coli counterpart of site-1 protease (S1P), is activated by interaction with the unfolded OMP and cleaves the periplasmic region of the anti–sigma factor RseA (site-1 cleavage). Subsequently, RseP performs intramembrane proteolysis of the DegS-cleaved form of RseA (site-2 cleavage), which leads to the activation of σE. The PDZ tandem of RseP was proposed to sterically hinder the entry of the full-length RseA complexed with RseB. In this study, structure-based mutational and cross-linking analyses have been conducted to address the question of how RseP accommodates the site-1–cleaved substrates using the PDZ tandem, the PDZ C-terminal (PCT) region including H1 and H2 helices, TM4, and the MREβ-sheet.
Fig. 2.
Fig. 2.. Crystal structures of EcRseP and KkRseP.
(A) Domain organization of EcRseP. The yellow rectangle labeled with MREβ indicates the MREβ-sheet. The rectangles labeled with H1 and H2 indicate PCT-H1 and PCT-H2, respectively. (B and C) Two views of the structure of full-length EcRseP. Polypeptide chains are shown as ribbon models. Batimastat (BAT) and zinc ions (Zn) are shown as sphere models. Each domain or motif is colored as in (A). (D and E) View of the structure of full-length EcRseP from an outside-in perspective relative to the membrane. The PDZ tandem is highlighted with a transparent surface in (D), while the PDZ tandem is removed to visualize the PCT region and the helix bundle of the TM domain in (E). (F to I) Structure of full-length KkRseP in the same views as that of EcRseP. In (H) and (I), the TM4 segment from the crystal packing neighbor is accommodated into the TM1-TM3 cleft and is shown in a gray ribbon model. (J) In vitro substrate cleavage assay with purified RseP proteins. 35S-Met–labeled model substrate HA-RseA148 from cell-free synthesis was incubated at 37°C for the indicated periods with EcRseP (2.5 ng/μl; 50 nM), KkRseP (100 ng/μl; 2.0 μM), or enzyme buffer only (mock) plus 5 mM zinc chelator 1,10-phenanthroline (PT+) or 5% dimethyl sulfoxide (DMSO) (PT−) as indicated. Model substrate and cleavage products (labels, right) on a bis-tris SDS–polyacrylamide gel electrophoresis (SDS-PAGE) gel were visualized using a PhosphorImager. A representative result from three technical replicates is shown.
Fig. 3.
Fig. 3.. Binding mode of batimastat to EcRseP and dependence on residue N394.
(A) Close-up view of the batimastat-binding site. Batimastat and the residues in direct contact with batimastat are shown as stick models. The four strands constituting the MREβ-sheet are shown in different colors. TM4 is omitted to visualize the binding site. (B) Topology diagram of the MREβ-sheet. (C) Interaction between TM4 and batimastat. (D and G) In vivo batimastat sensitivity assay. E. coli YH2902 cells harboring one plasmid for HA-MBP-RseA(LY1)148 (pYH124) and one for tagless EcRseP (pYH825) or its variants were first treated with 0, 12.5, or 3.125 μM batimastat at 30°C for 10 min and then induced with 1 mM isopropyl-β-d-thiogalactopyranoside (IPTG) for 1 hour. The relative cleavage ratio was determined by quantitating the signal from immunoblots and comparing the value with that for the 0 mM BAT condition. Points and error bars represent the means ± SD from three biological replicates (see fig. S7 for the raw data). (E and H) In vivo substrate cleavage assay with short induction. YH2902 cells carrying two plasmids as in (D) and (G) were incubated with 1 mM IPTG for 15 min. The cleavage efficiency was determined as described in Materials and Methods. SecB serves as a loading control. An asterisk indicates endogenous maltose-binding protein (MBP). Bar plots and error bars represent the means ± SD from three biological replicates. (F and I) Scatterplots of the BAT resistances of the RseP mutants [relative cleavage ratio under 3.125 μM BAT concentration shown in (D) or (G)] against the cleavage efficiencies of the model substrate [shown in (E) or (H)].
Fig. 4.
Fig. 4.. mal-PEG accessibility assay for the PDZ tandem.
(A and B) Mapping mutation sites onto the crystal structure of EcRseP. The side chains of the mutated residues are shown as sphere models. The residue modified without detergent Triton X-100 (A136) is colored red, while the other residues colored blue were modified upon addition of the detergent. (D and E) Mapping mutation sites onto the crystal structure of KkRseP, as in (A) and (B). The residue modified slightly without the detergent (E163) is colored magenta. (C and F) Mal-PEG accessibility assay for the EcRseP and KkRseP Cys mutants. Spheroplasts of KK374 cells carrying a plasmid encoding Cys-less EcRseP (pYH835), KkRseP with internal PA14 tag (pYH838), or one of their single-Cys mutants were treated with 1 mM mal-PEG in the presence or absence of 2% Triton X-100 at 4°C for the indicated periods. “Contrast +” indicates a signal-enhanced image. An asterisk indicates RseP derivatives modified with a minor mal-PEG component (62). A representative result from two biological replicates is shown. (G) Conformation of the KkRseP PDZ tandem. In the crystal structure of KkRseP, the PDZ tandem adopts an open conformation (green). However, the mal-PEG assay indicates that the KkRseP PDZ tandem on the cell membrane adopts a relatively closed conformation (black dotted line), in which F167 (blue circle) is expected to be closer to the PCT-H1 (light-blue column). The partial modification of E163 (magenta circle) without detergent indicates that the KkRseP PDZ tandem is not as close to the PCT region as the EcRseP PDZ tandem both in the crystal and on the cell membrane.
Fig. 5.
Fig. 5.. Involvement of TM4 in the substrate cleavage and dependence on residue D446.
(A) Sequence alignment of the C-terminal regions of RseP orthologs from γ-proteobacteria. Ec, E. coli; Kk, K. koreensis; Se, Salmonella enterica serovar Typhimurium; Yp, Yersinia pestis; Vc, Vibrio cholerae; Hi, Haemophilus influenzae; Pm, Pasteurella multocida; Pa, Pseudomonas aeruginosa; Xf, Xylella fastidiosa. Conserved (100% match) and similar (≥50% match) residues are boxed in black and gray, respectively. (B) Complementation assay. Cultures of E. coli KK31 cells carrying plasmids for EcRseP under the lac promoter (pYH825) or its variants were spotted on L agar plates containing IPTG or l-arabinose. A representative result from three biological replicates is shown. ΔTM4 and ΔCTail indicate the F426amber and D446amber mutations, respectively. (C) In vivo cleavage assay with long induction. KA306 cells harboring one plasmid for HA-MBP-RseA148 (pKA65) and one for EcRseP (pYH825) or its variants were grown for 3 hours with 1 mM IPTG and 1 mM adenosine 3’,5’-cyclic monophosphate (cAMP). The cleavage efficiency was determined as in Fig. 3E. Bar plots and error bars represent the means ± SD from three biological replicates. (D) Conserved residues on TM4. The residues mutated to alanine or serine in fig. S12 are shown as spheres. A disordered region containing R449 is indicated by a dotted line. (E) Specific interaction between D446 and PCT-H2. TM4, PCT-SH in the PCT-loop, and PCT-H2 are shown as stick models in salmon, magenta, and pink, respectively. D446 interacts with the electropositive N-terminal end of the PCT-H2 helix dipole where the side chain of D446 and the main-chain N─H group of S363 (each in white) form a hydrogen bond.
Fig. 6.
Fig. 6.. Cysteine-scanning mutagenesis analysis of the PCT-H2 and the adjacent regions.
(A) Substrate cleavage with short induction. E. coli KK211 (ΔrseA ΔrseP) cells harboring one plasmid for HA-MBP-RseA(LY1)148 (pYH20) and one for a variant of EcRseP(Cys-less)-His6-Myc (pTM132) were grown at 30°C in M9-based medium for 2.5 hours and further incubated for 0.5 hours with 1 mM IPTG and 5 mM cAMP. The cleavage efficiency was determined as in Fig. 3E (see fig. S15 for the raw data). Bar plots and error bars represent the means ± SD from three biological replicates. The region of each mutation is indicated by color (magenta, pink, and gold) and label. (B) DegS-independent σE activity of cells expressing RseP Cys mutants. Cells of rpoHP3-lacZ reporter strain AD2473 (ΔdegS ΔrseP) harboring pSTD343 (lacI) and a plasmid for a variant of EcRseP(Cys-less)-His6-Myc (pTM101) were grown for 5 hours in L medium containing 0.1 mM IPTG and 1 mM cAMP. The measured LacZ activities are normalized as the ratio to the activity for the reporter strain expressing WT RseP (WT). The bar plot shows the means ± SD from three biological replicates. Red dashed line indicates the threshold for deregulated cleavage of intact RseA by the RseP Cys mutants. The previously isolated L151P mutant (right) shows high LacZ activity characteristic of deregulation. WT* and L151P* indicate Cys-less derivatives of WT and L151P RseP, respectively. (C) Mapping mutations on the EcRseP model. Residues where the Cys mutation impaired the proteolytic activity are indicated with red sphere models. Residues where the Cys mutations caused deregulation are indicated with cyan sphere models.
Fig. 7.
Fig. 7.. Cross-linking experiments to examine the structural change during substrate cleavage.
(A) In vivo proteolytic activity for EcRseP after domain immobilization by disulfide cross-linking. AD2544 cells harboring an IPTG-inducible plasmid for EcRseP (pYH835) or its variants and an arabinose-inducible plasmid for HA-MBP-RseA(LY1)148 (pTM949) were first induced with 5 mM IPTG and then treated with 5 mM diamide or 10 mM DTT. Time-course diagram is shown at the top where “w” indicates a cell wash step. After washing the cells, substrate expression and cleavage were induced with 0.02% l-arabinose for 0.5 hours. The cleavage efficiency was determined as in Fig. 3E. Bar plots and error bars represent the means ± SD from three biological replicates. WT* and E23Q* indicate Cys-less derivatives of WT and E23Q RseP, respectively. Double asterisk indicates endogenous MBP. (B) Introduction of intramolecular cross-links. Six pairs of engineered Cys are indicated by a label, and their side chains are shown as stick models. Residues where the introduced pBPA was cross-linked with RseA are shown with sphere models. (C) In vivo photocrosslinking between EcRseP(Y378pBPA) and RseA. KA418 (rseA+)/pEVOL-pBpF cells with pKA52 encoding RseP(E23Q)-His6-Myc (none) or pKA52 derivatives having an amber mutation at the position of Y378 or Y69 were cultured and ultraviolet (UV)–irradiated as indicated. XL indicates the cross-linked products between RseP-HM and RseA. RseA FL and RseAΔP indicate the full-length and the DegS-cleaved form of RseA, respectively. RseP(Y69pBPA) with pBPA on the edge strand of the MREβ-sheet was used as a positive control for cross-linking. A representative result from three biological replicates is shown.
Fig. 8.
Fig. 8.. Proposed mechanism for substrate accommodation and cleavage in EcRseP.
The substrate accommodation by EcRseP is thought to be regulated by three processes. (1) Size exclusion process: The PDZ tandem restricts the entry of bulky intact substrates. After the site-1 cleavage, the size-reduced substrates become accessible to the TM domain of EcRseP. (2) Gating process: The PDZ tandem, PCT-H2, and TM4 serve as a gate to regulate the substrate entry into the active center. In the gate-closed conformation (labeled the E state), the active center is covered by the PDZ tandem, PCT-H2, and TM4 and is inaccessible to the substrate TM segment. The present study suggests that the PDZ tandem is separated from the PCT region upon substrate binding (labeled the ES state). In this gate-opening movement, PCT-H2 and TM4 are also thought to move away from the active center while maintaining an electrostatic interaction via the conserved residue D446 (indicated in orange). (3) Unwinding process: The TM segment of the substrate is extended by the edge strand of the MREβ-sheet and clamped by the conserved residue N394 (indicated with a yellow round triangle) to promote the cleavage (labeled the ES* state). We anticipate that the gate adopts a relatively closed conformation (labeled “Gate-closed*”) again to shield the substrate TM segment from the hydrophobic milieu. The crystal structure of EcRseP with batimastat (gray arrow labeled “BAT”) is thought to correspond to the EI state. The crystal structure of KkRseP with batimastat may partly reflect the ESI state, in which TM4 of the crystal packing neighbor mimics the substrate TM segment.
Fig. 9.
Fig. 9.. Substrate unwinding modes in intramembrane proteases.
(A and B) Cryo-EM structure of human γ-secretase in complex with the Notch fragment (PDB ID: 6IDF) (33). (A) γ-Secretase is composed of four subunits: presenilin 1 (PS1), nicastrin (NCT), anterior pharynx-defective 1 (APH1), and presenilin enhancer 2 (PEN-2). The Notch fragment indicated by “Substrate” in blue is accommodated in the catalytic subunit PS1. (B) Close-up view around the active site. In this structure, the active site residue D385 was mutated to alanine as highlighted in magenta. The C-terminal region of Notch is unwound by forming a hybrid β sheet with β strands (orange) in the cytosolic loop between TM6 and TM7 of PS1. The PAL motif between TM8 and TM9, highlighted with stick models, appears to fix the Notch fragment as a clamp. (C and D) Crystal structure of E. coli GlpG in complex with the substrate-derived inhibitor (PDB ID: 4QO0) (40). (C) GlpG has six TM helices and accommodates the peptide-mimetic inhibitor highlighted in blue in the cavity formed at the periplasmic side. (D) Close-up view around the active site. S201 and H254, highlighted in magenta, form the active center. The periplasmic L3 loop between TM3 and TM4 as well as the L5 loop between TM5 and TM6 (orange) sandwich the inhibitor where L3 forms a parallel β sheet with the inhibitor. L5 also appears to clamp the backbone of the inhibitor.

Similar articles

Cited by

References

    1. Brown M. S., Ye J., Rawson R. B., Goldstein J. L., Regulated intramembrane proteolysis: A control mechanism conserved from bacteria to humans. Cell 100, 391–398 (2000). - PubMed
    1. Beard H. A., Barniol-Xicota M., Yang J., Verhelst S. H. L., Discovery of cellular roles of intramembrane proteases. ACS Chem. Biol. 14, 2372–2388 (2019). - PubMed
    1. Kühnle N., Dederer V., Lemberg M. K., Intramembrane proteolysis at a glance: From signalling to protein degradation. J. Cell Sci. 132, jcs217745 (2019). - PubMed
    1. Suzuki N., Cheung T. T., Cai X. D., Odaka A., Otvos L. Jr., Eckman C., Golde T. E., Younkin S. G., An increased percentage of long amyloid β protein secreted by familial amyloid β protein precursor (βAPP717) mutants. Science 264, 1336–1340 (1994). - PubMed
    1. Selkoe D. J., Alzheimer’s disease: Genes, proteins, and therapy. Physiol. Rev. 81, 741–766 (2001). - PubMed