. 2022 Sep 13;119(37):e2210321119.
doi: 10.1073/pnas.2210321119. Epub 2022 Aug 24.

Long noncoding RNA CHROMR regulates antiviral immunity in humans

Affiliations

Long noncoding RNA CHROMR regulates antiviral immunity in humans

Coen van Solingen et al. Proc Natl Acad Sci U S A. .

Abstract

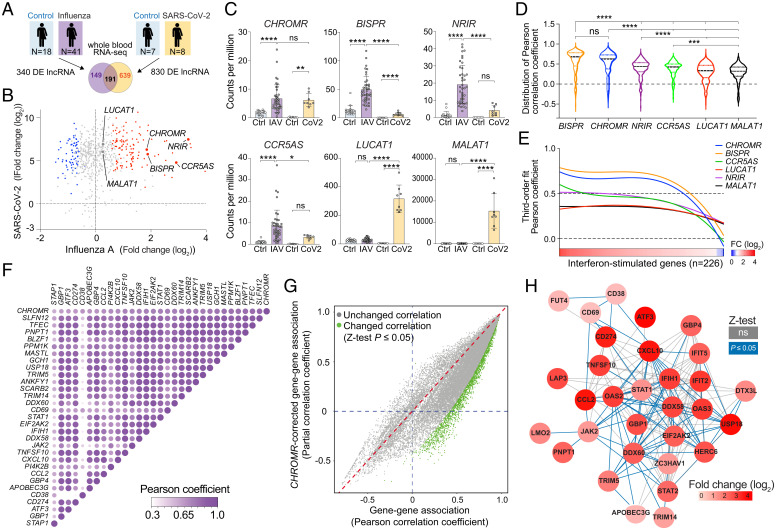
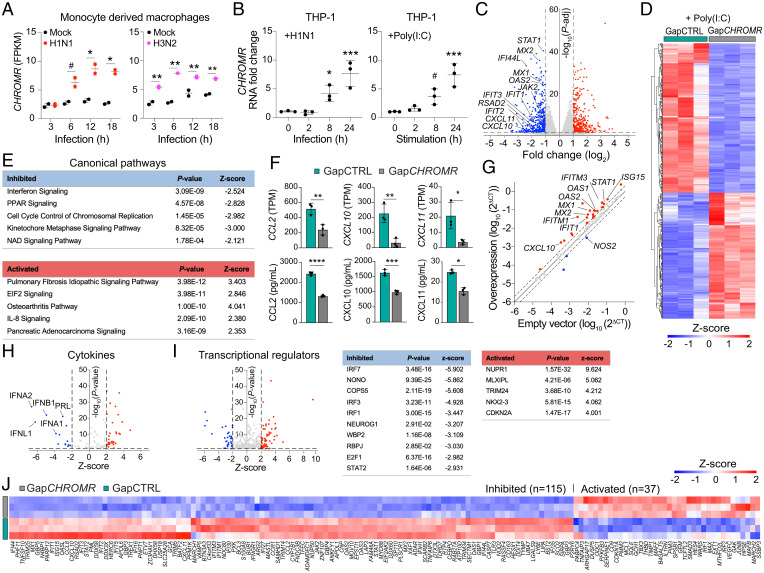
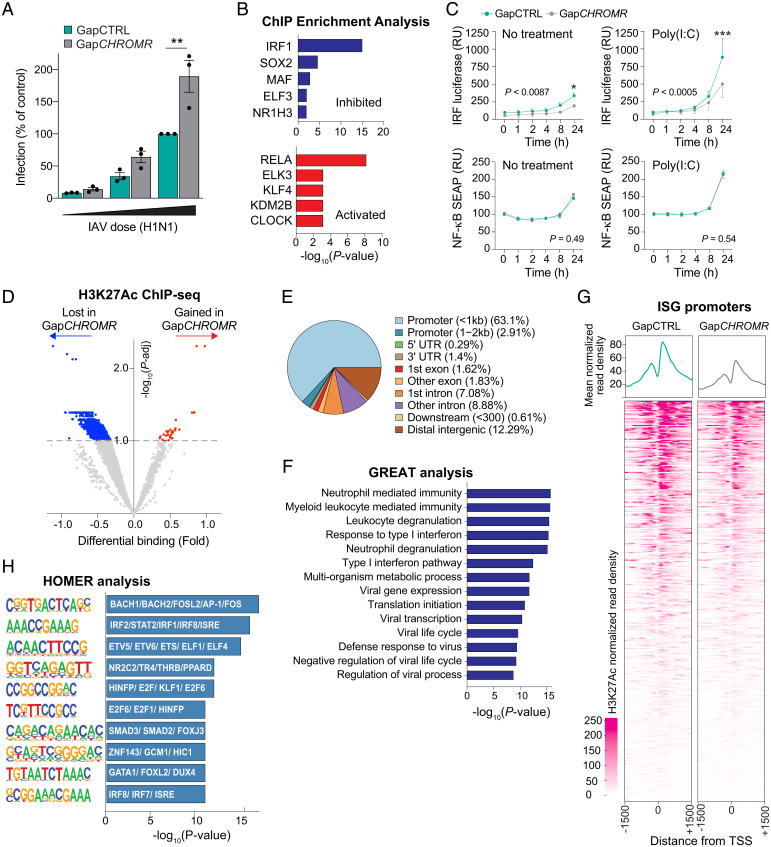
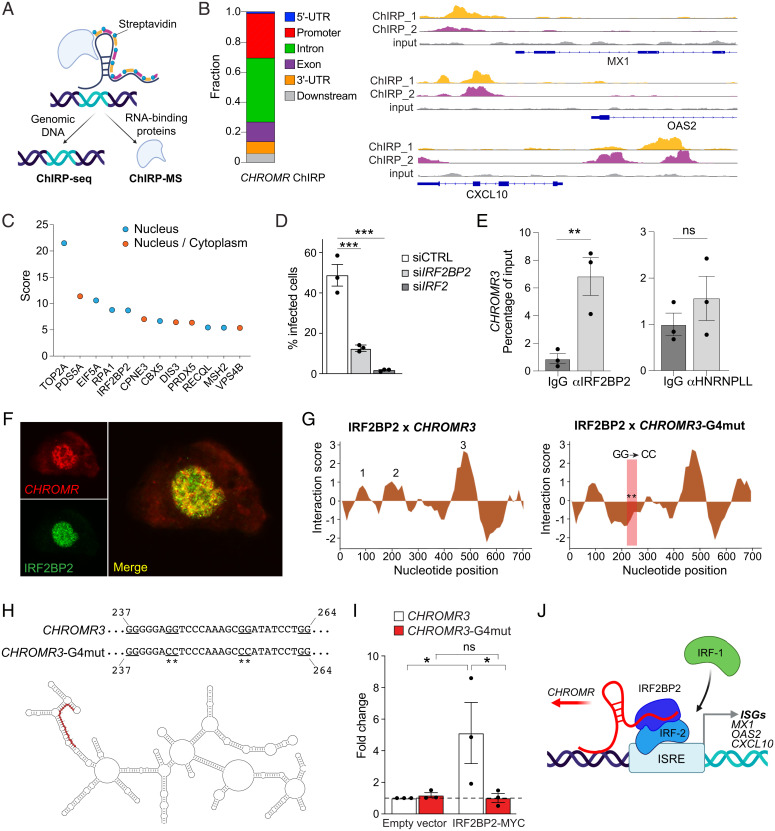
Long noncoding RNAs (lncRNAs) have emerged as critical regulators of gene expression, yet their contribution to immune regulation in humans remains poorly understood. Here, we report that the primate-specific lncRNA CHROMR is induced by influenza A virus and SARS-CoV-2 infection and coordinates the expression of interferon-stimulated genes (ISGs) that execute antiviral responses. CHROMR depletion in human macrophages reduces histone acetylation at regulatory regions of ISG loci and attenuates ISG expression in response to microbial stimuli. Mechanistically, we show that CHROMR sequesters the interferon regulatory factor (IRF)-2-dependent transcriptional corepressor IRF2BP2, thereby licensing IRF-dependent signaling and transcription of the ISG network. Consequently, CHROMR expression is essential to restrict viral infection of macrophages. Our findings identify CHROMR as a key arbitrator of antiviral innate immune signaling in humans.

Keywords: antiviral response; innate immune signaling; interferon-stimulated genes; lncRNA.


Conflict of interest statement

The authors declare no competing interest.

Figures

Fig. 1.
Fig. 1.
LncRNA CHROMR is up-regulated in patients infected with SARS-CoV-2 or IAV and correlates with transcriptional activation of antiviral gene programs. (A) Experimental design for identification of lncRNAs differentially expressed in whole blood of patients with IAV or SARS-CoV-2 and controls. (B) Scatter plot of the lncRNAs identified as commonly dysregulated in patients infected with SARS-CoV-2 and IAV by whole blood high-throughput RNA-seq. Up-regulated lncRNAs are indicated in red (n = 116) and down-regulated in blue (n = 75); −1.5 < fold change > 1.5; P-adj < 0.05. Nonsignificantly changed lncRNAs are indicated in gray. (C) Normalized transcript expression (counts per million) of CHROMR and lncRNAs described to regulate interferon responses in blood of patients infected with IAV (n = 41) or SARS-CoV-2 (CoV2, n = 8) and of control subjects (n = 18, n = 7, respectively). (D) Violin plot showing the distributions of the Pearson correlation coefficient between indicated lncRNAs and 226 differentially expressed ISGs common to IAV- and SARS-CoV-2–infected patients. (E) Robust third-order nonlinear fit of the lncRNA × ISG Pearson correlation coefficient displayed as a function of the differential expression of the ISGs. (F) Pearson correlation matrix showing the 30 ISGs that are most strongly associated with CHROMR in whole blood in IAV-infected patients. (G) Scatter plot of the Pearson coefficients of bivariate correlations between the 226 ISGs and the corresponding CHROMR-corrected partial correlation coefficients, with correlations that are significantly changed by correcting for CHROMR expression highlighted in green. . (H) CHROMR-associated ISG interactome clustered on the basis of functional relationship (edges); blue-colored lines represent functional correlations that were significantly changed upon CHROMR correction by partial correlation analysis, and gray-colored lines represent nonsignificantly changed bivariate correlations. Red shading corresponds to fold change observed in whole blood RNA-seq as shown in (B). Data are mean ± SEM (C) or ± quartiles (D), third-order polynomial nonlinear fit with robust adjustment (E). P values were calculated via one-way ANOVA, with Sidak’s multiple comparison test (C) or Kruskal–Wallis test with Dunn’s correction for multiple comparison (D). All bivariate and partial correlation analyses performed in IAV-infected patients (n = 41) (DH). All data log1p transformed for linear regression analysis (FH). Difference in correlation coefficient assessed by Fisher r-to-Z transformation followed by Z-test (G). *P ≤ 0.05; **P < 0.01; ***P < 0.001; ****P < 0.0001.
Fig. 2.
Fig. 2.
CHROMR deficiency leads to diminished expression of ISGs. (A) Time course of CHROMR expression (FPKM) in human monocyte-derived macrophages infected with A/California/04/09 (H1N1) virus, A/Wyoming/03/03 (H3N2) virus, or mock infected. (B) qPCR analysis of CHROMR in human THP-1 macrophages infected with A/WSN/1933 (H1N1) virus(1,000 PFU) or stimulated with synthetic dsRNA poly(I:C) (1 μg/mL). (C) Volcano plot showing differentially expressed genes in CHROMR-depleted (GapCHROMR-treated) and control (GapCTRL-treated) THP-1 macrophages after poly(I:C) (1 μg/mL, 8 h) stimulation and RNA-seq. Dashed lines indicate fold change (log2) = ±1; P-adj = 0.05; red dots indicate up-regulated genes; blue dots indicate down-regulated genes; gray dots indicate nonsignificantly changed genes. (D) Hierarchical clustering heatmap showing normalized gene expression values in THP-1 macrophages treated with GapCHROMR or GapCTRL in poly(I:C) stimulated conditions (1 μg/mL, 8h). Cutoffs used for visualization: −2 < fold change > 2; and P-adj < 0.05. (E) List of most affected canonical pathways identified through Ingenuity Pathway Analysis of (C) ranked by P-adj. (F) Expression of top chemokine genes differentially regulated in CHROMR-depleted and control THP-1 macrophages. Top row: RNA-seq normalized expression counts (TPM) after poly(I:C) (1 μg/mL, 8h). Bottom row: Immunoassay of protein levels after poly(I:C) (1 μg/mL, 24h). (G) Gene expression profiling of 84 interferon-stimulated genes in THP-1 macrophages stably overexpressing CHROMR or an empty vector control. Up-regulated genes are indicated in red and down-regulated genes in blue. Genes indicated are P < 0.1. (H and I) Predicted cytokine (H) and transcriptional regulators (I) of differentially expressed genes in (C); dashed lines indicate Z-score = ±2 and P-adj = 0.05; red and blue dots indicate significantly up-regulated and down-regulated factors, respectively. (J) Hierarchical clustering heatmap showing Z-scores of differentially expressed ISGs in CHROMR-depleted and control THP-1 macrophages treated with poly(I:C) (1 μg/mL) for 8h, P-adj < 0.05. Data are mean ± SEM for 2 (A), 3 (BF [Top], GJ) independent experiments, or representative of 3 independent experiments (F [Bottom]). P values were calculated via repeated measures two-way ANOVA with Sidak’s multiple comparison test (A), one-way ANOVA with Dunnett’s multiple comparison test (B), right-tailed Fisher’s exact test (E, H, and I), or two-tailed unpaired Student’s t test (F and G). #P < 0.1; *P < 0.05; **P < 0.01; ***P < 0.001; ****P < 0.0001.
Fig. 3.
Fig. 3.
CHROMR is required to restrict influenza virus and activate ISG transcription. (A) Percentage of viral infection in CHROMR-depleted (GapCHROMR-treated) and control (GapCTRL-treated) THP-1 macrophages challenged with A/WSN/1933 (H1N1) virus at increasing doses (100, 500 or 1,000 PFU). Percentages were calculated relative to GapCTRL transfection at highest infection rate. (B) Transcription factor binding enrichment scores for ISGs differentially expressed in CHROMR-depleted and control THP-1 macrophages stimulated with poly(I:C) via ChIP enrichment analysis (ChEA 2016) database gene set library. (C) Reporter assay for IRF-driven transcription (Top: luciferase; RU, relative units) or NF-κB–driven transcription (Bottom: SEAP, secreted alkaline phosphatase) in THP-1 Dual Reporter macrophages transfected with GapCHROMR or GapCTRL and left untreated or stimulated with poly(I:C) (1 μg/mL). Relative expression is normalized to time 0 (=100). (D) Volcano plot showing differential H3K27Ac modification in CHROMR-depleted and control THP-1 macrophages stimulated with poly(I:C). ChIP-seq reads that are gained or lost after CHROMR knockdown are indicated in red and blue, respectively. Dashed line indicates P-adj < 0.1. (E) Genomic distribution of H3K27Ac marks lost after CHROMR knockdown identified in D, P-adj < 0.1. UTR, untranslated region. (F) List of biological processes identified via Genomic Regions Enrichment Annotations Tool (GREAT) analysis of H3K27Ac-depleted promoter regions. (G) Metagene plots showing the mean (Top) and individual unique positions (Bottom) of normalized H3K27Ac read density around the transcription start site (TSS ± 1,500 base pairs) of ISGs in THP-1 macrophages transfected with GapCHROMR or GapCTRL. (H) Hypergeometric Optimization of Motif EnRichment (HOMER) analysis of promoter regions depleted of H3K27Ac after CHROMR knockdown, showing transcription factors with highest similarity score in motif indicated in bars. Data are mean ± SEM for three independent experiments. P values were calculated via repeated measures two-way ANOVA with Sidak’s multiple comparison test (A and C) or binomial test (B, F, and H). *P ≤ 0.05; **P < 0.01; ***P < 0.001.
Fig. 4.
Fig. 4.
CHROMR binds to IRF2BP2 to control interferon-stimulated gene expression. (A) Schematic representation of ChIRP followed by genomic DNA sequencing (ChIRP-Seq) or mass spectrometry (ChIRP-MS) to identify RNA-binding proteins. (B) Distribution of CHROMR binding sites within ISG loci (Left) and representative ChIRP-seq reads (Top: “even” probe set [ChIRP_1]; Middle: “odd” probe set [ChIRP_2]; Bottom: input) at selected ISG promoters (Right). UTR, untranslated region. (C) Nuclear CHROMR-binding proteins identified by ChIRP-MS in THP-1 macrophages from three independent experiments. (D) Percentage of cells infected with IAV/WSN/1933 (H1N1, 1,000 PFU) in THP-1 macrophages transfected with siRNAs against IRF2BP2, IRF2, or a nontargeting siRNA control (siCTRL). (E) qPCR analysis of CHROMR3 in RNA immunocomplexes precipitated from THP-1 macrophages with IRF2BP2 or HNRNPLL antibodies or IgG as a control. (F) Representative microscopic image of RNA fluorescence in situ hybridization staining for CHROMR (red) in combination with immunofluorescent staining for IRF2BP2 in THP-1 macrophages. Merged image indicates signal colocalization (yellow). (G) catRAPID predicted interaction profile of IRF2BP2 with CHROMR3 or CHROMR3-G4 mutant (position of mutation indicated by ** in boxed region). (H) Visualization of CHROMR3 secondary structure in RNArtist, with the putative IRF2BP2–G-quadruplex interaction domain highlighted in red (Bottom). Site-directed mutation of the putative G-quadruplex (underlined) in CHROMR3 (Top). (I) Relative enrichment of CHROMR3 or CHROMR3-G4mut in MYC-IRF2BP2 immunoprecipitates. (J) Integrated model depicting CHROMR binding to IRF2BP2 to sequester the IRF-2 repressor complex from ISREs, facilitating access for activating interferon regulatory factors (e.g., IRF-1). (E and I) Data are relative to IgG control; mean ± SE of three independent experiments. P values were calculated via one-way ANOVA with Dunnett’s multiple comparison test (D and I) or a repeated-measures two-way ANOVA with Sidak’s multiple comparison test (E). *P ≤ 0.05; **P < 0.01; ***P < 0.001.

References

    1. Schneider W. M., Chevillotte M. D., Rice C. M., Interferon-stimulated genes: A complex web of host defenses. Annu. Rev. Immunol. 32, 513–545 (2014). - PMC - PubMed
    1. Michalska A., Blaszczyk K., Wesoly J., Bluyssen H. A. R., A positive feedback amplifier circuit that regulates interferon (IFN)-stimulated gene expression and controls type I and type II IFN responses. Front. Immunol. 9, 1135 (2018). - PMC - PubMed
    1. Feng H., Zhang Y. B., Gui J. F., Lemon S. M., Yamane D., Interferon regulatory factor 1 (IRF1) and anti-pathogen innate immune responses. PLoS Pathog. 17, e1009220 (2021). - PMC - PubMed
    1. Crow Y. J., et al. , Cree encephalitis is allelic with Aicardi-Goutiéres syndrome: Implications for the pathogenesis of disorders of interferon alpha metabolism. J. Med. Genet. 40, 183–187 (2003). - PMC - PubMed
    1. Derrien T., et al. , The GENCODE v7 catalog of human long noncoding RNAs: Analysis of their gene structure, evolution, and expression. Genome Res. 22, 1775–1789 (2012). - PMC - PubMed

Publication types

MeSH terms